A Study of Copyrolysis Characteristics of Sewage Sludge and Waste Polypropylene
Abstract
This study investigates the copyrolysis of sewage sludge (SS) and waste polypropylene (PP). SS exhibited low heating value and high ash content, whereas PP had a high heating value and volatile content. The properties of SS and PP were analyzed, and copyrolysis process, activation energy, synergistic effects, and gas yield were investigated using thermogravimetry combined with Fourier-transform infrared spectroscopy. The results showed the existence of a three-stage synergy, and 10%PP + 90%SS showed maximum aromatic yield. The activation energy value for the blended fuel exhibited positive synergy. The Taguchi method was used to determine the operating conditions in a high-temperature furnace for the maximum C5–12/C19+ ratio and optimal pyrolysis oil quality. The PP : SS ratio was the most influencing parameter, followed by the pyrolysis temperature. 30% PP and 10% PP had the best C5–12/C19+ ratio and pyrolysis oil quality, respectively. We obtained a maximum C5–12/C19+ ratio of 9.1 and the optimal ratio of petrochemical product components (alkenes + monoaromatics) to worthless products (polyaromatics + cyclic compounds) of 4.02. The optimal experimental parameters to achieve these two targets were operated with 10% HZSM-5 and activated alumina. HZSM-5 improved the heating value, oil yield, carbon-number ratio, and pyrolysis oil quality.
1. Introduction
The amount of solid waste generated by consumers in modern society is staggering. Rapid global population growth, together with the increasing demand for commodities, has led to substantial waste generation. Current landfill practices are unsustainable in the long term, with land suitable for landfill use becoming more difficult to obtain, and the costs associated with environmental treatment that mitigate land pollution are increasing. For instance, the rapid development of China’s economy coincided with a significant population increase from 963 million in 1978 to 1.33 billion in 2008, while the domestic waste generation grew at a rate of 8–10% per annum (more than 150 million tons of household waste/year) [1]. According to the Environmental Protection Agency, Taiwan produced 9.9 million tons of waste in 2020 [2], and this number is still increasing. Landfilling is the most popular waste disposal method in Europe. The increasing cost of land today makes landfilling economically unprofitable, which is why EU regulations strictly limit landfilling and encourage recycling [3]. Therefore, converting (recycling) suitable solid waste into energy and thereby reducing its environmental accumulation is a feasible option. In addition, with the rapid increase in global energy demand and the urgent need to reduce carbon emissions, renewable energy is considered a pivotal option for replacing traditional fossil fuels.
Biomass is a widely accepted abundantly available renewable energy source that can be converted into various fuels. Biomass waste includes solid residues from agriculture, forestry, food production, and municipal organic waste. Sewage sludge (SS) from sewage treatment plants is a major municipal waste product that has long been a severe environmental problem. The high moisture and ash content, heavy metal contaminants, and their complex compositions in SS make its disposal difficult. Pyrolysis has been widely used to treat biomass waste in recent years. This treatment method thermally decomposes sludge to produce a variety of valuable products (such as bio-oil and biochar), with a lower environmental impact than other heat treatment methods such as incineration and gasification. Many studies have been conducted on SS pyrolysis. It has been shown that SS pyrolysis provides maximum liquid yields in the temperature range of 450–550°C [4–9]. The liquid product obtained by sludge pyrolysis is alkaline with an aqueous-phase pH of 8–10, which is mainly due to the proteins in the SS as well as some ammonia- and nitrogen-containing compounds [10, 11]. Shen et al. [6] studied the effect of pyrolysis temperature on the molecular weight distribution of the liquid compounds produced and defined the lighter organic compounds (molecular weights < 150) in the liquids to be “pyrolysis oils” and the heavier organic compounds (molecular weights > 150) as “tars.” The average molecular weight of the organic products decreased with increasing pyrolysis temperature, owing to the thermal decomposition of heavier compounds. Longer gas residence times favor higher proportions of light compounds (oils) because thermal cracking of heavy compounds requires more time. Stammbach et al. [5] also mentioned that the gas yield and pyrolysis oil yield selectivities are improved during SS pyrolysis by reducing the tar yield.
The annual global demand for plastics has skyrocketed since the commencement of the plastics industry. In addition to the difficulties associated with the natural biodegradation of plastics, landfills containing medical waste present problems, including viral infectivity. Many strategies have been proposed for the proper utilization of waste plastics, particularly for the production of fuel and energy, to avoid environmental pollution. Among them, pyrolysis is considered the most promising thermochemical treatment route, as it converts nonbiodegradable waste plastics into liquid oil, syngas, and char and enables the conversion of waste into usable energy. Ding et al. studied pyrolysis behaviors, products, reaction mechanisms, and pathways of two medical plastic wastes [12]. Medical bottles exhibited a better pyrolysis performance with less residues and a higher degradation rate. Xu et al. investigated the pyrolysis mechanisms and volatile products of medical masks and infusion tube [13]. The main gaseous products were classified, and it provided new insights for recovering the persistent pollutants into high value-added products. Compared with biomass pyrolysis, plastic pyrolysis can provide products with high hydrogen content and heating values, as well as pyrolysis oil and syngas with low oxygen content, thereby improving the quality of the oil.
Many recent studies have examined the copyrolysis of waste plastics and solid biomass by focusing on experimental operating conditions, reactor types, liquid yield optimization, reaction kinetics [14, 15], fuel heating behavior [16], and synergistic effects on the products [17–19]. The copyrolysis of waste plastics and solid biomass has been suggested to produce positive synergistic effects, which in turn can improve the product quality [15, 20]. Waste plastics typically have high hydrogen-to-carbon (H/C) ratios and relatively low oxygen-to-carbon (O/C) ratios, which can neutralize the high O/C and low H/C ratios of solid biomass during copyrolysis, thereby improving the quality and homogeneity of the products while minimizing biomass char deposition [17–19]. Some copyrolysis studies have also focused on the synergy between the chemical compositions of plastic and solid biomass copyrolysis oils. Many reports have reported effective increase in the yield and selectivity for aromatic hydrocarbons during copyrolysis of plastics and solid biomass, resulting in the increased formation of benzene, toluene, xylene, and ethylbenzene (BTEX). Zheng et al. [21] reported nonlinear increase in the yield of aromatics with an increasing proportion of straight-chain plastics during the copyrolysis of plastics with solid biomass, where the highest yield was obtained at a 1 : 1 ratio. Dewangan et al. [22] reported that plastics promoted the formation of long-chain hydrocarbons and saturated hydrocarbons, with the copyrolysis oil carbon number ranging between C6 and C25. Chattopadhyay et al. [23] observed the highest yield of petrochemical products (aromatics and alkenes) at a 1 : 5 biomass/plastic blending ratio during pyrolysis. Duan et al. [24] reported pyrolysis oil to contain mainly cycloalkanes and aromatic hydrocarbons during the copyrolysis of lignin and PP, with a significantly lower char yield.
Despite the significant improvements in the product yields from plastic–biomass copyrolysis compared with those in solid biomass pyrolysis alone, further yield enhancement of the high-quality pyrolysis oil and increasing selectivity toward valuable components are more difficult to achieve in the absence of a catalyst [25]. Addition of a catalyst not only provides product selectivity but also has the complementary advantages of thermally decomposing the feedstock and accelerating the pyrolysis reactions at lower temperatures. Zeolite and alumina catalysts are commonly used in pyrolysis process involving plastics and solid biomass. Zhou et al. [26] reported that the addition of a ZSM-5 catalyst during the copyrolysis of plastics and cellulose significantly increased the yield of valuable petrochemicals (monoaromatics and alkenes), lowered the amount of unwanted polyaromatics, and greatly improved product distribution. Zhang et al. [27] copyrolyzed low-density polyethylene (LDPE) and cellulose to produce jet-fuel-range (C8–C16) alkanes. The addition of an activated ZSM-5 catalyst exhibited high selectivity and considerable synergism for aromatic hydrocarbons in the C8–C16 range, and catalytic copyrolysis significantly improved the positive cellulose/LDPE synergism. Duan et al. [24] studied the copyrolysis of PP and biomass, in which aromatics and cycloalkanes were the main components. The proportion of cycloalkanes was observed to decrease, while the aromatic content increased with increasing catalyst load because of the catalytic performance of HZSM-5. The bio-oil yield also decreased in the ex situ catalytic copyrolysis process upon addition of the catalyst, with a feedstock/catalyst ratio 2 : 1 providing the minimum char yield. Activated alumina (γ-alumina) catalysts have been shown to effectively increase the yields of alkanes and alkenes during the pyrolysis of SS [28–30]. The mechanism of the deoxygenation of triglycerides to aliphatic hydrocarbons by activated alumina has also been investigated [28]. Chen et al. found that catalytic pyrolysis can improve the quality of pyrolytic oil, and the addition of γ-alumina decreases the pyrolysis temperature of castor meal. In addition, the deoxygenating ability of γ-alumina is greater than that of the ZSM-5 catalyst [31].
In Taiwan, the treatment of sewage sludge and waste plastics is one of the important issues to be solved. Sewage sludge and waste plastics have both advantageous and disadvantageous characteristics, which may be complemented by copyrolysis. For example, SS has a high ash content and a low heating value. Waste plastic has a high heating value, but it is experimentally problematic owing to its poor thermal conductivity and the high viscosity of the molten material. Although there are many studies on the pyrolysis of sewage sludge or waste plastics in the literature, studies on the copyrolysis of SS and waste plastics are limited, especially regarding the optimal pyrolysis conditions and the characteristics of copyrolysis oil. Therefore, SS and waste polypropylene, a major plastic waste type, were copyrolyzed in this study, and the characteristics of the pyrolysis products were discussed and optimized. This study first used proximate, elemental, and heating-value analyses to examine the fuel properties of SS and polypropylene (PP). A thermogravimetric analyzer was then combined with a Fourier-transform infrared spectrometer to explore the thermal behavior and chemical reactions, analyze the produced gas components, and study the activation energy changes and synergistic effects. Finally, the Taguchi method was used to determine the experimental operating conditions for copyrolysis, to achieve optimal pyrolysis oil quality from SS and PP. In addition, the effects of the catalysts (catalytic copyrolysis) were examined, and their effects on the chemical composition of the copyrolysis oil were studied.
2. Experimental Method
2.1. Raw Materials
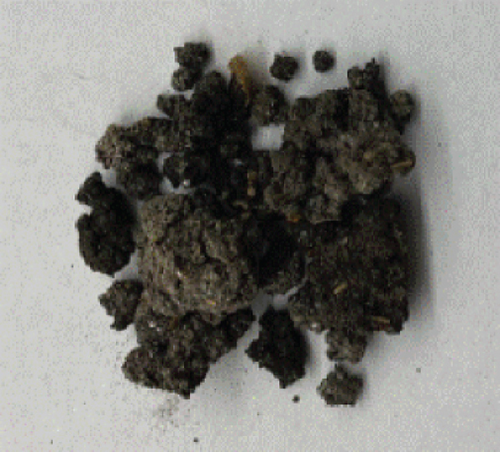
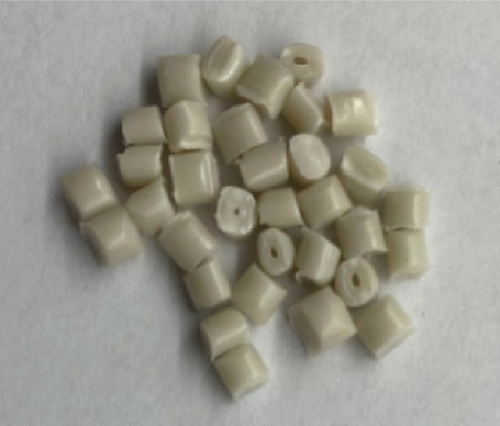
Two raw materials were used in this study: sewage sludge (SS) and waste polypropylene (PP). The SS, which was also used for cogasification with palm kernel shells in our previous study [32], was obtained from a sewage treatment plant in Tainan City, Taiwan. The PP made from recycled waste plastic (P1001) was purchased from a waste plastic recycling company (Horng En Group) in Taiwan. The SS was exposed to sunlight for 24 h prior to experimentation to remove moisture and to ensure experimental consistency, followed by oven drying at 105°C for 12 h. The dried SS and PP were crushed using a crusher and sieved to a particle size < 80 mesh. The SS and PP processed in this manner are shown in Figures 1(a) and 1(b), respectively. The copyrolysis process yielded solid, liquid, and gaseous products, which were divided into oil and aqueous phases. This study focuses on pyrolysis oil.
Two catalysts were used during copyrolysis: a ZSM-5 zeolite catalyst (SiO2/Al2O3 = 400, CAS:308081-08-5) and an activated alumina catalyst (Al2O3), which were purchased from Youhe Trading Co., Ltd., Taiwan, and contained 80–160 mesh particles. ZSM-5 was calcined at 550°C in air for 2 h prior to experimentation to facilitate the formation of HZSM-5 and improve catalyst activity.
2.2. Experimental Setup
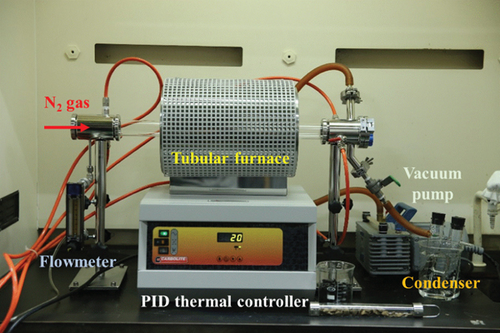
2.3. Thermogravimetry Combined with Fourier-Transform Infrared Spectroscopy (TG-FTIR)
Thermogravimetry (TG) curves show how the weights of the raw materials change with time or temperature according to the thermogravimetric temperature profile used, while differential thermogravimetry (DTG) curves of the weight loss rates were obtained by differentiating the TG curves. The degree of devolatilization of the raw material can be determined from the amplitude of the curve at a specific temperature. Chemical reaction kinetics can also be analyzed from the TG curves obtained at single or multiple heating rates. The values of kinetic parameters, such as the activation energy, reaction constant, and preexponential factor can also be obtained indirectly. Thermogravimetric analysis (TGA) was performed using a vertical thermogravimetric analyzer (STA 8000, PerkinElmer) with a weight-detection sensitivity of 0.2 μg. During the experiment, the sample (~15 mg) contained in an alumina crucible was placed on the TGA balance, followed by temperature increase from room temperature to a maximum value of 1000°C.
The yield and distribution trends of gases generated during the copyrolysis of SS and PP at various mixing ratios were investigated using TGA in series with TG-FTIR. A PerkinElmer (Spectrum Two) FTIR instrument that operates in the 4000–450 cm−1 range (midinfrared light) with a resolution of 1 cm−1 was used with a sampling frequency of four times per minute. The types of gas molecules or functional groups studied include alkanes, alcohols, phenols, ethers, and lipids (1475–1000 cm−1); aromatics (1690–1450 cm−1); aldehydes, ketones, and acids (1900–1650 cm−1); CO (2250–2000 cm−1); CO2 (2400–2250 cm−1); CH4 (3000–2700 cm−1); C-H (3100–2850 cm−1); and O-H (4000–3500cm−1).
2.4. Gas Chromatography–Mass Spectrometry (GC/MS)
Gas chromatography–mass spectrometry (GC/MS) combines the characteristics of both gas chromatography and mass spectrometry. Analytical chromatography can be used to identify the chemical composition of various substances in a sample. A Shimadzu GCMS-QP2020 GC/MS instrument fitted with a 30.0 m × 0.32 mm × 0.1 μm chromatography column was used in this study. Helium was used as the carrier gas at a flow rate of 3.0 mL/min, and 1 μL of the sample was injected into the automatic sampling area. The operation conditions were initial temperature at 60°C for 7 min and then heating to 270°C at 6.0°C/min for 8 min. GC/MS was used to qualitatively and quantitatively analyze the samples following each pyrolysis experiment.
2.5. Taguchi Method
The orthogonal array in the Taguchi method is typically expressed as La(bc), where a is the total number of experiments, b is the number of control factors, and c is the level number of control factors. The combination of the number of control factors and the number of levels must be considered when selecting a suitable orthogonal array. In this study, four control parameters and four parameter variables were selected, and the orthogonal array is expressed as L16(44).
3. Result and Discussion
3.1. Fuel Properties of Sewage Sludge and Polypropylene
Table 1 lists the proximate and elemental analysis results for SS and PP, which show that compared to SS, PP contains very high levels of volatile matter and very low moisture content (0.18%, not shown in the table), with almost zero ash and fixed carbon. On the other hand, SS has a relatively high ash content, which is also the main reason for its significantly lower heating value. In addition, elemental analysis also revealed that PP has higher carbon (85.29%) and hydrogen (14.07%) contents, whereas SS has a high oxygen content and low carbon content, which limits its pyrolysis performance resulting in low-quality products [35]. Hence, the addition of plastics improved the pyrolysis properties of SS and the product quality. High ash and fixed carbon yield in SS usually lead to the formation of char during pyrolysis. Except for a small amount of moisture, PP is almost converted to volatile matter, enabling it to easily form gaseous and liquid products. Further, the high heating value (HHV) of PP (46.35 MJ/kg), which is equivalent to that of gasoline (approximately 42–45 MJ/kg) indicates its potential to regenerate fuel. In contrast, high heating values of SS on dry basis (14.86 MJ/kg, ~one-third that of PP) and under dry and ash-free conditions (22.18 MJ/kg, ~half that of PP) are relatively low. Copyrolysis of PP with CC can overcome the disadvantages of SS as a renewable energy source through pyrolysis route.
| Sample | Proximate analysis (wt%, dry basis) | HHVdb (MJ/kg) | ||
|---|---|---|---|---|
| Volatile matter | Ash | Fixed carbon | ||
| SS | 53.64 | 33.05 | 13.30 | 14.86 |
| PP | 100 | 0 | 0 | 46.35 |
| Sample | Elemental analysis (wt%, dry basis) | ||||
|---|---|---|---|---|---|
| C | H | N | S | O | |
| SS | 30.53 | 4.53 | 4.3 | 2.09 | 34.82 |
| PP | 85.29 | 14.07 | 0 | 0.59 | <0.1 |
- O (%) = 100–ash (%)–C (%)–H (%)–N (%)–S (%).
In this study, the pH values of pure SS and PP pyrolysis oils and copyrolysis oils were measured. PP pyrolysis oil was slightly acidic (pH ~6), whereas SS pyrolysis oil was slightly alkaline (pH ~9), and the pH of the copyrolysis oil was ~7–8. Clearly, PP and SS copyrolysis affects the acidity/basicity in a manner that leads to neutralization, overall improving the quality of the oil produced.
3.2. TG-FTIR Analysis
3.2.1. Thermogravimetric Analysis
Figures 3 and 4 show the thermogravimetric data of the pure PP and SS samples, respectively. Thermogravimetry was performed in a nitrogen atmosphere from the room temperature to 1000°C, at heating rates of 10, 20, and 30°C/min. The figure clearly shows that PP exhibited only one reaction stage (approximately 380–520°C) during pyrolysis. The maximum weight loss rate was 27.3%/min at 458.8°C, which is ascribable to volatiles and is consistent with the proximate analysis results that show that PP produces almost entirely volatiles. SS exhibited three reaction stages during pyrolysis. The first stage (approximately 30–180°C) corresponds to a slight weight change associated with the loss of moisture, with a maximum weight loss rate of 0.23%/min observed at 73.5°C. The second stage (about 180–600°C) mainly corresponds to devolatilization, with two main weight loss peaks (i.e., 2.22%/min at 274.7°C and 2.14%/min at 324.5°C). The 180–300°C range mainly corresponds to the degradation of light organic compounds such as esters [36], whereas the 300–600°C range is associated with the degradation of heavier organic compounds such as cellulose and proteins [37]. The third stage (>600°C) corresponds to the degradation of inorganic minerals, with a weight loss rate of 0.56%/min observed at 887.6°C.
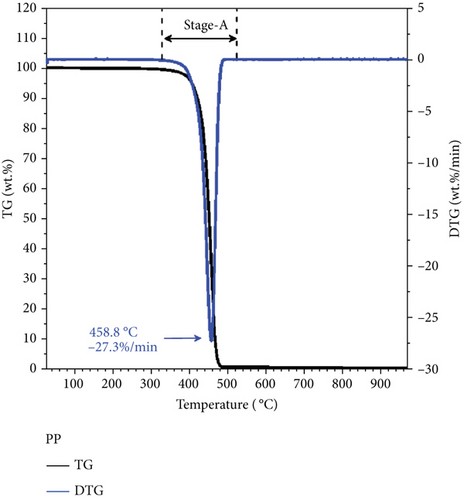
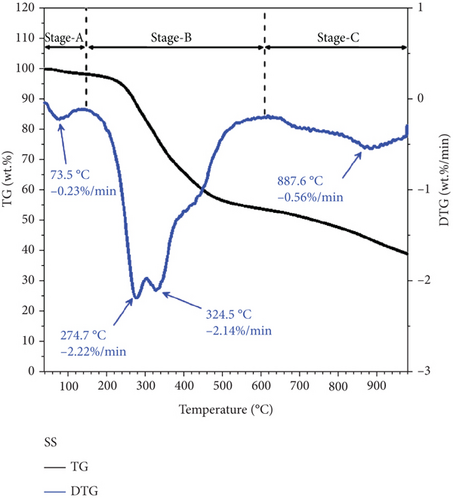
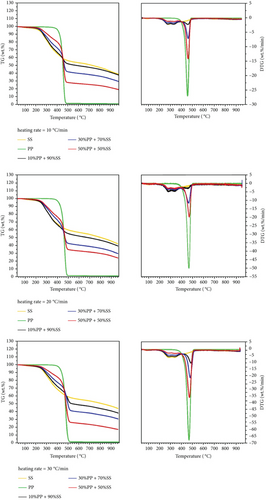
Figure 5 shows the thermogravimetric data of the copyrolysis of SS and PP at various mixing ratios and heating rates. The figure reveals that all degradation occurs in the relatively narrow temperature (200–550°C) range. Changes in the DTG curve reveal that the main peaks can be divided into SS-dominant (between 200 and 400°C) and PP-dominant (between 400 and 550°C) peaks. Maximum weight loss rates clearly increase significantly with increasing mixing ratio and heating rate. The effect of heating rate on activation energy can be explored by examining weight losses at various heating rates.
3.2.2. FTIR Analysis
Figure 6 shows the released pyrolysis gas detected by the TG-FTIR analysis at various SS and PP mixing ratios. The generation of CO and CO2 during the copyrolysis of plastics and solid biomass is attributable to the presence of a large number of oxygen atoms in solid biomass [19, 38]. Elemental analysis revealed that PP has high atomic carbon and hydrogen content, whereas SS has high oxygen contents, differing significantly in their C, H, and O contents. Therefore, synergy favors the generation of increasing numbers of OH radicals with increasing pyrolysis temperatures. These OH radicals help to destroy the PP polymer chain or SS aromatic rings and react with aliphatic compounds (alkanes or alkenes) to generate more CO and CO2 [19]. Figure 6(c) shows the O-H trends for various mixing ratios. Synergy was observed during the copyrolysis of 10%PP + 90%SS, which led to the highest yield.
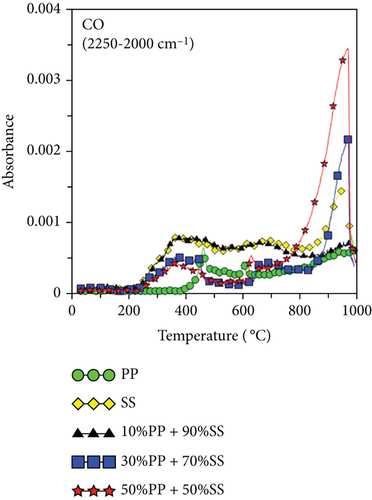
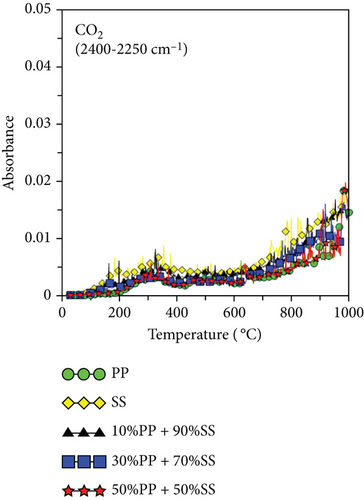
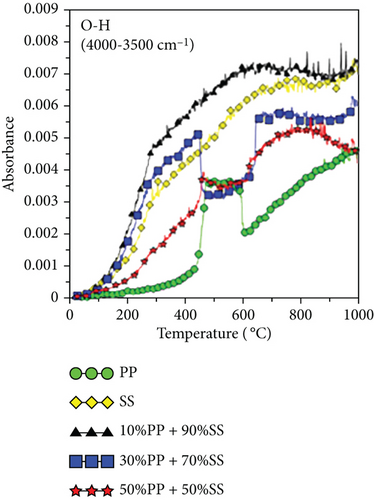
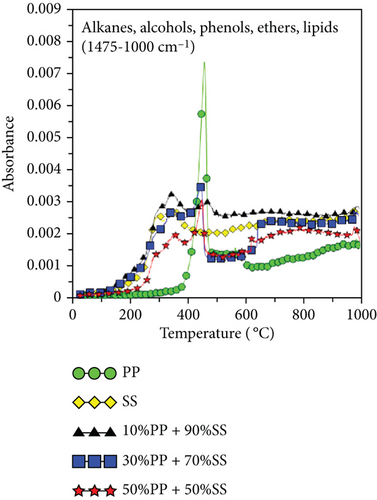
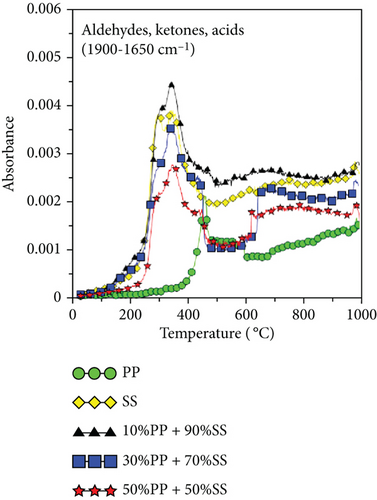
Figures 6(e) and 6(f) also show the aldehydes, ketones, acids, alkanes, alcohols, ethers, phenols, and lipid components of volatile gases. SS is mainly composed of lipids and proteins, which generate alcohols and acids through esterification. These volatile gases include aldehydes, ketones, acids, alkanes, alcohols, ethers, phenols, and lipids. Their generation is attributable to the decomposition of PP (polyolefin polymer) and SS (organic compounds such as cellulose and proteins) through a series of reactions, such as random free radical chain scission, dehydrogenation, cyclization, and polymerization, which decompose aliphatic compounds. As shown in Figure 6(c), the highest O-H yield was observed during the copyrolysis of 10%PP + 90%SS; consequently, the same trend was also observed in Figures 6(e) and 6(f), which implies that the copyrolysis of 10%PP + 90%SS affords higher yields of aliphatic compounds. Some of the CO produced is formed through the decomposition of ethers and alcohols, whereas CO2 is produced by decarboxylation [39], which liberates CO2 from organic compounds.
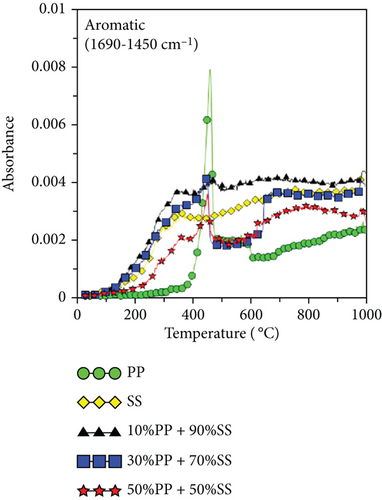
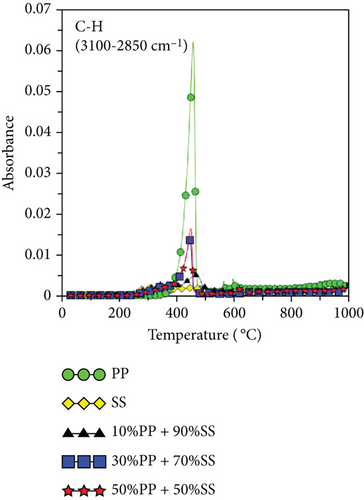
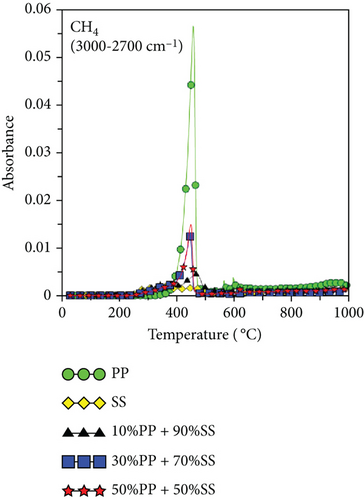
Because PP plastic is a hydrocarbon, the C-H and CH4 contents increased as the proportion of PP increased, as shown in Figures 6(g) and 6(h). It is worth noting that copyrolysis synergy was observed in the aromatic volatile gas content; 10%PP + 90%SS copyrolysis exhibited the highest aromatic volatile gas content, while pure SS and 30%PP + 70%SS yielded similar aromatic contents, followed by 50%PP + 50%SS and pure PP (Figure 6(d)). This result was verified using subsequent GC-MS data. As proposed by Dorado et al. and Li et al. [40, 41], Diels–Alder reactions between biomass-derived oxygenates and plastic-derived polyolefin compounds are mainly responsible for higher aromatic compound yields.
3.2.3. Activation Energy
The Coats–Redfern method [42] and the Flynn-Wall-Ozawa (FWO) method [43] were used in this study to determine the activation energies for the copyrolysis reactions of PP and SS at various heating rates (10, 20, and 30°C/min) (Table 2). The copyrolysis DTG curve in Figure 5 reveals that most weight is lost between 200 and 600°C during copyrolysis. Therefore, in this study, the activation energies of the main pyrolysis zone were determined in this temperature range.
| Heating rate (°C/min) | Activation energy (kJ/mol) | Coefficient of determination (R2) | |
|---|---|---|---|
| PP | 10 | 108.17 | 0.95 |
| 20 | 113.46 | 0.95 | |
| 30 | 114.75 | 0.96 | |
| SS | 10 | 38.51 | 0.84 |
| 20 | 40.34 | 0.84 | |
| 30 | 41.74 | 0.86 | |
| 10%PP + 90%SS | 10 | 40.98 | 0.87 |
| 20 | 41.68 | 0.86 | |
| 30 | 44.52 | 0.9 | |
| 30%PP + 70%SS | 10 | 47.69 | 0.91 |
| 20 | 48.64 | 0.92 | |
| 30 | 49.3 | 0.92 | |
| 50%PP + 50%SS | 10 | 55.15 | 0.93 |
| 20 | 52.87 | 0.93 | |
| 30 | 57.85 | 0.93 | |
Table 2 shows the activation energy estimated by the Coats–Redfern method. Compared with SS, the PP pyrolysis process requires a higher average activation energy (~108–114 kJ/mol) than the SS pyrolysis process (~38–41 kJ/mol). The activation energy required for copyrolysis process increases as the amount of PP in the mixture increases, which is consistent with literature results on copyrolysis of plastics and solid biomass [44]. SS and PP appear to exhibit positive synergy based on how the activation energy changes with the mixing ratio. Taking the activation energy for 50%PP + 50%SS at a heating rate of 10°C/min as an example, the theoretical activation energy average is 73.34 kJ/mol (108.17 kJ/mol, the activation energy of PP at a heating rate of 10°C/min, and 38.51 kJ/mol, the activation energy of SS at a heating rate of 10°C/min), but the actual activation energy is only 55.15 kJ/mol. This result confirms that a positive synergy in SS and PP copyrolysis helps reduce the activation energy required for the reaction. The activation energy also showed a slightly increasing trend with increasing heating rate.
Table 3 shows the activation energy estimated by the FWO method. Activation energy is calculated from the conversion α = 10 to 90%. Under most conditions, R2 is greater than 0.95, except when α is equal to 10% and 20% under 50%PP + 50%SS, R2 is 0.85 and 0.86, respectively. In Table 3, the results indicate that the activation energy of pure SS is higher than that of pure PP, which is obviously different from the results obtained by the Coats–Redfern method. Miskolczi et al. also found that the activation energies for pyrolysis processes varied widely in the cases of municipal sewage sludge or distillery sludge [45]. However, SS and PP also exhibit obvious positive synergy in the activation energy for the FWO method. For 10%PP + 90%SS, the theoretical activation energy average is 292.84 kJ/mol but the actual value is 132.97 kJ/mol. The theoretical activation energy average is 281.85 kJ/mol but the actual value is 183.83 kJ/mol for the case of 30%PP + 70%SS. For the case of 50%PP + 50%SS, the theoretical activation energy average is 270.82 kJ/mol but the actual value is 207.01 kJ/mol. In addition, under all mixing ratio conditions, the actual activation energies of different α are significantly smaller than the theoretical values and it confirms positive synergistic effects during the copyrolysis processes.
| α = 10% | 20% | 30% | 40% | 50% | 60% | 70% | 80% | 90% | Average | ||
|---|---|---|---|---|---|---|---|---|---|---|---|
| PP | Ea | 267.5 | 256.24 | 250.31 | 246.45 | 243.18 | 239.19 | 235.99 | 230.9 | 220.83 | 243.4 |
| R2 | 0.97 | 0.99 | 0.99 | 0.99 | 0.99 | 0.99 | 0.99 | 0.99 | 0.99 | ||
| SS | Ea | 297.66 | 260.66 | 255.51 | 264.6 | 267.79 | 289.77 | 339.16 | 346.24 | 363.54 | 298.33 |
| R2 | 0.99 | 0.99 | 0.99 | 0.99 | 0.99 | 0.99 | 0.99 | 0.99 | 0.99 | ||
| 10%PP + 90%SS | Ea | 177.63 | 145.7 | 132.49 | 121.04 | 103.44 | 94.31 | 106.79 | 138.83 | 176.48 | 132.97 |
| R2 | 0.99 | 0.99 | 0.99 | 0.98 | 0.97 | 0.96 | 0.96 | 0.97 | 0.99 | ||
| 30%PP + 70%SS | Ea | 189.2 | 175.85 | 160.09 | 162.96 | 185.59 | 195.7 | 198.02 | 195.32 | 191.74 | 183.83 |
| R2 | 0.99 | 0.99 | 0.99 | 0.99 | 0.99 | 0.99 | 0.98 | 0.98 | 0.98 | ||
| 50%PP + 50%SS | Ea | 122.72 | 102.76 | 201.75 | 243.32 | 248.38 | 245.63 | 241.39 | 233.96 | 223.17 | 207.01 |
| R2 | 0.85 | 0.86 | 0.99 | 0.99 | 0.99 | 0.99 | 0.99 | 0.99 | 0.99 | ||
3.2.4. Synergy
The synergies associated with the thermogravimetric changes observed during the copyrolysis of SS and PP are shown in Figure 7. Based on the TG-FTIR data, TG and DTG curves were subtracted from the theoretical TG and DTG curves calculated according to the mixing ratio in this study. With positive or negative changes obtained in the 200 to 600°C temperature range (volatilization stage), these changes can be used to understand the synergy in the system, where a positive value represents inhibition and a negative value represents promotion. Figure 7 shows that synergy can be roughly divided into three stages. The first synergy stage occurring at ~300–400°C is associated with promotion, which corresponds to the decomposition temperature range of SS esters and the release of light plastic volatiles. The SS + PP mixture had a positive effect in this range. ΔTG showed a similar positive effect.
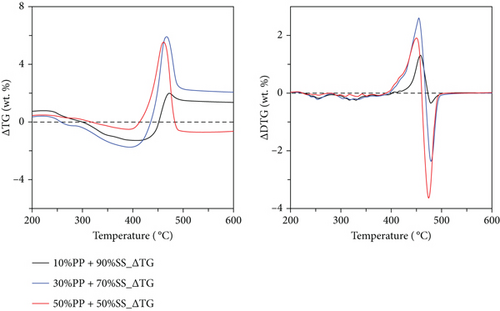
The second synergy stage occurs at 400–450°C; however, it is inhibitory in this range because plastic decomposition in this temperature range produces a large amount of highly viscous tar that may lead to a gelatinous coating on the SS, resulting in a more difficult release of volatile substances from SS. Figure 6(d) shows that a high volatile aromatic gas content was detected at 400–450°C for PP; the aromatic benzene structure is a major component of tar [46]; therefore, these gases are pyrolysis by-products caused by incomplete decomposition. ΔTG showed a similar inhibitory effect in this temperature range.
The third synergy stage occurred at approximately 450–500°C and was mainly promoting. The promotion in this stage is ascribable to the rapid decomposition of PP and the formation of volatile gases at higher temperatures. Because the oxygen-containing compounds in SS accelerate the decomposition of plastics [21], a large amount of positive synergy was observed. ΔTG data revealed that 50%PP + 50%SS exhibited a promoting effect, whereas the remaining mixtures showed inhibitory effects.
3.3. Optimization of the Copyrolysis Process Using the Taguchi Method
In this study, an L16(44) orthogonal table was employed to determine the optimal PP and SS copyrolysis process using the Taguchi method. The experimental settings included temperature (400, 450, 500, and 550°C), feedstock residence time (0.5, 1, 1.5, and 2 h), PP-to-SS ratio (0 : 10, 1 : 9, 3 : 7, and 5 : 5), and N2 gas-flow rate (100, 200, 400, and 600 mL/min). They are sorted into an L16(44) orthogonal table, as shown in Table 4. In this experiment, the Taguchi method was used to optimize two processes: the optimal carbon number ratio C5–12/C19+ and pyrolysis oil quality ((alkenes + monoaromatics)/(cycloaliphatics + polyaromatics)). Most literature reports the use of the Taguchi method to study oil yield, and the quality and carbon number distribution of pyrolysis oil were rarely considered. Currently, we found no research on the copyrolysis of sewage sludge and waste plastics, which is investigated in this study.
| Experiment number | Temperature (°C) | Residence time (h) | PP : SS | Flow rate (mL/min) |
|---|---|---|---|---|
| 1 | 400 | 0.5 | 0 : 10 | 100 |
| 2 | 400 | 1 | 1 : 9 | 200 |
| 3 | 400 | 1.5 | 3 : 7 | 400 |
| 4 | 400 | 2 | 5 : 5 | 600 |
| 5 | 450 | 0.5 | 1 : 9 | 400 |
| 6 | 450 | 1 | 0 : 10 | 600 |
| 7 | 450 | 1.5 | 5 : 5 | 100 |
| 8 | 450 | 2 | 3 : 7 | 200 |
| 9 | 500 | 0.5 | 3 : 7 | 600 |
| 10 | 500 | 1 | 5 : 5 | 400 |
| 11 | 500 | 1.5 | 0 : 10 | 200 |
| 12 | 500 | 2 | 1 : 9 | 100 |
| 13 | 550 | 0.5 | 5 : 5 | 200 |
| 14 | 550 | 1 | 3 : 7 | 100 |
| 15 | 550 | 1.5 | 1 : 9 | 600 |
| 16 | 550 | 2 | 0 : 10 | 400 |
Although the addition of plastic improves the quality of the pyrolysis oil produced by the copyrolysis of SS, the addition of a catalyst helps to further improve the pyrolysis products (including heating value and product selectivity). Zeolite catalysts are most often used in biomass catalytic pyrolysis, with ZSM-5 being the most effective catalyst in the zeolite series [47]. HZSM-5 is formed by the calcination of ZSM-5 (in air at 550°C for 2 h or at 500°C for 5 h) and is activated to enhance its catalytic performance. There are few reports on the use of alumina as a catalyst for copyrolysis of biomass and plastics. Among the various types of alumina, γ-alumina is the most active; therefore, it is also referred to as “activated alumina.” It is also less expensive than ZSM-5. This section discusses the copyrolysis of SS and PP with HZSM-5 and activated alumina as catalysts and the changes in the carbon number and chemical composition. In this study, the abovementioned catalysts were used in experiments conducted under optimal conditions. A 1 : 10 mass ratio of catalyst to feedstock was used to investigate its influence on the formation of polyaromatic and cyclic compounds in the pyrolysis oil. The catalysts are expected to promote the conversion of polyaromatic compounds into valuable monoaromatic compounds and alkenes and cyclic aliphatic compounds into relatively stable straight-chain or branched-chain aliphatic compounds, while reducing the carbon number distribution and improving pyrolysis oil quality. Simultaneously, changes in the product distribution and heating value of the pyrolysis oil during catalytic copyrolysis were also observed.
3.3.1. Operation Conditions for Copyrolysis Oil with the Optimum Carbon Number Ratio
| Level 1 | Level 2 | Level 3 | Level 4 | Max–Min | Rank | |
|---|---|---|---|---|---|---|
| (A) Temperature | 3.62 | 8.73 | 4.94 | 4.73 | 5.11 | 4 |
| (B) Residence time | 6.62 | 8.16 | 6.06 | 1.17 | 6.99 | 2 |
| (C) PP : SS | −1.08 | 5.87 | 10.89 | 6.33 | 11.97 | 1 |
| (D) N2 flow rate | 4.07 | 7.59 | 8.59 | 1.76 | 6.83 | 3 |
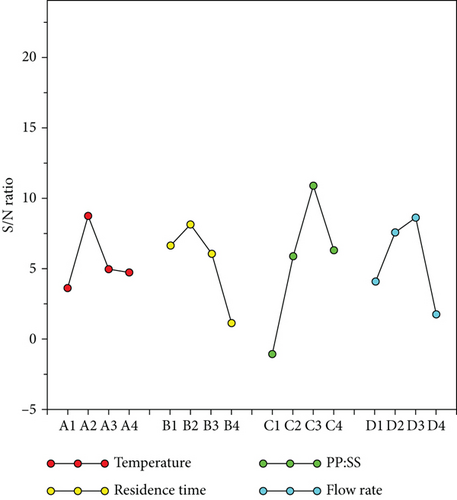
The optimal theoretically predicted S/N ratio was 19.87, and the theoretically predicted value of C5–12/C19+ was 10. Verification experiments were carried out, and the optimal parameter value of C5–12/C19+ was 9.1. The main aim here is C5–12/C19+ selectivity. Figure 9 shows that the pyrolysis oil produced under these conditions had a 9.1 times higher carbon number distribution in the C5–12 range than that in the C19+ range.
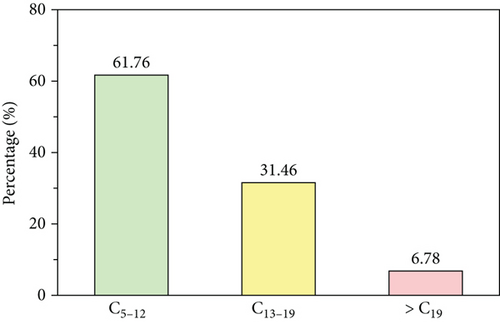
Table S2 shows the influence of the two catalysts on the product distribution. The oil yield produced in this optimal process increased upon the addition of either catalyst from 10.87% to 13.69% with HZSM-5 and to 14.13% with activated alumina. It is speculated that the addition of a catalyst reduces tar generation and leads to an increase in pyrolysis oil production. However, the addition of the catalyst slightly affected the aqueous phase or solid products. The heating value increased slightly in the presence of a catalyst, from 35.99 MJ/kg to 38.47 MJ/kg with HZSM-5 and to 37.78 MJ/kg with activated alumina. This is because deoxygenation and decarboxylation of organic volatile gases occur as they pass through the catalyst, resulting in a significantly reduced oxygen content in the product. Higher C and H contents resulted in higher heating values [49].
Table 6 compares the chemical compositions and carbon number distributions of the pyrolysis oils produced in the presence of the catalysts under optimal operating conditions. The amounts of polyaromatic and cyclic compounds totaled 34.79% in the absence of a catalyst, which decreased to 25.01% with HZSM-5 and to 28.42% with activated alumina, indicating that each catalyst exhibited an upgrading effect. In addition, the catalyst effectively inhibited the formation of polyaromatic compounds. The presence of PP led to the formation of more hydroxyl radicals; consequently, more alkanes and alkyl alcohols were generated, with alkanes dominating this chemical composition [50].
| Compound | Optimal carbon range experiment | HZSM-5 | Activated alumina |
|---|---|---|---|
| Alkanes | 61.14 | 74.6 | 67.1 |
| Alkenes | 4.07 | 0.48 | 4.48 |
| Cycloaliphatics | 31.99 | 25.01 | 28.42 |
| Monoaromatics | 0 | 0 | 0 |
| Polyaromatics | 2.8 | 0 | 0 |
| C5-12 | 61.76 | 47.3 | 27.9 |
| C13-19 | 31.46 | 50.86 | 62.3 |
| C19+ | 6.78 | 1.84 | 9.8 |
The carbon number distribution was concentrated in the middle carbon number (C13–19) range when oil was formed in the presence of a catalyst, from the original value of 31.46% to 50.86% with HZSM-5 and 62.3% with activated alumina. The C5–12/C19+ ratio was 9.1 in the absence of a catalyst, which increased to 25.7 in the presence of HZSM-5. Although a yield of lower carbon number range (C5–12) was observed, the high carbon number range (C19+) yield was significantly reduced in the presence of HZSM-5 and slightly increased in the presence of activated alumina, with a C5-12/C19+ ratio of 2.85. The addition of a catalyst in this experiment led to the formation of free radicals through random bond breakage that polymerized in the high carbon number product; however, most of the product was concentrated in the middle carbon number range (C13–19).
3.3.2. Operating Conditions for Copyrolysis for Optimum Oil Quality
The numerator corresponds to the main petrochemical product components (alkenes and monoaromatics) [26], whereas the denominator corresponds to undesired polyaromatics (which may be toxic) and cyclic compounds (responsible for oil instability). The Taguchi method is aimed at ensuring that this ratio is as large as possible; a larger ratio corresponds to a better copyrolysis oil quality.
| Level 1 | Level 2 | Level 3 | Level 4 | Max–Min | Rank | |
|---|---|---|---|---|---|---|
| (A) Temperature | −0.29 | 2.49 | −6.05 | −0.64 | 8.54 | 2 |
| (B) Residence time | −0.37 | −4.58 | 1.21 | −0.74 | 5.79 | 3 |
| (C) PP : SS | 3.63 | 4.22 | −2.08 | −10.25 | 14.47 | 1 |
| (D) N2 flow rate | −2.77 | −2.32 | 0.03 | 0.58 | 3.35 | 4 |
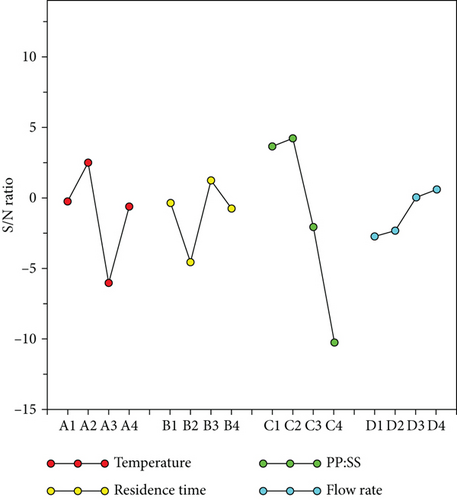
The theoretically predicted optimal S/N ratio and oil quality values are 11.86 and 3.92, respectively.
Figure 11 and Table S4 show the experimental chromatogram and GC/MS-based chemical composition under the optimal pyrolysis oil quality operating conditions. Figure 12 shows a comparison of the chemical compositions of the optimal copyrolysis oils. This experiment clearly resulted in a relatively high aliphatic yield (>80%) compared with those obtained at other mixing ratios, and similar results were reported for the copyrolysis of textile sludge with medical waste plastics [50]. The ratio of petrochemical products to worthless products was determined to be 4.02, because the alkene yield was high (61.58%), and significantly fewer polyaromatic and cyclic compounds were produced.
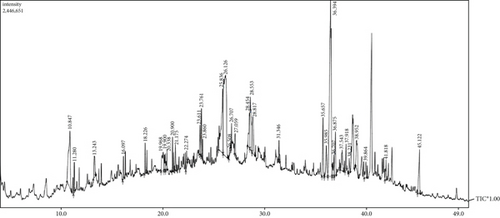
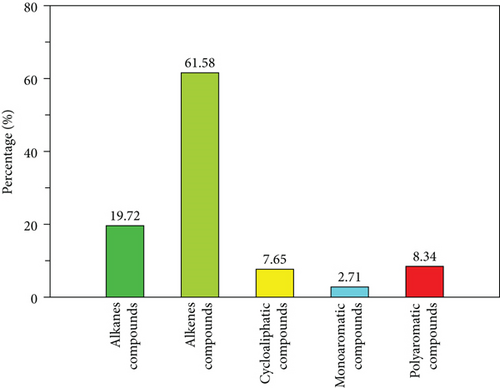
Table S5 shows the influence of the two catalysts on product distribution under optimal conditions. The copyrolysis oil yield was slightly improved, along with slightly higher aqueous phase products and almost no change in the solid product yield. Both catalysts improved the heating value from 31.3 MJ/kg (without catalyst) to 34.08 MJ/kg with HZSM-5 and 33.37 MJ/kg with activated alumina.
Tables S6 and S7 show the GC/MS-based chemical compositions upon addition of HZSM-5 and activated alumina in this optimal process. Table 8 lists the chemical compositions and carbon number ranges obtained in the presence of HZSM-5 and activated alumina under optimal operating conditions. A high proportion of aromatic compounds (monoaromatics + polyaromatics) (11.05%) was obtained in the absence of a catalyst, of which polyaromatic compounds accounted for 8.34% and were all formed from nitrogen-containing compounds (indole) in the SS. However, HZSM-5 was found to inhibit the formation of polyaromatic compounds through Diels–Alder reactions, while further enhancing the formation of alkenes and monoaromatic compounds [51]. In contrast, activated alumina increased the overall contents of aromatic (from 11.05% to 16.24%) and cyclic compounds (from 7.65% to 17.43%). The ratio of petrochemical products (alkenes + monoaromatics) to worthless products (polyaromatics + cycloaliphatic compounds) was 4.02 in the absence of a catalyst, which increased to 4.33 in the presence of HZSM-5, but decreased to 1.49 in the presence of activated alumina, indicating better performance of HZSM-5 at increasing the selectivity for petrochemical product components.
| Compound | Optimal oil quality experiment | HZSM-5 | Activated alumina |
|---|---|---|---|
| Alkanes | 19.72 | 19.58 | 27.55 |
| Alkenes | 61.58 | 62.27 | 38.78 |
| Cycloaliphatics | 7.65 | 15.09 | 17.43 |
| Monoaromatics | 2.71 | 3.06 | 4.8 |
| Polyaromatics | 8.34 | 0 | 11.44 |
| C5–12 | 10.44 | 7.99 | 14.26 |
| C13–19 | 42.37 | 46.22 | 35.99 |
| C19+ | 47.19 | 45.79 | 49.75 |
4. Conclusions
- (1)
PP contained almost 100% volatile matter and no ash. It also had a three times higher heating value than SS on a dry basis. These properties make PP a suitable auxiliary feedstock for the copyrolysis of SS. In addition, pyrolysis oils of PP and SS are slightly acidic and alkaline, respectively, while pH of the copyrolysis oil is close to neutral
- (2)
The TGA results indicated that the synergy was roughly divided into three stages. The activation energy value for the blended fuel also exhibited positive synergy. The FTIR results showed that CH4 and C-H bonds increased with increasing PP content in the blended fuel. The maximum aromatic production was observed for 10%PP + 90%SS
- (3)
Using the Taguchi method, the optimal C5–12/C19+ ratio of 9.1 was obtained, which increased to 25.7 when 10% HZSM-5 was used and decreased to 2.85 in the presence of 10% activated alumina. Both catalysts promote products with a middle carbon number (C13–19). In addition, the optimal petrochemical product (alkenes and monoaromatics) to a worthless product (polyaromatics and cyclic compounds) component ratio was 4.02, which increased to 4.33 in the presence of 10% HZSM-5
Conflicts of Interest
The authors declare that they have no conflicts of interest.
Acknowledgments
This research was partially supported by the National Science and Technology Council of Republic of China under the grant number NSTC 111-2622-E-006-027.
Open Research
Data Availability
The data used to support the findings of this study are available from the corresponding author upon request.


