A Double Clustering Approach for Color Image Segmentation
Abstract
One of the significant stages in computer vision is image segmentation which is fundamental for different applications, for example, robot control and military target recognition, as well as image analysis of remote sensing applications. Studies have dealt with the process of improving the classification of all types of data, whether text or audio or images, one of the latest studies in which researchers have worked to build a simple, effective, and high-accuracy model capable of classifying emotions from speech data, while several studies dealt with improving textual grouping. In this study, we seek to improve the classification of image division using a novel approach depending on two methods used to segment the images. The first method used the minimum distance, and the second method used the clustering algorithm called DBSCAN. Both methods were tested with and without reclustering using the self-organizing map (SOM). The result from comparing the images after segmenting them and comparing the time taken to implement the segmentation process shows the effectiveness of these methods when used with SOM.
1. Introduction
- (1)
Image is segmented into two sections utilizing two cluster centers
- (2)
Calculation of a recommended quality factor to test segmentation quality for that range of clusters
- (3)
Increment number of clusters by one, compute another quality factor, and contrast it with the past segmentation quality factor. Emphasize this until the quality factor degrades and think about the past category as the correct one
- (4)
When the right cluster centers are fixed, a new image is created by substituting image pixels with the cluster center value that is closest to the pixel value and then exhibiting and storing the new image
And previous studies dealt with this issue, for example, in [4]. The researchers on this paper provide a comparison among DBSCAN and mean shift. Considering images as a dataset of pixels the researchers, first of all, dispose of salt and pepper noise from images through the use the median filtering approach observed by making use of the DBSCAN set of rules to cluster it. Next, the implementation of the mean shift set of rules is visibly observed through the comparison of each the outputs. Density-based clustering algorithms are used to discover spatial connectivity and color similarity of the pixels that is used to find out clusters of arbitrary form main to the partitioning of pixels and similarly keeping apart the noise points. Experimental consequences, the use of proposed approach, show encouraging performance.
In [5], it was proposed picture segmentation approach with “50 frames” with the aid of using the density-based spatial clustering of packages with noise (“DBSCAN”). To lower the computational operations, the experimental consequences reveal that real-time superpixel algorithm (50 frames/s) with the aid of using the DBSCAN clustering outperforms the present superpixel segmentation strategies in efficiency and accuracy. The authors in [6] present DSets-DBSCAN as a parameter-free clustering set of rules based on the mixture of the dominant unit set of algorithm and DBSCAN. This DSets-DBSCAN set of rules is proven to be powerful in each statistics clustering and image segmentation experiments. In experiments turned into proven, the DSets-DBSCAN algorithm may be used as a powerful image segmentation approach. Additionally, the word, during natural image segmentation, does not yield a unique, accurate result. In [7], the researchers present the investigations that conveyed image processing technologies in paddy area and propose the design of the framework for recognizing the beginning phase of the leaf illnesses and finding the weed species. The proposed framework reduces the danger of sicknesses from turning out to be more terrible which may limit the paddy yields.
2. The Self-Organizing Map (SOM)
The network of the self-organizing map also called the “Kohonen” network cluster units [8] is arranged in a single- or two-dimensional matrix that have input signals consisting of several units. In other words, the geometric structure between units is taken into account. Each entry will be entirely linked to cluster units, which respond otherwise to the input pattern. The Kohonen map is the size of map that produces the quantity of rivalry neuron. The quantity of rivalry neurons affects the clustering result.
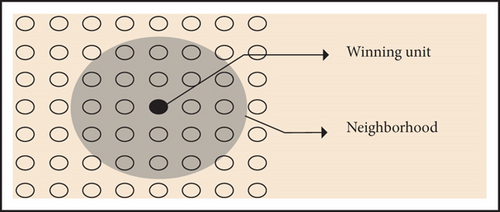
The adopted function is linear, with the highest values in the winning unit [10] and the lowest at the boundary of the circular region, note the shape.
3. Methodology
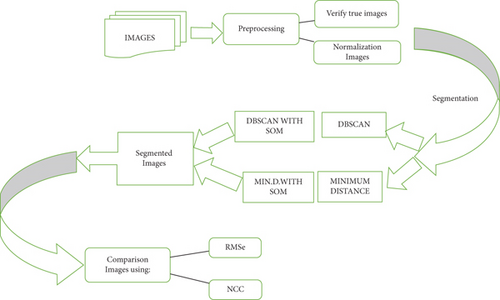
Segmentation methods are described in this section. In the preprocessing stage, the true color image is verified as well as performing the normalization of the color of the images. After that, the image is segmented using DBSCAN algorithms and minimum distance. Figure 2 shows the proposed method in this study.
3.1. Preprocessing Stage
Segmentation is one of the most important stages in computer vision systems. It is important in a lot of computer vision and image processing applications. The image segmentation is aimed at creating representative areas (objects) or important parts of objects in the image. By categorizing image points (Pixels) with similar color values in areas that represent these items. Segmentation image into areas identical to the important objects in the image is longer; it is necessary before any processing falls at a level higher than the point level (pixel) [4].
Before going into talking about segmentation methods, we must address some of the problems in the image segmentation process. The main problem is the noise generated in the image when converting the image from analog to digital image, noise caused by the camera, lens, lighting, or otherwise. Its effect can be minimized by using a preprocessor configuration method. The lighting effect is removed in this study by first normalizing the picture colors to acquire the image’s natural colors without the lighting effect and then using a neural network to remove noise and emphasize the image’s key colors. The clustering method, a method of segmenting the image into groups, was used in this research where the cluster method can handle distorted and indistinguishable image boundaries of things inside the image. The elements of these groups have a degree of similarity and a degree of contrast with other groups [11].
The concept of unsupervised learning and clustering looks for information drawn from random samples, and the general method of clustering defines some similarity measures between two clusters in addition to the general scale such as the sum of the square of errors or the amount of scatter matrix. It should be noted here that when we process data, we deal with random samples of these data; these samples can form clusters of points (pixels) in multidimensional space if we know that these samples came from a single normal distribution; the most important two samples are the mean and covariance matrix, and the sample rate determines the center of gravity in a given group of points, and the center of gravity is a phrase [12]. For a single point, it is the best representation of data within a concept (the least sum of square spaces from the center of gravity to other samples) while the contrast matrix sample describes the amount of dispersion on various directions. The algorithm used for clustering in this research is DBSCAN.
- (1)
For the linear function (α) at the winning unit (0.3) and perimeter of the circular neighborhood region (0.05), these values also came as a result of the experiment to get the best outcomes. As for the reduction factor for the radius of the neighborhood area (0.001%) and the linear acquired function, set it as 0.001%, and these values also came as a result of the experiment to get the best performance and a balance between the accuracy of the results and the speed of implementation, while giving priority to the accuracy of the results
- (2)
If the radius value is more than or equal to 10, we perform steps 3-7
- (3)
Calculate the distance between weights and input samples by adopting equation (3)
- (4)
Find the winning unit and determine its location by adopting equation (1)
- (5)
Update the weights within the neighborhood by adopting equation (2)
- (6)
Finally, reduce the value of the linear function gained by the reduction factor (0.001)
- (7)
Reduce the radius of the neighborhood by the reduction factor specified in step (1)
- (1)
Define the architecture of a neural network
- (2)
Configure learning parameters
- (3)
Initialize the weight matrix and then perform the adjustment for this matrix
- (4)
Image formatting and adjustment
- (5)
Convert images into grid input vectors
3.2. Clustering Algorithms
After completing the training of the neural network, the final weights are the outputs from the neural network. It enters the clustering process that begins with two cluster centers. The determination of cluster centers before starting the cluster is by adopting the following steps: we take the smallest color value and consider it the value of the first position [14]. We take the largest color value and consider it the value of the last position. The rest of the centers take the values between the smallest and the largest with regular repetition. Using one of the two methods that will be mentioned later, the cluster is built on the centers of cluster specified in the previous step.
3.2.1. Minimum Distance
The minimum distance method receives predefined cluster centers. For each point of the image (pixel) matrix weights, repeat steps 3-4 explained in Section 3.1 [15]. Find the difference between the current point value (pixel) and the cluster centers. The point (pixel) is attached to the smallest cluster centers (the minimum distance). Recalculate the rate for the clusters (to determine the color of the clusters).
3.2.2. DBSCAN Algorithm
- (1)
“K”: the neighbor list size
- (2)
“Eps”: the radius that delimits the neighborhood vicinity of a point (Eps-neighborhood)
- (3)
“MinPts”: the minimum number of points that must be present in the Eps-neighborhood
- (1)
Receive the predetermined cluster centers
- (2)
As long as the current cluster centers are not equal to the previous ones, the steps are repeated from 3 to 6
- (3)
For each image point (weight matrix), repeat steps 4 and 5
- (4)
Find the difference between the current value and the cluster center
- (5)
The point is added to the smallest cluster center (the closest distance)
- (6)
Recalculate the average for the clusters
4. Results and Discussion
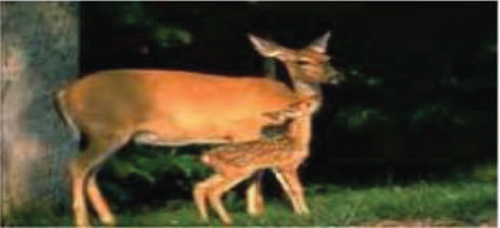
In this research, the results are compared when using the minimum distance algorithm, with and without SOM. Likewise, in the case of using the DBSCAN algorithm, the comparison is done on with and without SOM. It can be observed from Figures 3(a)–3(c) that the original image has five colors, but after applying the minimum distance with the self-organizing network (SOM), we see that it has been classified into three colors and is closer to the original image, whereas when using the minimum distance without the self-organizing network (SOM), it has been classified into two colors. Only two colors are black and yellow, implying that the color yellow has been split from the black color due to a significant difference, and the yellow color is regarded an independent item, resulting in a tangled and hazy appearance.
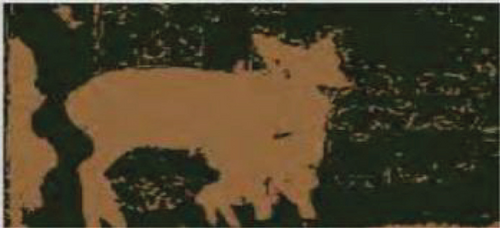
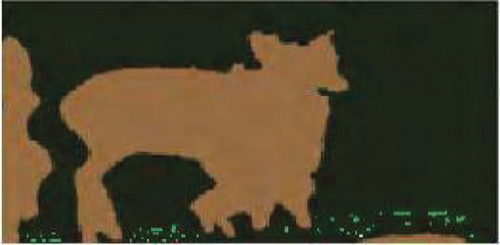
As for Figures 4(a)–4(c), when the clustering algorithm is implemented in using the self-organizing network (SOM), it can be seen that it was classified into its original colors very close to the original image. This rating is better than the previous ones. From this comparison, it is clear that the use of the two algorithms, which is the minimum distance and DBSCAN, gives better results in the presence of the self-organizing network (SOM).
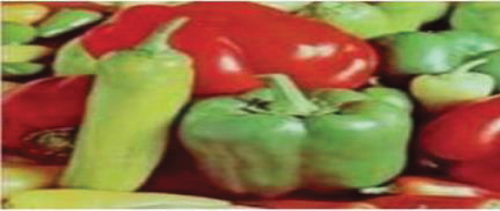
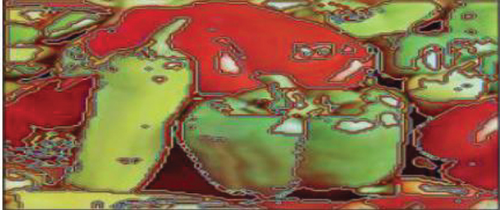
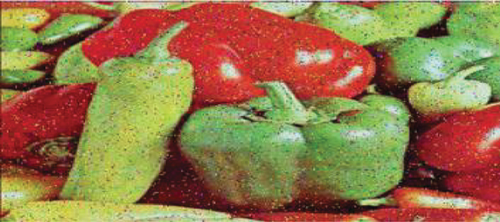
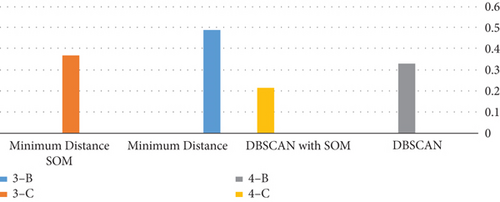
If we discuss the use of this algorithm in terms of the time required to implement each algorithm, it becomes evident that the use of the SOM with both algorithms that were used in this study is that the time is less and this increases the efficiency of the proposed algorithm [21] as shown in Table 1, where it shows the run time in seconds using minimum distance alone and with SOM and DBSCAN with and without SOM.
| Images | DBSCAN | DBSCAN with SOM | Minimum distance | Minimum distance with SOM |
|---|---|---|---|---|
| 3-B | — | — | 0.489 | — |
| 3-C | — | — | — | 0.370 |
| 4-B | 0.332 | — | — | — |
| 4-C | — | 0.215 | — | — |
According to the run time presented in Table 1, utilizing the two algorithms (DBSCAN and minimum distance) with SOM reduces the time spent for each operation, and DBSCAN is better than minimum distance [22–25], as shown in Figure 5.
| Methods | 3-B | 3-C | 4-B | 4-C |
|---|---|---|---|---|
| DBSCAN | — | — | 0.796 | — |
| DBSCAN with SOM | — | — | — | 0.902 |
| Minimum distance | 0.749 | — | — | — |
| M.D with SOM | — | 0.825 | — | — |
It is noted from the results of Table 3 that the NCC score corresponds to the MSE score. This means that the proposed algorithms give results closer to the original image.
| Methods | 3-B | 3-C | 4-B | 4-C |
|---|---|---|---|---|
| DBSCAN | — | — | 45.712 | — |
| DBSCAN with SOM | — | — | — | 40.462 |
| Minimum distance | 22.612 | — | — | — |
| M.D with SOM | — | 21.805 | — | — |
5. Conclusion
In this research, a specific number of images were segmented using two methods, the first method is the minimum distance, and the second method is the clustering of images using the DBSCAN. After that, the images were segmented with the two methods but using the self-organizing network (SOM) for each method. The results showed by comparing the images before they were segmented and after they were segmented using the mentioned methods that using the self-organizing network with the algorithms gives better results in terms of accuracy and time, where the time used in the process of segmentation images using the self-organizing network (SOM) is less in the case of segmentation without using the SOM.
Conflicts of Interest
The authors declare that they have no conflicts of interest.
Acknowledgments
This study was self-financed.
Open Research
Data Availability
The data is available at https://www.kaggle.com/datasets/.


