Experimental Design Analysis of Murexide Dye Removal by Carbon Produced from Waste Biomass Material
Abstract
The aim of this work is to investigate the adsorption of an anionic dye, the Murexide (MX) present in aqueous solution, on activated carbon, derived from prickly pear seed cake biomass after bio-oil extraction. The obtained adsorbent used was characterized by Bohem titration, pH of point of zero charge (pHPZC), FTIR spectroscopy, Brunauer–Emmett–Teller surface area (SBET), and scanning electron microscopy (SEM). The different experimental parameters of the adsorption process, such as temperature, contact time, initial dye concentration, and adsorbent dose, were studied. For the optimization of the process, the effects of these parameters were investigated using the full factorial experimental design methodology. Design Expert 11.1.2.0 Trial software was used for generating the statistical experimental design and analysing the observed data. Langmuir and Freundlich’s adsorption models were employed to provide a description of the equilibrium isotherm. The adsorption process was found to obey Langmuir, which indicates that the Murexide had formed a monolayer onto activated carbon. Furthermore, according to the regression coefficients, it was observed that the kinetic adsorption data can fit better by the pseudo-second-order model compared to the first-order Lagergren’s model. The thermodynamic studies indicated that the adsorption of Murexide occurs in a spontaneous and exothermic process. The regeneration process of the exhausted adsorbent was studied to assess the economic and operational feasibility. According to the obtained findings, it is proposed that the activated carbon prepared from prickly pear seed cake retains a high potential for Murexide removal and is suitable for repetitive usage.
1. Introduction
In recent years, synthetic dyes have been excessively used around the world and have become very common contributors to wastewater effluents from a variety of sectors [1], including discharges from various industries, such as the textile industry [2].
The majority of these dyes represent serious environmental problems through carcinogenic substance accumulation and discharge of toxic elements [3]. In addition, trace amounts of dyes in water may be able to induce allergic dermatitis and cutaneous irritation [4, 5]. There are three types of dyes: anionic, cationic, and nonionic. Anionic dyes are classified as direct, acid, and reactive dyes, whereas cationic dyes can be considered basic dyes [6]. Recently, significant interest has centred on the elimination of dyes from wastewater due to their resistance to biodegradation and their hazardous nature [4]. The high toxicity and solubility of these pollutants require the use of various processes for their removal, such as electrochemical treatment [7], chemical oxidation [8], photocatalysis [9], and adsorption [10]. Adsorption is considered an excellent promising technology simultaneously appropriate and economical for wastewater treatment [11]. Often high adsorption capacity is needed for the best performance for the removal of contaminants [12]. Activated carbon is extensively used as an adsorbent applied for the removal of pollutants due to its large specific surface area and high adsorption capacity.
On the other side, commercially activated carbons are perceived as costly materials because of the use of nonrenewable and relatively costly raw materials, which are inappropriate for use in pollution prevention applications [13]. Therefore, there is a need for alternative low-cost materials that do not necessitate additional costly treatment, allowing the adsorption process to be economical and feasible. An efficient adsorption process requires not only the adsorption capacity of the adsorbents but also a consistent availability of the adsorbent precursor for the process. Therefore, it is recommended to use low-cost precursors (industrial waste, mineral, or agricultural waste).
Among these precursors, different agricultural biomasses have been used for the production of activated carbon, such as coconut shells [14], orange peels [15], Posidonia oceanica [16], date palm petiole [12], maize tassel [17], and coffee waste [18]. Motivated by the search for a new precursor, prickly pear seed cake has been considered in this study. Prickly pear, the fruit of cactus which grows in abundance in the Mediterranean region, is a popular fruit in north Africa, and it is being extensively used as a food and for cosmetic oils production [19]. Prickly pear seed cake was produced in large quantities as a by-product of the prickly pear seed oil extraction industry. This by-product cake has low economic value and has not been valorised yet, and concerns are growing about its dumping as waste. Consequently, preparing activated carbons with this raw material is an interesting approach in order to valorise this raw material and appropriately manage it. For this purpose, there are currently two activation techniques applied: chemical and physical activation [20, 21]. In the present study, a chemical activation method for the production of activated carbon was investigated. Also, the obtained activated carbon was used as an adsorbent for Murexide removal from aqueous solutions. Murexide (C8H8N6O6) is an anionic dye that has been widely applied in several applications [22, 23]. Also, this dye is named ammonium purpurate, and it is the ammonium salt of purpuric acid [24]. It is available by heating alloxantine in ammonia gas at 100°C and also by boiling uramil using Mercury oxide. In the dry state, Murexide has the aspect of a red-violet powder that is soluble slightly in water [25]. It is applied as an indicator for complexometric titrations. Due to various uses of Murexide, when used, a huge quantity of Murexide flows into rivers and oceans. As a result, removing the dyes is an essential issue in wastewater treatment [23,26].
Adsorption was performed according to different parameters: pH solution, adsorbent dosage, temperature, contact time, and initial concentration. Adsorption kinetics data were tested by pseudo-first-order and pseudo-second-order kinetic models. The equilibrium data were analysed using Langmuir and Freundlich models. The surface properties of activated carbon were characterized by scanning electron microscopy, FTIR spectroscopy, Brunauer–Emmett–Teller surface area (SBET), Boehm titration, and pHPZC.
2. Experimental Part
2.1. Reagents and Raw Materials
Sodium carbonate (Na2CO3, ≥99%) was supplied by Fluka. Sodium hydroxide (BioXtra, ≥98%) and hydrochloric acid (HCl, ACS reagent, 37%) were provided by Sigma-Aldrich. Phosphoric acid (H3PO4, ≥98%), sodium bicarbonate (NaHCO3, ≥99%), and Murexide dye (NH4C8H4N5O6) (Table 1) were supplied by Scharlau.
| Formula | C8H8N6O6 |
|---|---|
| Molar Mass | 284.19 g/mol |
| λmax | 523 nm |
| Solubility in water (25°C) | 1 g·l−1 |
| Structure | 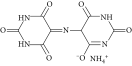 |
Prickly pear seed cake was considered as a raw material for the development of activated carbon based on its availability and physicochemical properties. The prickly pear seed cake employed in this study was furnished by Omega Tunisia Ltd., a company operating in Sidi Bouzid, Tunisia. Prickly pear cake is a by-product of the extraction of oil from prickly pear seeds.
2.2. Preparation and Characterization of Activated Carbon
Prickly pear seed cake was crushed into small size pieces (≤2 mm). The prepared powder was carbonized at 600 for 2 h under N2 flow rate (100 cm3/min). The activation of prepared carbon was insured by impregnation in H3PO4 with a ratio of 1 : 1 (g H3PO4/g carbon). Subsequently, the impregnated carbon was thermally activated at 500°C during 1 h. The resulting activated carbon was dried at 105°C and stored in a desiccator. To quantify acidic and basic functional groups on the obtained activated carbons, Bohem titration was applied [12]. The pH of point zero charge (pHPZC) of the prepared adsorbent was determined using Newcomb’s method [27]. To achieve this purpose, 50 mL of 0.01 mol/L NaCl solution was poured into six beakers, and for each beaker, the pH was adjusted to 2, 4, 6, 8, 10, or 12 by adding HCl and NaOH (0.1 mol/L), where necessary. An amount of activated carbon (about 0.2 g) was added to each beaker. After that, all the beakers were stirred for 24 h at room temperature (25 ± 1°C), and the final pH (pHf) of the solution was measured and plotted against pHi (pHf = pHi). The pHPZC value was deduced from the intersection of the plot of pHf = f (pHi) with that of the bisector.
The FTIR spectroscopy was recorded over a range from 400 to 4000 cm−1 using KBr pellets (10% solid) in a Shimadzu 8400−S spectrometer with the aim of collecting information about functional groups of the newly prepared activated carbon.
The Brunauer–Emmett–Teller surface area (SBET) and pore structure parameters [28] of the adsorbent were acquired from nitrogen adsorption-desorption measurements at 77 K using a Micromeritics ASAP 2020 instrument. Before the measurement, activated carbon (40 mg) was degassed at 300°C for 8 h. The SEM photos were obtained with a JEOL JSM-IT 100 type device.
2.3. Bath Adsorption Experiments
2.3.1. Effect of pH and Adsorbent Dose
In the adsorption process, pH has a significant role [30]. Many investigations have established that pH is a critical parameter that affects the adsorption capacity of organic compounds [31]. Generally, acidic substances are adsorbed more efficiently at lower pH values, while basic substances are more strongly adsorbed at high pH values [5]. To assess the effect of the initial pH of the solution, the pH of the solution was adjusted over the range 2–10.
The adsorbent dose is among the parameters that affect the adsorption capacity directly since it influences the adsorption capacity and enables us to predict the cost of activated carbon per unit of a solution to be treated [32]. In practical terms, 10 mL solution of a given concentration of MX was put in contact with doses of adsorbent ranging from 0.2 to 2 g/L for a predetermined time (180 minutes). Once filtered, the solution was analysed to determine its concentration, which was used to measure the adsorption rate of MX.
2.3.2. Effect of Time and Kinetic Study
In order to establish the contact time required to reach the equilibrium adsorption of a pollutant on activated carbon, it is necessary to follow the adsorption kinetics of MX in an aqueous solution on activated carbon. The contact time was varied between 0 and 720 min.
Adsorption equilibrium was established for different dyes concentration between 20 and 200 mg/L. The conventional kinetic models, including pseudo-first-order [33] and pseudo-second-order [34], were applied to explain the adsorption mechanism.
2.3.3. Adsorption Equilibrium Study
Adsorption isotherm models are used to describe the behavior of the adsorbent/adsorbate system and to provide comprehensive explanations on the nature of the interaction between them. In the present study, two theoretical models have been adopted to explain the current phenomenon (Langmuir and Freundlich).
The materials and methods section should contain sufficient detail so that all procedures can be repeated. It may be divided into headed subsections if several methods are described.
2.3.4. Effect of Temperature and Thermodynamic Parameters
In order to investigate the influence of temperature variation on the adsorption of MX, an amount of adsorbent was mixed with the anionic dye solution until it reached equilibrium, under temperatures of 15, 30, and 40°C, and then filtered and analysed.
All adsorption experiments were performed at least twice with the same operating conditions to guarantee the reproducibility of the findings.
2.3.5. Desorption Experiment and Regeneration of Adsorbents
The regeneration of the exhausted adsorbent was studied to assess the reusability of the adsorbent and thus increase its potential as an economically attractive adsorbent [37]. The chemical regeneration method has the widest application in the separation of the absorbed molecules from the sites of the adsorbent, as it is comparatively rapid and occurs without affecting the pore structure of the activated carbon [38]. A 0.1 M NaOH solution was used in order to regenerate the exhausted adsorbent.
0.1 g of saturated activated carbon with ion dye was treated with 50 mL of 0. 1 mol·L−1 NaOH solution for 12 h. After separation by centrifugation, the treated adsorbent was subsequently washed several times with distilled water and then reused to adsorb 200 mg·L−1 of Murexide in 50 mL of solution. The adsorption/desorption procedure is repeated five times using the same procedure, and the concentrations of MX in the supernatant after centrifugation are measured.
2.4. Full Factorial Design of Experiments
Full factorial experimental design considers all factors simultaneously and has been used largely as an alternative to the conventional experimental design, which treats each parameter separately and changes it one by one. The optimal experimental conditions are established by varying the factors at the same time and by applying several levels of the variables. Factorial designs are commonly used in experiments that consider multiple factors and for which it is necessary to investigate the effect of interaction between factors on the response [2]. However, the factorial design of experiments 2n requires a reduced number of experiments for multiple factors; as a result, both materials and time used are reduced [39, 40]. The factorial design illustrates the impact and influence of each factor on the other factors at two levels [41]. Factors including pH, adsorbent dosage, and initial concentration of dye were considered in this study (Table 2). These variables with their respective domains were chosen from the literature as well as preliminary experiments.
| Factors | Low levels (−) | High levels (+) |
|---|---|---|
| pH | 2 | 12 |
| m (g/L) | 0.2 | 2 |
| C0 (mg/L) | 20 | 200 |
| T (°C) | 15 | 40 |
Response surface methodology was applied to optimize the combination effect on the adsorption efficiency (Ads%) [32, 42].
3. Results and Discussion
3.1. Activated Carbon Characterization
Surface functional groups have a considerable influence on the process of adsorption. Such functional groups are classified principally into acidic and basic groups [43], affecting both the surface charge of the adsorbent and consequently the adsorption performance [44].
According to the obtained results shown in Table 3, Bohem’s titration confirms the presence of acidic groups due to the existence of carboxylic, lactonic, and phenolic groups, as well as the presence of a high number of basic groups. The pHPZC of the adsorbent was 6.8, indicating a relatively acidic nature. This is in accordance with the Bohem titration result, which indicates a predominance of acidic groups on the surface of the adsorbent.
| Carboxylic groups (mmol/g) | 10.77 |
| Lactonic groups (mmol/g) | 1.19 |
| Phenolic groups (mmol/g) | 1.74 |
| Total basic groups (mmol/g) | 10.66 |
| pHPZC | 6.8 |
These findings were validated by the FTIR spectrum (Figure 1). The absorption bands in the range of 3415 cm−1 represent the stretching vibration of the intermolecular and intramolecular O-H band. The absorption band at 1600 cm−1 was attributed to carboxyl groups.

Additionally, the peak of the stretching vibrations of the C-O group is detected at 1030 cm−1.
Nitrogen (N2) gas adsorption-desorption isotherm of activated carbon was performed to investigate the porous characteristics. The obtained activated carbon has a large specific surface area SBET equal to 551.14 m2/g, an average pore diameter in the range of 4.71 (nm), and a total pore volume of 0.159 cm³/g. According to the International Union of Pure and Applied Chemistry (IUPAC) isotherm classification standard [45], the obtained activated carbon has a mesoporous structure. This mesoporosity provides a favorable structural characteristic of the adsorbent used in this study to eliminate large molecules such as Murexide.
Scanning electron micrograph of the activated carbon is given in Figure 2. It can be seen clearly that the surface of the adsorbent was covered with cavities and pores of different sizes and shapes. The pores walls are filled with many subpores that connect the pores to the inside of the activated carbon prepared. Overall, the development of pores in the obtained activated carbon is a consequence of the decomposition of the sample induced by the activation process with H3PO4 as confirmed by Han et al. [46]. From these observations, it can be considered that the texture of the obtained adsorbent is suitable for the removal of dyes from aqueous solutions.

3.2. Batch Adsorption Results
3.2.1. Effect of pH
The adsorption of Murexide dye was established at different pH (2, 4, 6, 8, and 10). The variation of the adsorbed amount of Murexide dye as a function of pH is represented in Figure 3(a). The activated carbon adsorbed high quantities of Murexide at low (acidic) pH 2, and its adsorption was gradually decreased with increasing pH.


The large reduction in dye adsorption at highly basic conditions can be attributed to electrostatic repulsion between the negatively charged activated carbon and the deprotonated dye. These results are in coincidence with these observed by Mall et al. [50].
3.2.2. Effect of Adsorbent Dose
The influence of the adsorbent dose on the adsorption of MX dye (200 mg/L) was investigated by ranging the adsorbent mass from 0.2 g to 2 g for 1000 mL of volume samples. Figure 3(b) reveals that the adsorption capacity increases with an increased dose of activated carbon. It can be seen that the MX removal efficiency increases from 126.3 to 197.7 mg/g, while the adsorbent dose increases from 0.2 to 2 g/L, the greatest amount adsorbed is 1g/L for MX. This increase in adsorption with the increase in adsorbent dose was due to the availability of more adsorption sites [51]. This result is consistent with the findings reported [52].
3.2.3. Adsorption Kinetic Studies
Figure 3(c) shows that the amount of adsorbed Murexide increases progressively with time (probably this is explained by the high ratio of vacant surface sites to adsorbate molecules). The equilibrium of the system was achieved in about 180 minutes, which is appropriate for the equilibrium state between the adsorbate and the adsorbent. The investigation of the adsorption of the dye on the activated carbon as a function of time allows us to examine the influence of the contact time on its retention and to describe the mechanism that occurs. For this purpose, two models have been employed to outline the kinetic mechanism of adsorption of Murexide on the adsorbent of interest: the pseudo-first-order (equation (2)) and the pseudo-second-order (equation (3)).
The results exposed in Table 4 show that the regression coefficients for the pseudo-second-order model were very close to unity, indicating that the adsorption of MX follows the pseudo-second-order model kinetics. For this purpose, the predicted adsorbed quantities obtained with this model are consistent with the experimental values.
| Pseudo-first-order | Pseudo-second-order | ||||||
|---|---|---|---|---|---|---|---|
| C0 (mg/L) | Qexp (mg/g) | Q1 (mg/g) | K1 (min−1) | R2 | Q2 (mg/g) | K2 (g/mg min) | R2 |
| 50 | 50 | 37.45 | −0.0064 | 0.773 | 49.2 | 0.00030 | 0.989 |
| 100 | 100 | 64.47 | −0.0059 | 0.954 | 98.1 | 0.00018 | 0.969 |
| 150 | 114.4 | 106.9 | −0.0061 | 0.893 | 114.0 | 0.00045 | 0.999 |
| 200 | 170.7 | 149.8 | 0.004 | 0.877 | 169.9 | 0.0015 | 0.999 |
3.2.4. Isotherms Study
The experimental results were investigated using the Langmuir and Freundlich models. The calculated constants with the linear forms (equations (4), (5), and (6)) are reported in Table 5.
| Temperature (°C) | 15 | 30 | 40 | |
|---|---|---|---|---|
| Langmuir | Qm (mg/g) | 196.0 | 192.3 | 188.6 |
| KL (L/g) | 2.428 | 1.677 | 1.261 | |
| RL | 0.0020 | 0.0029 | 0.0039 | |
| R2 | 0.9755 | 0.987 | 0.984 | |
| Freundlich | 1/n | 0.577 | 0.479 | 0.412 |
| Kf (L/g) | 9.1705 | 7.658 | 6.654 | |
| R2 | 0.920 | 0.865 | 0.915 | |
Based on the results of Table 5, the Langmuir isotherm model seemed to be much more adjusted than the Freundlich one. The fitness of the Langmuir model to the adsorption process points that MX was adsorbed on a specific monolayer onto activated carbon [53]. The RL value was found to be in the range from 0 to 1, suggesting the favorable adsorption of MX onto activated carbon [54]. However, n from the Freundlich model was greater than unity, which denotes the favorable sorption of MX onto the activated carbon [55].
Furthermore, the maximal capacities of absorption calculated with the Langmuir isotherm model were 196 mg/g. The highest capacity of AC for MX is relatively high with respect to the knowledge in the literature, as reported in Table 6.
| Precursor | Qmax (mg/g) | Reference |
|---|---|---|
| SnO2-NP-AC | 67.1 | [23] |
| Calcined eggshell | 1.0 | [56] |
| Treated pomegranate bark | 1.7 | [24] |
| Untreated pomegranate bark | 0.7 | [24] |
| Rice husk | 15.0 | [25] |
| AC from prickly pear seed cake | 196.0 | This study |
- The findings confirm that AC prepared from prickly pear seed cake can be favored as an efficient adsorbent for MX elimination.
3.2.5. Adsorption Thermodynamics
The effect of temperature was studied. The adsorption was carried under different temperatures: 15, 30, and 40°C. The results were graphically presented in Figure 3(d). These findings reveal that the minimum equilibrium concentration of the MX dye corresponds to 15°C. Therefore, it can be deduced that heat excitation of the adsorption reaction decreased the adsorption capacities for MX. It is worth mentioning that similar observations were reported by other researchers where the maximum removal of Murexide dye on activated carbon was achieved at a lower temperature [25]. ΔH0 and ΔS0 are calculated from the linear plot ln KL = f (1/T) (Figure 4).

The obtained results illustrated in Table 7 indicate that the adsorption process on activated carbon occurs in a spontaneous and favorable process (ΔG0 < 0) [57]. For the adsorption of MX, ΔH0 values are negative, proving that it is an exothermic process [58]. The positive value of entropy indicates that, during the reaction of MX on AC, the irregularity of MX molecules and adsorbent in the solution increases [59].
| Temperature (K) | ΔG0 (kJ/mol) | ΔH0 (kJ/mol) | ΔS0 (J/molK) |
|---|---|---|---|
| 288 | −32.191 | −19.471 | 44.242 |
| 303 | −32.936 | ||
| 313 | −33.281 |
3.3. Full Factorial Design of Experiments
The removal of dyes using an adsorbent in a batch test generally relies on multiple factors. Thereafter, the simple and common method to study the effect of each factor and look for optimums is to use the one factor at a time (OFAT) approach, also called the univariate method. In OFAT, one single factor is changed at a time, and the rest are fixed. The OFAT method requires more tests and cannot allow interactions estimation between all factors [60]. However, the full factorial method, where more than one variable is changed at a time, is more precise and can detect interactions between variables with less experiment. Using full factorial experiments design in this study, optimum adsorption conditions were obtained as follows pH = 2, m = 2, C0 = 20 mg/L, and T = 15°C (Table 8). The highest adsorption percentage of Murexide dye was 100%.
| Std. | Coded values | Actual values | Response | ||||||
|---|---|---|---|---|---|---|---|---|---|
| pH | m | C0 | T | pH | m | C0 | T | Ads% | |
| 1 | −1 | −1 | −1 | −1 | 2 | 0.2 | 20 | 15 | 97.4 |
| 2 | 1 | −1 | −1 | −1 | 12 | 0.2 | 20 | 15 | 49.6 |
| 3 | −1 | 1 | −1 | −1 | 2 | 2 | 20 | 15 | 100 |
| 4 | 1 | 1 | −1 | −1 | 12 | 2 | 20 | 15 | 68.3 |
| 5 | −1 | −1 | 1 | −1 | 2 | 0.2 | 200 | 15 | 83.4 |
| 6 | 1 | −1 | 1 | −1 | 12 | 0.2 | 200 | 15 | 39.7 |
| 7 | −1 | 1 | 1 | −1 | 2 | 2 | 200 | 15 | 92.5 |
| 8 | 1 | 1 | 1 | −1 | 12 | 2 | 200 | 15 | 48.5 |
| 9 | −1 | −1 | −1 | 1 | 2 | 0.2 | 20 | 40 | 82.6 |
| 10 | 1 | −1 | −1 | 1 | 12 | 0.2 | 20 | 40 | 34.9 |
| 11 | −1 | 1 | −1 | 1 | 2 | 2 | 20 | 40 | 89.5 |
| 12 | 1 | 1 | −1 | 1 | 12 | 2 | 20 | 40 | 53.4 |
| 13 | −1 | −1 | 1 | 1 | 2 | 0.2 | 200 | 40 | 71.3 |
| 14 | 1 | −1 | 1 | 1 | 12 | 0.2 | 200 | 40 | 21.1 |
| 15 | −1 | 1 | 1 | 1 | 2 | 2 | 200 | 40 | 82.9 |
| 16 | 1 | 1 | 1 | 1 | 12 | 2 | 200 | 40 | 29.5 |
The normal probability plot of the residuals is shown in Figure 5. The normality of the data can be checked by plotting a normal probability of residues. It is obvious that, for the adsorption percentage of Murexide, the data points were quite close to the straight line, and this indicates that the experiments originated from a normally distributed population. In addition, a regression analysis was performed to adapt the response function to the experimental data. The effect of one factor is the variation in response that is induced by varying the level of the factor [61].

According to Table 9, pH, C0, and T are the most influential factors on the adsorption efficiency (Ads%), with b1 = −22.16, b3 = −6.67, and b4 = −7.13, for pH, C0, and T, respectively.
| Coefficient | Values |
|---|---|
| b0 | 65.287 |
| b1 | −22.162 |
| b2 | 5.28 |
| b3 | −6.675 |
| b4 | −7.137 |
| b12 | 0.512 |
| b13 | −1.75 |
| b14 | −0.262 |
| b23 | −0.55 |
| b24 | −0.387 |
| b34 | −0.275 |
| b123 | 0.195 |
| b124 | −0.046 |
| b134 | −0.725 |
| b234 | −0.125 |
| b1234 | −0.1 |
It can also be noted that adsorbent mass “m” has a positive effect on Ads% (b2 = 5.29). A significant interaction was found between the pH and C0 for the Ads% with a negative effect (b13 = −1.75).
The ANOVA results revealed that the equation sufficiently describes the actual relationship between the response and the factors with a linear regression coefficient R2 = 0.9857 and adjusted coefficient determination = 0.978 (Table 10). The predicted determination coefficient of 0.963 is in reasonable agreement with (the difference is less than 0.2). Value of p-value prob > F was less than 0.05, indicating that the model terms are significant. In addition, large values of the F-value and reduced values of p-value prob > F confirm the significant effect of the corresponding variables [62, 63].
| Source | Sum of squares | Df | Mean square | F-value | p-value prob > F | |
|---|---|---|---|---|---|---|
| Q (mg/g) | ||||||
| Model | 9883.14 | 5 | 1976.63 | 137.61 | <0.0001 | Significant |
| A-pH | 7858.82 | 1 | 7858.82 | 547.12 | <0.0001 | |
| B-m | 447.32 | 1 | 447.32 | 31.14 | 0.0002 | |
| C-C0 | 712.89 | 1 | 712.89 | 49.63 | <0.0001 | |
| D-T | 815.10 | 1 | 815.10 | 56.75 | <0.0001 | |
| AB | 49.00 | 1 | 49.00 | 3.41 | 0.0945 | |
| Residual | 143.64 | 10 | 14.36 | |||
| Cor total | 10026.78 | 15 | ||||
- R2 = 0.9857; = 0.9785; = 0. 963; std. dev. = 3.79.
The relatively low value of the standard deviation (Std. Dev. = 3.79) demonstrates the small difference between the experimental and predicted values and also confirms the validity of the acquired model [64]. The mathematical model for the determination of the percentage of adsorption removal was applied to build response surfaces and to optimize the conditions of the adsorption process. Figure 6 illustrates the 3D response surface plots for the most significant interaction between the parameters of the process.

For Ads%, the best significant interaction was pH-initial concentration (pH-C0). The Ads% increased with decreasing pH and C0 (Figure 6). Then, a greater Ads% appeared at pH = 2 and C0 = 20 mg/L. The m was fixed at 2 g/L and the temperature at 15°C.
A desirability function approach has been frequently applied in multiresponse optimization due to its simplicity (Figure 7). All variables were considered equally important, and thus the values for the response variables were set to one. The maximum value of the desirability function (1.000) was obtained at pH = 10.82, m = 0.99 g, C0 = 96.01 mg/L, and T = 20°C. Moreover, under these conditions, the predicted response for the Ads% was 52.72%.

To find optimal conditions for the adsorption process of MX onto the activated carbon, model predictions values were compared to experimental data. The correlations between predictions and experimental responses indicated correspondence between the mathematical model and the experimental data.
Therefore, it can be deduced that pH has the most significant effect on the adsorption process. Increasing the pH leads to a reduction in the adsorption capacity of MX on the activated carbon. The coefficient was the strongest negative for the model equation (8). The second significant factor affecting the performance of the batch adsorption process was the adsorbent dose. Its positive coefficient indicates that the adsorption efficiency of AC was favored over an adsorbent dosage of 2 g/L. A higher adsorbent dose produced an increase in the percent of the elimination of the MX dye, as the increased adsorbent dose furnished an adequate surface area for adsorption. The third significant parameter was the initial concentration of MX. The surface and the active sites of the adsorbent may become saturated at increased concentration; thus, the adsorption capacity (%) is reduced with increasing initial MX concentration.
The interaction between pH and C0 was the fourth significant factor. This interaction had a negative coefficient; consequently, a reduction in the pH value of the solution combined with a reduced dose of the adsorbent induced an increase in the removal efficiency (%). In the same way, for the fourth factor, the adsorption capacity decreases as temperature increases; this is also an appropriate factor in the regeneration of activated carbon.
3.4. Regeneration Study
In this section, we discuss the results of the regeneration experiment. The results illustrate that, after each regeneration cycle, the adsorption capacity of MX was reduced, as presented in Figure 8. During the first cycle of regeneration, the percentage of MX removal (Ads%) was 99.6%, but after five cycles of regeneration, the efficiency dropped to 42.4%, suggesting that the regenerated adsorbent retains a high potential for MX removal and is suitable for repetitive usage. As a result, it will be economically productive, and it is very important for commercial applications to reduce secondary pollution in wastewater processing.

The decrease in performance may be explained by the residual of MX molecules inside the pores of the adsorbent [65, 66]. In the basic medium, which is the addition of NaOH in the above situation, the surface of the adsorbent is deprotonated [67]. Thus, the number of negatively charged sites increases, and the number of positively charged sites decreases, leading to a repulsive force between the anionic dye and the adsorbent (Figure 9), as confirmed previously by the study of the effect of pH on the adsorption process of MX. The presence of an excess of OH¯ ions destabilizes the anionic dye MX and favors the desorption phenomenon, consequently the possibility of reuse of the regenerated adsorbent [68, 69].

4. Conclusion
Activated carbon produced by chemical activation of prickly pear seed cake with H3PO4 was able to remove Murexide dye molecules from aqueous solutions. Maximum adsorption of MX occurred at low values of pH, and adsorption capacity (%) also increased with increasing adsorbent dosage. Adsorption kinetics follows the pseudo-second-order model and fits the Langmuir model suggesting that the adsorption is a monolayer phenomenon, which probably occurs on energetically homogeneous sites. Also, the influence of pH (2–10), adsorbent dose (0.2–2 g/L), initial dye concentration (20–200 mg/L), and temperature (15–40°C) on adsorption efficiency (Ads%) was designed by using experimental design methodology. It was discussed based on analysis of variance (ANOVA). The results of the desorption studies show that the adsorbent exhibits excellent regeneration performance and high adsorption capacity after five cycles.
According to the obtained findings, activated carbon, produced by the chemical activation of prickly pear seed cake, could be used as an effective and low-cost adsorbent to decrease the concentrations of dyes in wastewater. The results of this research highlight the importance of recycling agricultural waste to decrease environmental contamination and conserve natural resources. This encourages researchers to conduct further investigations in this area.
Conflicts of Interest
The authors declare that they have no conflicts of interest.
Acknowledgments
The authors would like to express their deep gratitude to Professor Mohamed Naceur Belgacem for his valuable and constructive suggestions during the development of this research work. The study was supported by the Deanship of Scientific Research at the University of Ha’il, Saudi Arabia, through Project no. RG-191251.
Open Research
Data Availability
The data used to support this study are included within the article.