A Mental Workload Evaluation Model Based on Improved Multibranch LSTM Network with Attention Mechanism
Abstract
People’s study, life, and work pressures have increased dramatically in recent years, as the pace of life has accelerated. Long-term high mental stress causes physiological secretion dysfunction and decreased immunity, resulting in a variety of diseases and even the risk of karoshi. Mental workload is another important factor that contributes to mental illness. Accurate assessment of mental workload is a method of effectively coping with physical and mental illness. Traditional physiological indicator measurement is inaccurate because changes caused by physiological indicators may not be solely due to psychological factors. As a result, based on the long short-term memory network, this paper proposes a mental workload evaluation model of multibranch LSTM with attention mechanism (LSTM). This model introduces an attention mechanism based on the classic LSTM network, which can screen the features differently, not only improving the utilization of effective information but also reducing calculation parameters and simplifying the model. This study employs a multibranch LSTM to improve the network’s generalization performance and stability. The basic idea behind multibranch LSTM is to train the branch LSTM network model separately using a variety of data, resulting in a branch LSTM network with a specific structure for the input EEG data. Finally, a total prediction result is obtained by combining the prediction outputs of multiple branch LSTM networks, which is used as the final mental workload evaluation result. The experimental results show that the model used in this paper has higher accuracy and more stable evaluation results in assessing psychological load. This study has a certain amount of reference value.
1. Introduction
The mental state of the human operator is inextricably linked to the task performance of an automated system. The psychophysiological burden of an operator performing specific cognitive tasks, usually related to situational awareness, emotion, and vigilance, is referred to as mental workload. The level of mental workload is affected by social variables such as social pressure and expectations, as well as the operator’s professional knowledge, personality, task type, and physiological variables. Mental workload is an important consideration when analyzing and implementing human-machine collaboration tasks. Long periods of work may result in a decline or even deterioration of memory performance, which usually manifests as the operator’s inability to concentrate on analysis. This can result in inefficient work and even irreversible accidents. As a result, it is critical to improve mental workload classification accuracy and accurately evaluate operator mental workload. Related research can be used to guide operators in their work. The information received during transients is closely related to different levels of mental workload. The study of mental workload evaluation methods is an important component of the study of mental workload. For decades, researchers in a variety of fields have conducted numerous studies and discussions on mental workload assessment methods from their own perspectives, employing the means or methods that they have mastered. Random walk theory, superposition theory, information theory, queuing theory, signal detection theory, and control theory are among the theories or methods at work. Computer sampling, signal amplification and superposition, spectrum and amplitude spectrum analysis, multivariate correlation and regression analysis, and multidimensional scales are some of the modern techniques used. Many specific methods for assessing mental workload have been proposed [1]. However, regardless of the theories on which they are based or the technology used for reference, mental workload assessment methods can be broadly classified into four categories: main task analysis, subtask measurement, subjective assessment, and physiological and biochemical measurement. Many researchers believe that each method has unique characteristics, as well as limitations and application scope. As a result, comparing and studying the sensitivity, applicability, and influencing factors of various evaluation methods is critical for designing mental workload evaluation methods, as well as for the development of mental workload related theories.
Comparing and selecting mental workload evaluation methods is a matter of screening criteria or what basic conditions a mental workload evaluation method should meet. In this regard, even though there are numerous expressions, the qualitative differences are not significant. Many reports state that the mental workload evaluation method should meet the requirements of these aspects, the first of which is sensitivity. The evaluator of mental workload is sensitive to changes in task difficulty or mental resource requirements, but insensitive to external factors unrelated to mental workload. The second characteristic is diagnosticity. The mental workload assessment method can not only reflect the overall level or change in the load, but it can also explain why this change occurred. Third, avoidance of intrusion: to avoid interruption or pollution of the main task, the mental workload evaluation method should be implemented with little or no disruption to the workload. The fourth characteristic is dependability. The method for assessing mental workload should be repeatable. Furthermore, if the evaluation of mental workload takes place in a time-varying environment, the evaluation method should ensure that the time-varying situation can be measured quickly. The fifth factor is validity. Face validity, construct validity, content validity, and predictive validity should all be high in the mental workload assessment method. The sixth step is the operator’s acceptance. The method for assessing mental workload should be acceptable to the experimenter and simple to implement.
Several widely studied mental workload evaluation models are currently available, and they are as follows. According to [2] workers’ mental workload is divided into three components: input load, worker effort, and job performance. According to [3] mental workload is divided into three components: operator, system, and performance, with each component containing different aspects. Based on the single-resource model and the results of the dual-task experiment, [4] proposes a multiresource theoretical model that holds that psychological resources are the foundation for engaging in various homework tasks. The United States studied the relationship between commercial motor vehicle driving time and traffic safety as early as 1935, improved truck and bus safety management regulations, and eventually restricted driver fatigue through legislation [5]. Evaluate the driver’s mental workload indicators, such as attention and reaction time, and then systematically analyze the rest place and rest time to create a scientific driver fatigue evaluation system [6]. The results of [7] show that the operating speed of the flight, as well as the pilot’s reaction to time pressure, plays a significant role in completing this task. Wickens proposed a model for calculating multiresource interference that includes two additive components, one for total task demand and the other for multiresource interference [8]. Control-theoretic models are used in [9] to evaluate mental workload, with the operator modeled as an agency attempting to eliminate feedback errors. To estimate worker workload, define a system variable as the evaluation index of human mental workload [10]. Reference [11] proposed a mental workload prediction model [12] for use in a multitask environment in 2000. In 2003, [13] proposed a new hybrid model that increased the prediction accuracy of mental workload from 61% to 85%. In the design of dynamic control systems, [14, 15] propose a new load modeling concept and develop an operational model for predicting mental workload. According to [16], unlike most task analysis methods, mental workload evaluation methods do not necessitate detailed task scenarios and task decomposition steps, making the model easier to use. During the model’s validation, a strong correlation was found between the model’s theoretical predicted value and the subjective rating scale [17]. The current methods for evaluating mental workload are generally more dependent on the task scenario or the subject group, making it difficult to integrate them systematically [18]. Reference [19] used a systematic modeling method in the development of a mental workload model in 2003. In 2006, modeling ideas of [20] can serve as a good starting point. The main disadvantage of the model proposed in [21] in the same year is that it is not suitable for multitask environments and does not take individual differences into account.
The above-mentioned mental workload evaluation research has an obvious flaw: researchers frequently use only one or a few evaluation techniques in the same context, and many evaluation techniques are relatively backward and less advanced. The outcomes obtained in this manner are less than ideal. Because different techniques for assessing mental workload have different characteristics and limitations, they are appropriate for different situations. Based on this context, this study proposes a new mental workload evaluation model based on a multibranch LSTM network with an attention mechanism. This model introduces an attention mechanism based on the classic LSTM network, which can screen the features differently, not only improving the utilization of effective information but also reducing calculation parameters and simplifying the model. This study employs a multibranch LSTM to improve the network’s generalization performance and stability. The basic idea behind multibranch LSTM is to train the branch LSTM network model separately using a variety of data, resulting in a branch LSTM network with a unique structure for each data. Finally, by combining the prediction outputs of multiple branch LSTM networks, a total prediction result is obtained, which is used as the final mental workload evaluation result. The experimental results show that the model used in this paper has higher evaluation accuracy for mental workload, as well as more stable evaluation results.
2. Mental Workload Influencing Factors
- (1)
Workplace material has an impact on mental workload. The key task characteristic that workers face is work content, which has a direct impact on mental workload. The more work content, the more difficult the job tasks, and the higher the mental workload that the operators face, assuming all other factors remain constant. Workplace content is a broad term. As a result, people categorize work content into three categories: work intensity, task difficulty, and time pressure. These factors are, without a doubt, linked to mental workload. The amount of time it takes to perform a task has a big impact on the mental burden. The higher the mental stress, the longer the time necessary for a particular task [22, 23]. For example, when compared to a truck driver, the captain’s job intensity is twice as high, if not several times greater [24]. The mental burden of workers is affected by the interaction of elements such as the time and intensity required to perform the activity, as well as factors such as time pressure, task difficulty, and operational environment. The degree of difficulty is a term that characterizes the difficulties that people face at work and in school on a regular basis, and it is linked to mental workload. The bigger the mental workload, the more difficult the work. The difficulty of a task is proportional to both the length of time and the intensity of the work task.
-
The time it takes an operator to accomplish a task is referred to as time pressure. The greater the operator’s mental workload is, the more time pressure he or she is under. In comparison to a general-speed truck driver, the captain, for example, completes the driving task for a specific distance. The captain has a limited amount of time to finish his task, and he feels a significant amount of mental strain. The mental workload is also influenced by the work environment [25]. The workers’ acceptance of knowledge is influenced by their working environment. Workers will have difficulty taking task information if the lighting is inadequate or the noise is relatively loud, which will hinder the workers’ ability to process the information [26]. Workers find it more difficult to concentrate in a noisy setting, which increases their mental workload.
- (2)
Individual ability’s impact on mental burden. Whatever the content of the work, it will require people to complete it. There will be no mental workload problem if people do not work. Due to varying physical conditions, the same labor intensity creates varied levels of weariness in physical labor. In mental work, the same is true. Some employees reply quickly, while others respond slowly; some employees have good memories, while others have bad memories; some operators have short attention spans, erroneous distribution, and transfer, and so forth. For the same job assignment, the better the operator’s skill, the lower the mental workload level, and the higher the mental burden level for the operator with comparatively poor ability. For example, in the people selection stage, ability and quality assessments can be utilized to pick some personnel with higher ability and quality, allowing them to adjust to work with a higher mental workload level [27]. In the learning and training stage, it is also feasible to grow and increase the ability and quality of the operators, as well as gradually lessen the mental stress of the operators.
- (3)
The impact of mental workload on performance. The key elements determining the mental workload of workers are the consequences of performance and the standards of performance. If the operator makes a mistake, the greater the threat posed by the repercussions, the greater the operator’s mental workload. Operators shall complete the work in accordance with the established work standards. If the performance appraisal requirements are higher, the operators will have to expend more psychological energy to execute the duties in order to meet the job goals. The mental workload of the operators will be heavier at this time. Because of his work’s safety and punctual operation requirements, a captain of an airplane, for example, must keep his undivided concentration and precise operating specifications. His mental workload is affected by such performance expectations. Furthermore, flight attendants are responsible for passenger transportation, and the protection of passengers’ lives and property is a major responsibility of flight attendants, which influences their mental burden.
3. Mental Workload Evaluation Model of Improved Multibranch LSTM Based on Attention Mechanism
3.1. LSTM Model
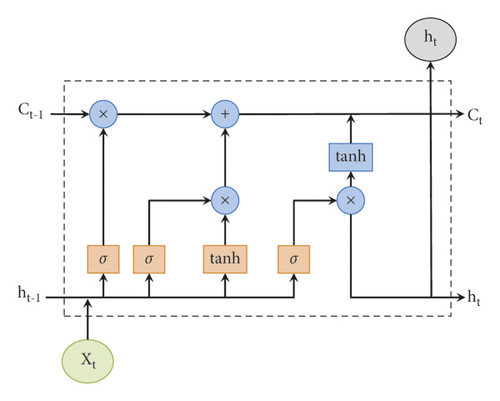
Figure 2 depicts the structure of the LSTM network.
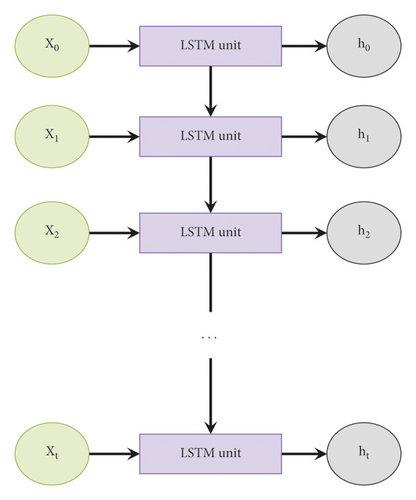
3.2. Multibranch LSTM
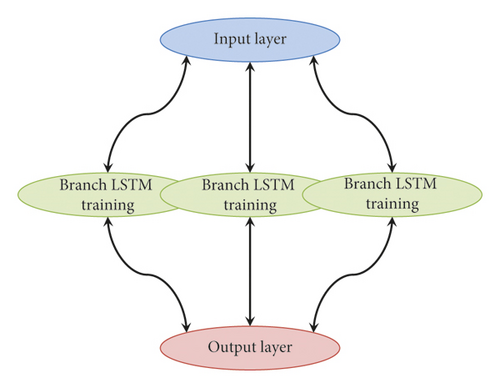
Given that a single LSTM cannot learn EEG information directly and that the dataset utilized lacks contextual semantic information, for direct recognition using LSTM, this is not very accurate. In light of the foregoing, this research employs a multibranch LSTM network for learning effective features in order to address the problem of model overfitting while also making LSTM learn the features of the data more successfully. Figure 3 depicts the multibranch LSTM network’s structural diagram. A three-branch LSTM network is used in the illustration.
3.3. Attention Mechanism
The attention mechanism is thought to be a resource allocation mechanism. The weight parameter is the resource concerned by the attention mechanism in the structural design of a deep neural network. There are two types of attention mechanisms: hard attention mechanisms and soft attention mechanisms. The core of the hard attention mechanism is to directly limit the input in order to achieve the ability to focus on effective information; however, for the characteristics of time series data, directly limiting the input means a lack of data integrity, which will directly lead to the model’s insufficient context modeling capabilities. Unlike the hard attention mechanism, the soft attention mechanism focuses on the difference of the feature information by scoring it and using it as the feature information’s weight parameter. There are differences in the importance of feature information for speech data with time series information, and important salient features frequently contain more related information, which has a greater impact on modeling.
3.4. Overall Model Architecture
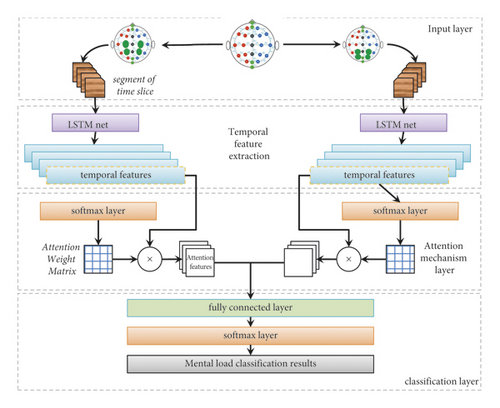
4. Experimental Results
4.1. Experimental Dataset
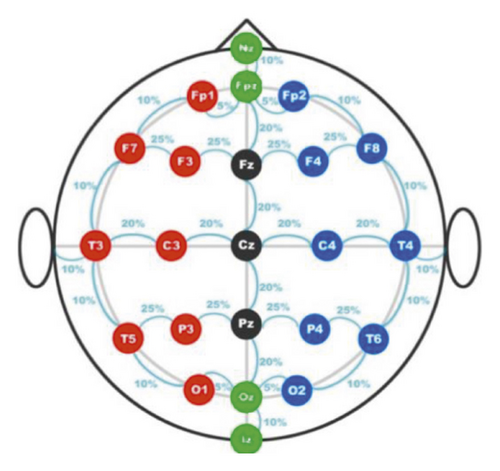
The experimental data used in this paper are EEG data collected by Keirn et al, which can be downloaded from http://www.cs.colostate.edu/eeg/main/data/1989. The EEG data of seven subjects was recorded while they were undertaking envisioning activities in this dataset. In each trial, participants were asked to envision a task. Because the sampling frequency is 250 Hz and the time length is 10 s, each channel of each sample will output 2500 samples. Each action is performed five times in a cycle, with a total of five sorts of activities. The EEG data of the individuals was recorded by 7 electrodes on the head during the sampling period. Figure 5 depicts the sampling electrode distribution. Table 1 shows the number of samples collected for each individual.
| Subject | Number of samples |
|---|---|
| 1 | 10 |
| 2 | 5 |
| 3 | 10 |
| 4 | 10 |
| 5 | 15 |
| 6 | 10 |
| 7 | 5 |
Figure 5 shows 7-channel EEG data recorded by electrodes C3, C4, P3, P4, O1, O2, and EOG. The electrodes A1 and A2 are connected via an amplifier with a bandwidth of 0.1 Hz to 100 Hz and an analog filter with a bandwidth of 0.1 Hz to 100 Hz. The electromastoid’s reference potentials are recorded from these two electrodes. As can be seen in Table 1, subjects 1, 3, 4, and 6 each completed two cycles of tasks. Subjects 2 and 7 went through a series of activities. Subject 5 completed three cycles of the task. Benchmark task, multiplication task, monogram task, geometric graph rotation task, and visual computing task are the five categories of tasks.
4.2. Evaluation Indicators and Parameter Settings
The accuracy of the network model is validated in this paper using a tenfold cross-validation method with a 9 : 1 training-to-test set ratio. In this paper, the model evaluation indicators chosen are accuracy (Acc), precision (P), recall (R), and F1. Table 2 contains a detailed description of each evaluation index.
| Index | Calculation formula | Meaning |
|---|---|---|
| Acc | Acc = TP + TN/TP + TN + FP + FN | The proportion of correctly classified samples in relation to the total sample size. |
| P | P = TP/TP + FP | The proportion of samples predicted to be positive that are also positive in comparison to the sample predicted to be positive. |
| R | R = TP/TP + FN | The percentage of samples predicted to be positive among those that are actually positive. |
| F-score | F − score = 2 × P × R/P + R | In the evaluation of results, we weigh the importance of recall and precision and compute the harmonic mean of the two. |
- Note: TP is true positive, FP is false positive, TN is true negative, and FN is false negative.
The number of hidden layer nodes of LSTM in each branch of the model used in this paper is set to 128, that is, t = 128. The dropout regularization method is adopted, and the dropout coefficient is 0.5.
4.3. Experimental Results
Because the dataset used in this study can be classified into two, three, four, and five types of consciousness tasks, there are ten different task combinations for the 2-type and 3-type awareness task classifications, five different combinations for the 4-type awareness task classification, and only one combination for the 5-type awareness task classification. Table 3 shows the specific combinations. T1, T2, T3, T4, and T5 represent five different types of tasks.
| Number of categories | Specific combination |
|---|---|
| 2 | [T1,T2] [T1,T3] [T1,T4] [T1,T5] [T2,T3] [T2,T4] [T2,T5] [T3,T4] [T3,T5] [T4,T5] |
| 3 | [T1,T2,T3] [T1,T2,T4] [T1,T2,T5] [T1,T3,T4] [T1,T3,T5] [T1,T4,T5] [T2,T3,T4] [T2,T3,T5] [T2,T4,T5] [T3,T4,T5] |
| 4 | [T1,T2,T3,T4] [T1,T2,T3,T5] [T1,T3,T4,T5] [T2,T3,T4,T5] [T1,T2,T4,T5] |
| 5 | [T1,T2,T3,T4,T5] |
CNN [28], RNN [29], LSTM [30], LSTM [31] based on the attention mechanism, and multibranch LSTM [32] were the main comparison models used in the experiment. Each model’s parameter settings are consistent with the references. Experiments with 2–5 classifications were conducted in turn.
4.3.1. Experiment with Two Classification Tasks
The experimental results shown in Table 4 and Figure 6 were obtained after 5 groups were randomly selected from the 2-category combinations shown in Table 3. The experimental results of the 5 groups were averaged.
| Model\Index | Acc | P | R | F-score |
|---|---|---|---|---|
| CNN | 0.7937 ± 0.1125 | 0.8084 ± 0.1226 | 0.8114 ± 0.1310 | 0.7878 ± 0.1063 |
| RNN | 0.7620 ± 0.1281 | 0.7821 ± 0.1118 | 0.7553 ± 0.1332 | 0.7573 ± 0.1451 |
| LSTM | 0.8218 ± 0.1054 | 0.8446 ± 0.1213 | 0.8092 ± 0.1219 | 0.8114 ± 0.1067 |
| Reference [31] | 0.8882 ± 0.0805 | 0.8789 ± 0.1154 | 0.8467 ± 0.1026 | 0.8755 ± 0.1100 |
| Reference [32] | 0.8637 ± 0.0993 | 0.8606 ± 0.0412 | 0.8620 ± 0.0317 | 0.8479 ± 0.0924 |
| Proposed | 0.9533 ± 0.0334 | 0.9721 ± 0.0 215 | 0.9329 ± 0.0281 | 0.9448 ± 0.0332 |
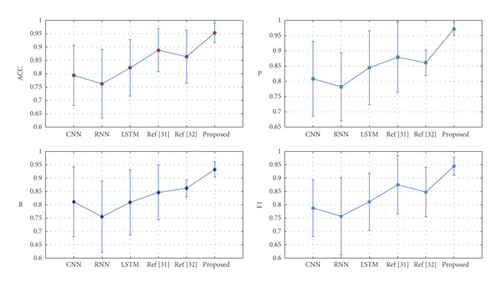
The revised LSTM model utilized in this paper obtains the best assessment outcomes, as indicated by the experimental data in Table 4 and Figure 6. When the data in each column in Table 4 is compared, the experimental effect obtained by LSTM is better than that obtained by CNN and RNN, which is one of the reasons why LSTM is used as the fundamental model in this research. The LSTM model with the addition of the attention mechanism was utilized in [31]. On the basis of the original model, the Acc obtained by this model is increased by 8%, demonstrating that the addition of the attention mechanism may truly improve the effect of feature extraction, hence optimizing the final classification result. A multibranch LSTM is [32]. On the basis of the original model, the Acc obtained by this model has increased by 5%, demonstrating that the addition of a multibranch strategy can improve the model’s classification accuracy. The stability of the model utilized in this paper is the best in the two classification tasks, based on the standard deviation change trend. The Acc indicator shows that the stability of the model utilized in this paper is increased by 77 percent, 74 percent, 71 percent, 59 percent, and 66 percent, respectively, when compared to CNN, RNN, LSTM, [31], reference [32]. The results of the experiments suggest that the model employed in this paper not only increases the classification effect but also enhances the model’s stability.
4.3.2. Classification Task Experiments
Five groups were randomly selected from the three-category combinations shown in Table 3, and the experimental results of the five groups were averaged to obtain the experimental results shown in Table 5 and Figure 7.
| Model\Index | Acc | P | R | F-score |
|---|---|---|---|---|
| CNN | 0.7731 ± 0.1065 | 0.7682 ± 0.1213 | 0.7843 ± 0.1242 | 0.7654 ± 0.1132 |
| RNN | 0.7845 ± 0.1023 | 0.7994 ± 0.1235 | 0.7653 ± 0.1730 | 0.7598 ± 0.1241 |
| LSTM | 0.8123 ± 0.1164 | 0.8345 ± 0.1163 | 0.7992 ± 0.1253 | 0.8013 ± 0.1151 |
| Reference [31] | 0.8632 ± 0.1010 | 0.8721 ± 0.1012 | 0.8543 ± 0.1132 | 0.8646 ± 0.1002 |
| Reference [32] | 0.8637 ± 0.0993 | 0.8606 ± 0.0412 | 0.8620 ± 0.0317 | 0.8479 ± 0.0924 |
| Proposed | 0.9514 ± 0.0362 | 0.9653 ± 0.0324 | 0.9247 ± 0.0432 | 0.9365 ± 0.0531 |
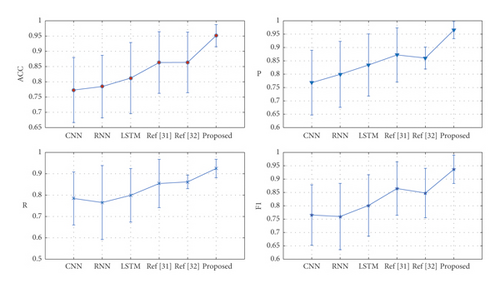
The number of tasks has grown, as evidenced by the experimental findings of the 3-classification task, and each model’s classification performance is essentially consistent with that of the 2-classification task. The experimental data in each column shows that as the number of classifications increases, each model’s classification performance declines marginally, although the amount of the decline is not clear. The experimental effect and stability of the model utilized in this work are still ideal, as evidenced by the data of each model on each index.
4.3.3. Classification Task Experiments
Three groups were randomly selected from the four categories shown in Table 3, and the experimental results of the three groups were averaged to obtain the experimental results shown in Table 6 and Figure 8.
| Model\Index | Acc | P | R | F-score |
|---|---|---|---|---|
| CNN | 0.7553 ± 0.0946 | 0.7634 ± 0.1120 | 0.7717 ± 0.1162 | 0.7532 ± 0.1006 |
| RNN | 0.7721 ± 0.1102 | 0.7842 ± 0.1089 | 0.7586 ± 0.1412 | 0.7446 ± 0.1144 |
| LSTM | 0.7904 ± 0.1085 | 0.8008 ± 0.1092 | 0.7783 ± 0.1154 | 0.7678 ± 0.1019 |
| Reference [31] | 0.8242 ± 0.0890 | 0.8353 ± 0.1145 | 0.8126 ± 0.1093 | 0.8086 ± 0.0974 |
| Reference [32] | 0.8199 ± 0.0686 | 0.8321 ± 0.0854 | 0.8069 ± 0.0765 | 0.8027 ± 0.0679 |
| Proposed | 0.9264 ± 0.0687 | 0.9347 ± 0.0535 | 0.9110 ± 0.0846 | 0.9004 ± 0.0456 |
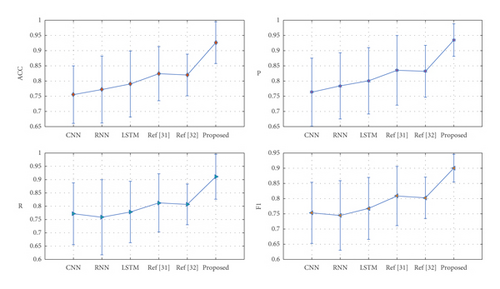
It can be observed from the experimental findings of the four classification tasks that as the number of classifications rises, each model’s classification performance begins to deteriorate dramatically. CNN, LSTM model, and [32] are the most affected, with the index data of these models declining the greatest. Furthermore, we can see that the variance obtained by each model steadily increases, indicating that the greater the number of classifications is, the less stable the system becomes.
4.3.4. Classification Task Experiments
Each model performs 5-classification tasks, and the experimental results shown in Table 7 and Figure 9 are obtained.
| Model\Index | Acc | P | R | F-score |
|---|---|---|---|---|
| CNN | 0.6885 ± 0.1145 | 0.6956 ± 0.1087 | 0.6781 ± 0.1065 | 0.6644 ± 0.1432 |
| RNN | 0.7252 ± 0.1010 | 0.7426 ± 0.1153 | 0.7176 ± 0.1354 | 0.7078 ± 0.1312 |
| LSTM | 0.7146 ± 0.1235 | 0.7347 ± 0.1154 | 0.7255 ± 0.1251 | 0.7118 ± 0.1165 |
| Reference [31] | 0.7487 ± 0.1005 | 0.7665 ± 0.1087 | 0.7533 ± 0.1214 | 0.7402 ± 0.1109 |
| Reference [32] | 0.7337 ± 0.1001 | 0.7640 ± 0.0978 | 0.7543 ± 0.0899 | 0.7311 ± 0.0792 |
| Proposed | 0.9004 ± 0.0743 | 0.9171 ± 0.0742 | 0.9014 ± 0.0735 | 0.9001 ± 0.0567 |
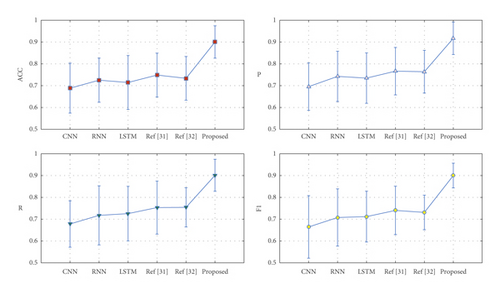
The experimental results of the 5-classification job show that, first, as the number of classifications increases, each model’s classification performance decreases, but the magnitude of each decrease varies. The decrease of the model utilized in this paper does not follow a cliff-like pattern like that of other models, indicating that the model has some stability when the number of classifications fluctuates. The second point is that the model utilized in this research outperforms other models in various classification tasks, demonstrating that the addition of an attention mechanism and a multibranch strategy can truly increase the model’s performance. Third, in terms of variance changes, increasing the number of categories will increase the variance of each model, implying that increasing the number of categories will impair the model’s stability.
5. Conclusion
One of the most important methods for recognizing and preventing mental disease is to assess mental workload. Main task analysis, subtask measurement, subjective assessment, and physiological and biochemical measurement are currently the most often utilized methodologies. They have their own qualities and field of application, and of course there are distinct limits. Previous studies on mental workload measurement methods have frequently yielded inconsistent and unsatisfactory results, which are linked to the inappropriate control of a variety of parameters. This research proposes a mental workload evaluation model using improved multibranch LSTM based on the attention mechanism to increase the accuracy of mental workload evaluation. This paper’s model considers both single-channel and interchannel connections. This paper employs the attention mechanism to better extract the temporal features of EEG signals, so that the network in this paper may pay more attention to the most essential features in the time slice throughout the feature extraction process. The experimental findings suggest that the model utilized in this study performs well in classification tasks 2, 3, 4, and 5. It enhances not only the correctness of the evaluation, but also the model’s stability, when compared to similar models. This research is one step closer to being used in the clinic. This research will focus on how to apply the model to diverse circumstances in order to accomplish multidimensional evaluation in the future.
Conflicts of Interest
The authors declare no conflicts of interest.
Acknowledgments
This study was sponsored by Anyang Normal University.
Open Research
Data Availability
The labeled datasets used to support the findings of this study are available from the corresponding author upon request.


