Economic Crisis Early Warning of Real Estate Companies Based on PSO-Optimized SVM
Abstract
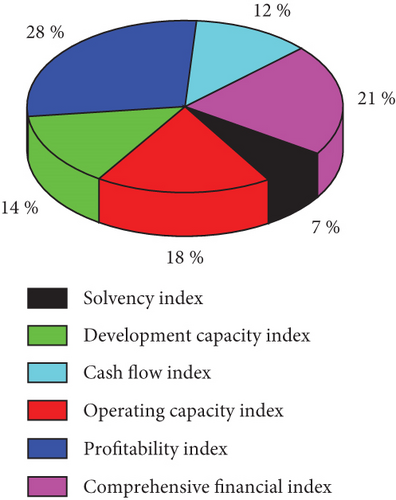
For the possible economic crisis of real estate companies, by analyzing the shortcomings of support vector machine (SVM) model, after optimization with particle swarm optimization (PSO), the PSO-SVM model was established by changing economic condition parameters and using data to warn the real estate economic crisis. Then, this model is used to warn the economic capacity of four real estate companies in Beijing. The results show that this model can further predict and analyze the solvency index, operating ability index, development ability index, profitability index, cash flow index, and comprehensive financial index of real estate companies and come to the conclusion that profitability index is the most important, and higher profitability can resist the harm brought by economic crisis. Finally, it analyzes the economic crisis that real estate companies may encounter and puts forward specific suggestions.
1. Introduction
In the national economic and social development, the real estate industry, as the tertiary industry, occupies a very important position. It has become one of the pillar industries of the national economy [1, 2]. However, the real estate industry has the characteristics of large value, rigidity, high added value and can appreciate with the development of urbanization and modernization, which makes the real estate industry very attractive for investment. According to statistics, the real estate industry accounts for about 25% of the foreign investment attracted since China’s reform and 40% of the projects that attract investment through the real estate industry [3]. As a high value-added industry, the real estate industry can not only provide a lot of accumulation for the country but also speed up the pace of urban construction, promoting the development of urban economy [4].
However, real estate companies still have some economic problems [5–8], such as (1) demand is determined by supply, and urbanization planning is divorced from the process of marketization. Under the condition of market economy, the site selection, scale, scope and timing of the transfer of urban land use right should be determined by the demand of the market rather than the supply of the government. Therefore, the correct approach of the government on this issue is to only determine the supply according to the principle of demand, only through planning and coordination can the supply operation of market maintain a benign state. (2) One sided pursuit of high-level industrial structure, and industrial structure adjustment is divorced from market-oriented orientation. In the market economy, the change of industrial structure is the result of the law of average profit. The market orientation has both blind and reasonable aspects. The rational thinking of the government is to respect its rationality and adjust its blindness. The problem now is, or regardless of the business direction of investors, issue orders, and set targets, and lease to whoever pays a high price. Or do not respect the market orientation of investors, forcibly change the investment direction and unilaterally pursue high-level industries with high technology and high consumption. (3) The immature real estate market leads to blind high land price and low land price. Land itself is not a commodity. In a market economy, its price is not determined by social necessary labor, but the capitalization of land rent, that is, it is determined by the rate of return on investment in land and is affected by the relationship between supply and demand. However, the “buyer’s market” of China’s real estate market has not really taken shape. To determine the lease price of land largely depends on “patting the head.” There are two prominent problems, one is the blind high price behavior, the other is the administrative and policy needs, competing to lower the land price, which brings the blindness of land investment. Therefore, it is urgent to establish a model that can predict the economic crisis of real estate companies.
The support vector machine (SVM) was first introduced in the kernel function; SVM has the advantages of universality, robustness, effectiveness, and simple calculation point, which can better solve the classification problem in the case of small samples, nonlinearity, and high dimension, and has strong generalization ability [9]. However, whether the parameters of support vector machine are appropriate or not will have a great impact on the training and convergence of data [10–14]. Particle swarm optimization (PSO) has not only global optimization ability but also efficient convergence and strong local optimization ability [15–18]. Therefore, the PSO algorithm is used to optimize the SVM parameters and make SVM conduct the problem and then applied to the prediction of real estate economic crisis, which has attracted the interest of researchers at home and abroad.
Based on the PSO-SVM model, Quandang et al. [19] analyze the measures taken by different real estate companies to deal with economic crises. Through the study of these preventive measures, a mechanism model for predicting the economic crises of real estate companies is established. Zhaojun et al. [20] adopt the single-variable SVM early warning model, selects the financial indicators of different real estate companies as the method of economic crisis early warning, and indirectly reflects the financial crisis of some real estate companies through the financial indicators selected by the research. However, due to the limitations of the early warning model, the research still has some shortcomings, which can be regarded as descriptive research statistics. Jiang [21] takes into account the shortcomings of only using the financial status of real estate companies as early warning indicators, and the indicators of different real estate companies’ operating capabilities, solvency, and development capabilities are different. The SVM model optimized by PSO is adopted to provide different real estate companies. By giving certain weights to different financial indicators of different real estate companies, the discrimination value of weighted average value is obtained. This model can be a good early warning of the economic crisis of real estate companies. Wang et al. [22] optimize the SVM model and use the index ratio as the evaluation method of the model. Ten bankrupt companies and 10 companies with good financial performance are selected for research, and the economic crisis early warning model of real estate companies is effectively verified. Zhou et al. [23] use the PSO-SVM model to analyze the bankrupt companies in the United States. The results of the study show that the country’s macroeconomic policies have a reference value to a certain extent on whether the company has a financial crisis. Its impact is greater, which is consistent with the economic crisis encountered by actual real estate companies, and has a good early warning and judgment.
By combining PSO with SVM, this paper analyzes the solvency index, operating ability index, development ability index, profitability index, cash flow index, and comprehensive financial index among different real estate companies and then uses PSO to find the best penalty factor C and kernel function parameters σ and establish the best SVM model, so as to carry out relevant early warning and analysis of the economic crisis of real estate companies.
2. Establishment of SVM Model
The main idea of SVM is to make the samples to the feature space through a nonlinear mapping function K and carry out linear regression operation in the high-dimensional space.
During regression, the kernel function parameters need to be confirmed σ.
3. SVM Parameter Optimization Method Based on PSO
In the SVM regression model, penalty factor C and kernel function parameters σ have a great impact on the performance of the system. The parameter selection process of SVM is equivalent to an optimization process. It may be the optimal solution for every point. Therefore, the optimal solution can be obtained by finding the point with the smallest generalization error. When the PSO is used to optimize the parameter selection of SVM, it is effectively improve the parameter optimization ability [24, 25].
3.1. PSO Principle and Improvement
The PSO algorithm is an intelligent optimization algorithm derived from the flight foraging behavior of birds. All points in the search space of the algorithm are the complete set of problem solutions. Each particle represents a potential optimal solution. Each particle has its own position and speed, as well as a fitness value.
Therefore, the calculation method is as follows:
3.2. PSO Optimization SVM
- (1)
Initialize PSO algorithm parameters. Including SVM penalty factor C and kernel function parameters σ, population size, initial position and velocity of particles, individual extremum pi, and global extremum pg
- (2)
Update the inertia weight ω according to equations (11) and (12).
- (3)
Update the velocity and position of the particles by the equations (9) and (10).
- (4)
Taking the mean square error of regression as the function, the individual optimal Pbest and global optimal Gbest are recorded
- (5)
If the conditions are met, the result will be output. Otherwise, skip to step 2
3.3. PSO-Optimized SVM Classification Model
3.3.1. Initialization
- (a)
When the particle swarm optimization algorithm processes large sample data, the calculation iteration speed is very slow, so first take any size sample from the experimental sample as the training sample in the whole iterative optimization process and obtain the best regression parameters after many experiments
- (b)
Initialize particle m to 20 × 2, where 20 is the population size, and then find the optimal penalty factor C and kernel function parameters σ
- (c)
Initializes the speed of particles
- (d)
Using the k-fold cross-validation method, the normalized subsamples and the initialized particle swarm are substituted into the svmtrain function to calculate the initial fitness value
- (e)
Initialize the global extremum and individual extremum, where the global extremum is the optimal value of the initial fitness value of all particles, and the individual extremum is the initial fitness value of each particle
3.3.2. Iterative Optimization
- (a)
By updating the velocity and position of the particles, the parameters are obtained. If the boundary value is exceeded, the boundary value is taken to generate new particles
- (b)
The fitness value of the new particle is calculated and compared with that of the previous generation. If it is better than the fitness value of the individual optimal particle of the previous generation, it will be regarded as the optimal solution of the current particle
- (c)
If the particle is better than the fitness of the current population optimal solution, it will be regarded as a new population optimal solution
3.3.3. End Iteration
Check whether the iteration reaches the maximum number of iterations. In the iterative process, if it is found that after a certain number of iterations, the optimal moderate value no longer changes; it can be determined that the maximum number of iterations has been reached at this time. If it has, end the optimization. Return the global optimal C sum at the same time σ.
4) Will get C and σ substitute SVM to establish a classification model to test and analyze the economic crisis early warning model of real estate
4. Results and Discussions
This article analyzes the financial status of four real estate companies in Beijing (China Overseas Land, replaced by A, China Resources Land, replaced by B, Beijing Urban Construction, replaced by C, and China Communications Land, replaced by D) to analyze the solvency index, operating ability index, development ability index, profitability index, cash flow index, and comprehensive financial index are used as the economic capabilities between companies, and then, the PSO-optimized SVM model is used for early warning analysis, in order to provide the experiment support for the economic crisis of real estate companies.
4.1. Solvency Index
Solvency index refers to an important management index of enterprise financial management, which refers to the ability of an enterprise to repay due debts (including principal and interest). From the perspective of creditors of real estate enterprises, what they are most concerned about is the solvency of real estate enterprises, because the basic purpose of creditors’ lending funds is to obtain interest income. If the real estate enterprise fails to pay the principal and interest on time, it is bound to suffer certain losses for creditors. Therefore, if real estate enterprises want to have a better financing environment, they must match a strong solvency. Only in this way, real estate enterprises can collect more funds for investment, so as to bring more profits to investors.
Short-term solvency refers to the degree to which an enterprise’s current assets guarantee the timely and full repayment of current liabilities. It is an important indicator to measure an enterprise’s current financial ability (especially the liquidity of current assets). The measurement indicators of an enterprise’s short-term solvency mainly include current ratio, quick ratio, and cash current liability ratio. The liquidity of current assets determines the strength of short-term solvency, that is, the speed at which assets are converted into cash. The stronger the liquidity of current assets of real estate enterprises, the corresponding short-term solvency is also strong. However, long-term solvency refers to the ability of an enterprise to repay long-term liabilities. The measurement indicators of long-term solvency of enterprises mainly include asset liability ratio, property right ratio, contingent liability ratio, interest earned multiple, and interest bearing liability ratio.
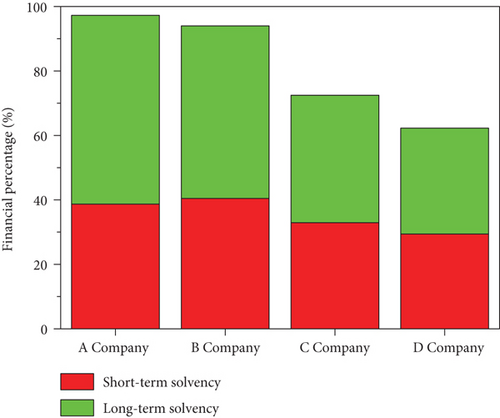
Figure 1 shows the solvency indicators of different companies. It can be seen that B company has the best short-term solvency, followed by A company, and D company has the worst short-term solvency. The main reason may be that the funds of B company are maximized, which will indirectly increase the profitability of the enterprise, and the short-term current liabilities of the real estate company can be well guaranteed, so as to meet the short-term debt capacity of the enterprise. On the contrary, it will occupy too much capital of real estate enterprises, which will increase the opportunity cost of capital. From the perspective of long-term solvency, A company is the best and that of D company is still the worst. The possible reason is that the interest protection multiple between companies is different. If the profit before interest and tax is greater than the interest expense, the real estate enterprise may have the possibility of debt. If the interest coverage ratio is at a low level, it means that real estate enterprises will encounter losses, debt insecurity, and other problems. The higher the interest coverage ratio, the higher the degree of protection provided by the profits of real estate companies for paying debt interest, and the stronger their long-term solvency.
4.2. Operating Capacity Index
Operating capacity is measured by asset management ratio. Common indicators that can reflect the operation and management efficiency of real estate companies include total asset turnover ratio, accounts receivable turnover ratio, inventory turnover ratio, and fixed asset turnover ratio.
By calculating the total asset turnover rate, we can compare the total asset operation capacity of real estate enterprises. The indicator reflecting the operating capacity of total assets is the total asset turnover rate. The total asset turnover can be calculated by subtracting the sales cost from the current sales revenue of the real estate enterprise and then comparing with the average amount of assets in the previous period. The inventory turnover rate is obtained by calculating the ratio of main business cost to the average of opening inventory amount and closing inventory amount. This indicator can be used to assess the performance of relevant business processes of real estate enterprises. The turnover rate of fixed assets is usually used to reflect the operating capacity of fixed assets. The so-called fixed asset turnover rate is the average value of the net operating income of the food industry compared with the fixed assets at the beginning of the previous period and the fixed assets at the beginning of the current period. This indicator can describe the current turnover of fixed assets of real estate enterprises.
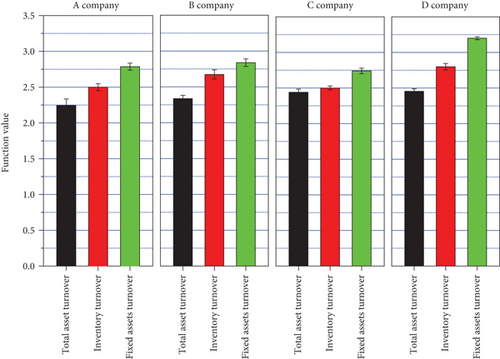
Figure 2 shows the operating capacity index between different companies. It can be seen that the turnover rates of D company are high, followed by B company and A company, and the turnover rate of C company is the worst. The above results show that D company has high operation and management efficiency and good asset turnover capacity, which can ensure the solvency of the enterprise to a certain extent, avoid some bad debt reserves, and then improve the operating profit of the enterprise. Therefore, if real estate enterprises want to maintain a high turnover rate of fixed assets, they must make reasonable investment and pay attention to the portfolio structure. The high turnover rate of fixed assets means that the operation capacity of real estate enterprises is strong.
4.3. Development Capacity Index
The development process of real estate enterprises can show the production and operation of some enterprises. In the process of enterprise development, it will constantly tap its own potential, which is the basic situation of development ability. At present, a common index of development capacity includes sales revenue growth ratio, net profit growth ratio, capital accumulation ratio, and total asset growth ratio.
The growth rate of sales revenue can be used to explain the change of sales revenue in a certain period. Through this index, we can judge the market operation and change trend of business performance. The net profit growth rate is the ratio of the current net profit minus the previous net profit to the previous net profit. Generally, the capital accumulation rate can be calculated by comparing the change amount of owner’s equity in the current period with the amount of owner’s equity at the beginning of the previous period. This index is generally used to evaluate the current capital accumulation of enterprises. The growth rate of total assets is mainly the result of calculating the change of assets compared with the total assets at the beginning of the previous period. It can generally be used to measure the change of total assets of real estate enterprises in the current period.
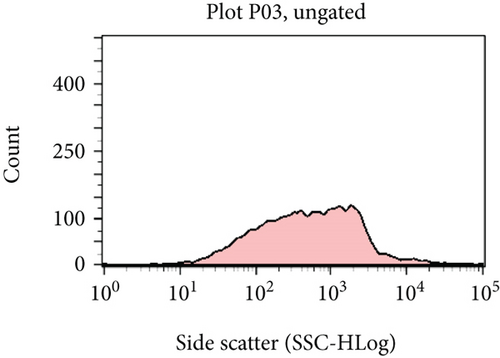
Figure 3 shows the development capacity trend of different real estate companies. The ordinate indicates the level of development ability. The larger the value is, the stronger the development ability of the company is. The abscissa indicates the value changes of different growth rates. The larger the value range, the better the future financial improvement ability of the company. It can be seen that A company and B company have the best financial improvement ability in the future and lack the current development ability, while C company and D company have the strongest current development ability and limited future financial improvement ability. Considering the comprehensive factors, the development capacity index of B company is the best.
4.4. Profitability Index
Profitability is a very valuable indicator for both internal managers and external information users. Generally speaking, profitability means the ability of real estate enterprises to earn profits. Usually, the profit index is connected with the current operating income, operating profit and asset scale of the enterprise.
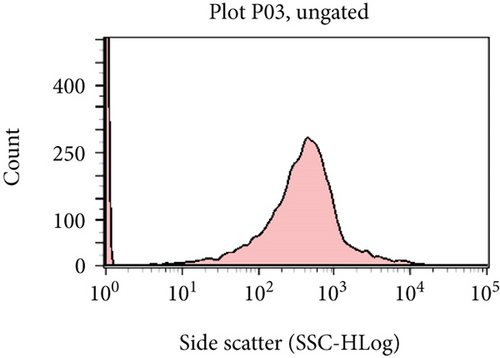
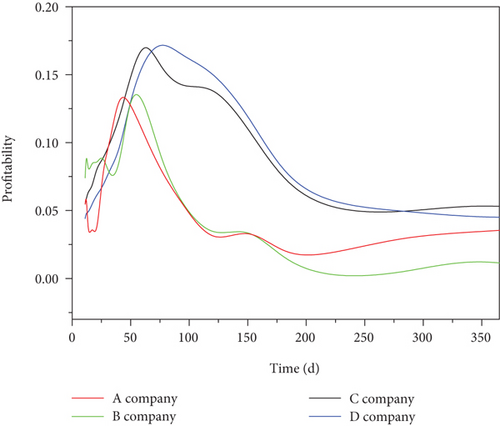
Figure 4 shows the profitability of different companies. It can be seen that the profitability of A company and B company is poor, and the profitability of A company is lower than that of B company in the early stage and slightly higher than that of B company in the later stage. The similar profitability of C company and D company indicates that the two companies have good profitability, which is also consistent with the actual profits of the company.
4.5. Cash Flow Index
Cash flow analysis generally includes cash flow structure analysis, liquidity analysis, cash acquisition ability analysis, financial elasticity analysis, and income quality analysis. Real estate enterprises pay more attention to cash flow; if the cash flow of real estate enterprises breaks, the impact on real estate enterprises will be a heavy blow. Enterprises will be unable to pay workers’ wages, leading to workers’ strike, interruption of cooperation with other companies, and in serious cases, enterprise bankruptcy. Considering that the liquidity of assets is inversely proportional to profitability, it is impossible for real estate enterprises to retain too much cash. They should mainly be careful with the ability of enterprises to realize profits. Through the cash flow index, the matching relationship between the cash flow generated by the enterprise in the current period and the total liabilities can be calculated. It is generally believed that the higher the index, the better, indicating that the financial situation of the enterprise in the current period is better.
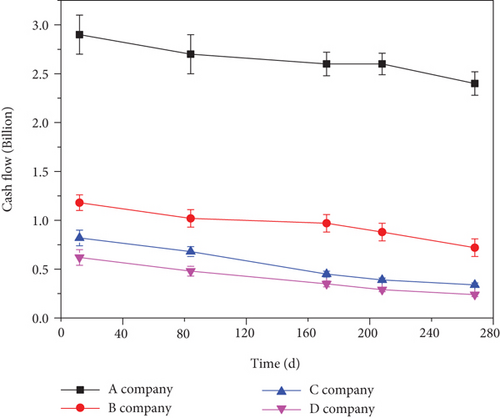
Figure 5 shows the cash flow of different real estate companies. It can be seen that A company has good financial ability, with the highest cash flow and the lowest cash flow of D company. However, combined with the profit index, although A company has more cash, its profit is the lowest, which shows that A company should strengthen its financial management ability and make rational planning and use of cash in order to deal with the possible financial crisis.
4.6. Comprehensive Financial Index
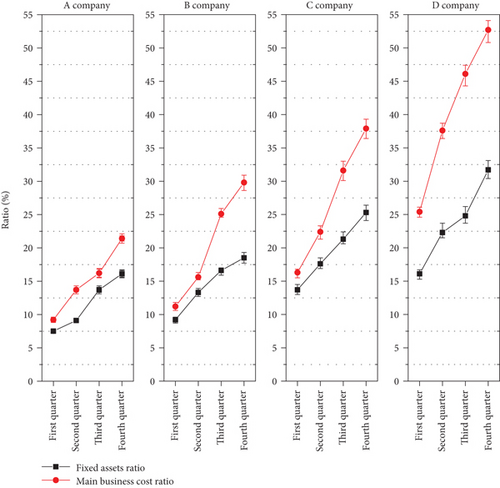
In addition to the above five indicators, the comprehensive financial indicators mainly refer to the ratio of fixed assets and the cost ratio of main business. The larger the ratio of fixed assets, it indicates that there is no idle waste of fixed assets in real estate enterprises. This indicator is mainly used to measure the proportion of the main business cost of the real estate enterprise in the main business income. If this indicator is too large, it indicates that the real estate enterprise should take the main business cost seriously, control the cost of the real estate enterprise, and do a good job in its own cost management.
Figure 6 shows the comprehensive financial capacity values of different real estate companies. It can be seen that the main business cost rates of the four companies are higher than the fixed assets ratio in each quarter, and the fixed assets ratio and main business cost ratio of D company are the highest, indicating that D company has good fixed assets and good ability to resist the economic crisis; A company’s ability to resist the economic crisis is poor, so it needs to prepare for the possible economic crisis in advance.
- (1)
Real estate enterprises should be careful with the profitability and realize the growth of net profit for development projects. Choose appropriate projects for investment, do not invest blindly, otherwise, it will bring a serious burden to the enterprise. Because only by finding the growth point of profit, the enterprise will not fall into financial crisis
- (2)
Reasonable use of financial leverage, real estate enterprises will inevitably have to carry out financing. When financing, we must consider the impact of financial leverage on enterprise operation. Too high financing cost will aggravate the operation burden of enterprises and even bring experience risk
- (3)
Cash plays a small role in the enterprises. Enterprises must be careful with the same sales money to prevent the rupture of the enterprise’s capital chain. Of course, we cannot keep too much idle funds, which is bound to cause a certain waste. For repayment projects such as loans that are about to expire, sufficient funds should be prepared in time. So as not to affect the enterprise credit
- (4)
To strengthen cost control, real estate enterprises attach the significance to the impact of costs on enterprise operation. Excessive operating costs will increase the burden on enterprises and reduce their benefits. Therefore, real estate enterprises should strive to reduce daily operating costs and development costs, but the premise is to ensure the quality of goods and services
- (5)
Real estate enterprises should strengthen market development. At present, there are many real estate enterprises, and the products developed tend to be homogeneous. How to better base themselves on the local or regional market will be a very important problem. Only when sales increase, the corresponding sales revenue will go up
5. Conclusion and Outlook
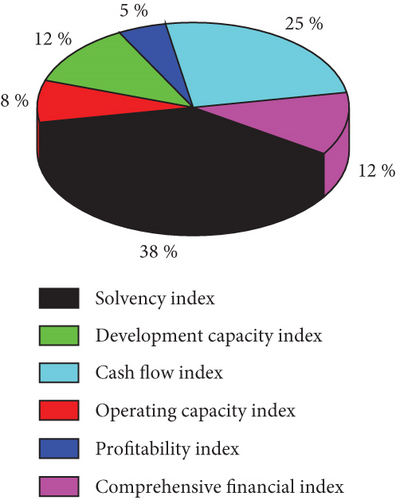
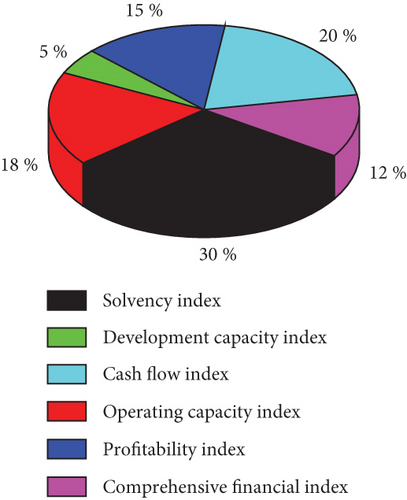
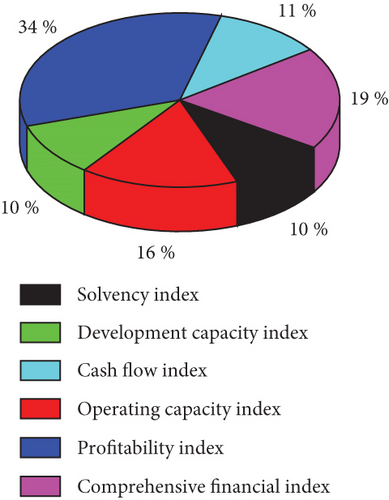
Aiming at the possible economic crisis of real estate companies, this paper establishes an optimal PSO-SVM model based on the existing SVM model and then uses PSO for optimization analysis. Then, the model is applied to four real estate companies in Beijing to analyze the economic ability of the company with solvency index, operating ability index, development ability index, profitability index, cash flow index, and comprehensive financial index. The results show that the profitability index is the most important for real estate companies. Only companies with good profitability can be able to deal with the possible economic crisis. In addition, the PSO-SVM model can effectively warn the economic crisis of real estate companies and provide a certain application basis and theoretical support for the large-scale application of the model.
Conflicts of Interest
The author declares no competing interests.
Open Research
Data Availability
The labeled dataset used to support the findings of this study are available from the corresponding author upon request.


