[Retracted] Exploration of Flood Prediction in Watersheds Based on the Fusion Analysis of Remote Sensing Big Data with Multiple Physical Fields
Abstract
It is well known that flooding brings great losses to people’s production and life, just because it is unsuspected, is extremely extensive, and has high frequency. More than half of the people in China live in flood-prone areas, and their lives and properties are threatened. Flood risk assessment is one of the measures of flood management, and it is economically and socially important to assess flood risk. The scope of the traditional monitoring and forecasting early warning system is mainly limited to the area affected by flash floods, while the objective reality of real-time monitoring, forecasting, and early warning of flood disasters in the area affected by river floods and by the scheduling of riverine terrace power stations is not possible. The multiphysics remote sensing big data fusion analysis can divide the data into grids according to the grid method in the sliding time window, filter the normal data by information entropy in each grid, judge the remaining data that may be abnormal by using local abnormality factor, and eliminate the abnormal data according to the judgment result. This paper introduces the application of remote sensing in flood control field, proposes the framework of basin flood prediction based on multiphysics field remote sensing big data fusion analysis, and designs each functional module of the system according to the object-oriented idea to realize the functions of data management, image processing, spatial analysis, and simulation output. The method can change the problems of cumbersome data processing and basic parameter rate determination in traditional hydrological methods and can find certain regularity through the connection between all related factors. Meanwhile, the use of artificial intelligence and other technical means makes the calculation speed faster and the obtained results are closer to the actual measured values, which is beneficial to guide the practical work.
1. Introduction
North of the Qinling and Huaihe rivers and downstream of the Yellow River basin in China is a relatively typical semihumid and arid region under temperate monsoon climate. Every July and August, under the influence of the western Pacific subtropical monsoon, the region experiences a steep increase in rainfall resulting in floods along the river basin, posing a serious threat to people’s property and life safety [1]. Flooding has brought about a bad impact on human production and life and has become one of the biggest losses from natural disasters [2]. A real-time flash flood disaster monitoring and forecasting early warning system covering the whole basin has been basically built, and the existing basin flash flood disaster early warning system cannot meet the actual needs of flood control departments in terms of joint river-wide flood scheduling and joint warning [3]. However, how to integrate, mine and analyze, and expand the application of the survey and evaluation results of flash flood disaster prevention and control is a major issue facing the watershed and even the whole Guangxi water conservancy industry.
In the process of struggling with floods, people have concluded the experience of regulating floods with water conservancy projects and have controlled floods to some extent by constructing a large number of flood control projects such as embankments and reservoirs [4]. After the reservoirs were built, some water conservancy projects were implemented later in their upstream basins, resulting in changing the runoff process, and if the flood prediction model did not reflect this change in a timely manner, the accuracy of the prediction model would not be up to the requirements [5]. However, flood control engineering treats the symptoms but not the root cause, and consumables are labor intensive, so the concept of flood treatment has changed from control to management, from relying on flood control engineering to combining flood control and management [6]. With the development of satellite remote sensing technology, especially the increase in the number of domestic remote sensing satellites launched and the significant reduction in the cost of use, the operational use of multiphysics field remote sensing technology means for regular flood monitoring has become possible [7]. Multiphysics remote sensing, in a broad sense, is a detection technique that senses a target object or natural phenomenon at a long distance without direct contact [8]. Flood risk uncertainty addresses the factors in flood risk, which include the gestating environment, the causative factors, and the hazard-bearing bodies [9]. With the development of society and human changes to the environment, the gestation environment has become more and more complex, including man-made factors in addition to natural ones, such as expansion of fields, occupation of river channels, and global warming [10]. Hydrological forecasting provides information for flood control and a basis for making decisions, which can forecast flood processes accurately and timely and can provide a scientific basis for the development of flood control plans.
The main problems can be divided into the following: the pollution of rivers caused by human waste and sewage and the prevention and control of natural disasters such as river water allocation and flooding. By analyzing the hydrological situation in the river network through the numerical simulation model of the river network, we can provide the law of the evolution of each hydraulic element of the river with time and space and provide an important database for the flood control planning of the river network. However, the inherent drawback of single-point rainfall measurement determines that it cannot fully represent the real spatial and temporal distribution of precipitation in a watershed or region, while in most cases, the observed values of runoff usually can truly reflect the changes of precipitation in a watershed. Therefore, through the use of multiphysics field remote sensing satellite data, we provide regular monitoring of water body dynamics during the flood warning period for flood monitoring needs and combine with ground monitoring data and flood forecasting data to carry out water body inundation extent, impact evaluation, and impact forecasting.
The innovation of this paper is to adopt the ordered weighted average method of multiphysical field remote sensing big data fusion analysis. By changing the decision-making risk coefficient, we can change the importance of evaluation indicators and get the evaluation results of different attitudes. The technical process of flood remote sensing monitoring and the establishment of flood prediction model are discussed. The idea of watershed flood forecasting based on multiphysical field remote sensing big data fusion analysis is to divide uncertainty into objective world uncertainty and human cognitive uncertainty. In this paper, a flood forecasting model is proposed, which uses the input of control quantity to replace the impact of human activities in each river section and subtly examines these methods from other angles.
2. Flood Prediction of River Basin Based on Multiphysical Field Remote Sensing Big Data Fusion Analysis
2.1. Technical Process of Flood Remote Sensing Monitoring
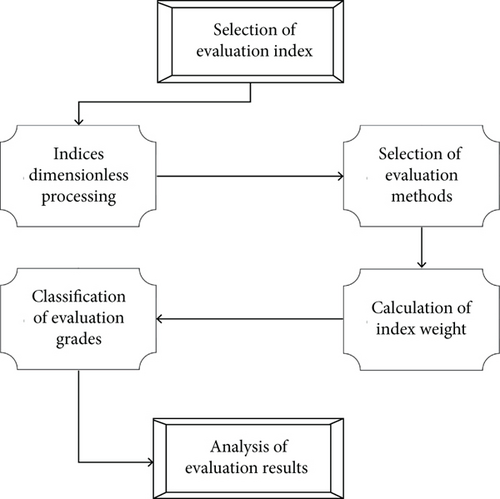
Permanent flood multiphysics field remote sensing monitoring needs to follow an operational technical process to guarantee the monitoring procedures and result specification. To ensure the standardization of monitoring procedures and results, the level of monitoring technology should be improved, and the professional training of environmental monitoring technicians should be strengthened [11]. It is necessary to provide monitoring personnel with the opportunity to visit and learn and broaden their horizons. Experts with rich monitoring knowledge and years of practical monitoring experience are invited to provide business guidance and operational technical skills training. Strive to improve the level of monitoring point distribution, on-site sampling, laboratory analysis, and preparation of monitoring reports. Strengthening the construction of environmental monitoring quality management system is to ensure the accuracy of environmental monitoring data [12]. Especially in the case of multiple people and groups involved, it is possible to ensure the convergence of data and product results between the processes. The steps of the flood risk level evaluation in the study area are broadly based on six steps for summary analysis and evaluation, as shown in Figure 1 below.
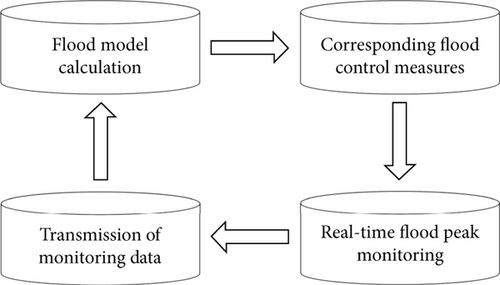
For different factors in flood risk with different weight priorities, we obtained a flood risk hierarchical analysis structure using hierarchical analysis. The test focuses on how clouds interfere with the acquisition of water surface information, because a large number of samples are required to construct the correlations. However, there is not much multiphysics field remote sensing information that can be relied on, so this study uses all the collected multiphysics field remote sensing data and then removes the reservoir water surface information under cloud disturbance. This requires both real-time flood computation and real-time model computation, which is a complex project. The commonly adopted approach is shown in Figure 2.
The analysis uses historical disaster data and historical hydrological data to correct hydrological parameters for precipitation forecasting results, which are gridded at 3 km2 × 3 km2. Compared with large and medium-sized reservoirs, small reservoirs have larger gaps in management level and system due to regional differences, which can reduce the accuracy of actual survey and operation information. Moreover, some small reservoirs lack complete information on the change of reservoir volume even during the field floods. If the gray value of the background can be reasonably seen as constant throughout the image and all objects have almost the same contrast with the background, then as long as the correct Min value is chosen, using a fixed global closed value will generally have a better segmentation effect.
Finally, the last step is water body extraction. After the preprocessing of multiphysics field remote sensing images is completed, water body extraction is carried out to obtain water body extent information, through specific technical means to open up the meteorological data collection channel between the flood forecasting end of the basin and the National Weather Bureau, Weather Forecast Center, and Meteorological Agency. The weather data collection channels with the National Weather Bureau of China, the National Weather Bureau of the United States, the European Weather Forecast Center, and the Japan Meteorological Agency are established, where the minute precipitation data from the Public Weather Service Center of the China Meteorological Administration are used for 0~1.5 h short prognosis. At the same time, historical disaster data are collected and the model parameters are recorrected, so as to form a closed loop and continuously improve the forecast accuracy. Later, the detected data with higher accuracy can be applied when calculating the correlation between reservoir capacity and area of various small reservoirs. A threshold that works well in one area of the image may work poorly in other areas. Based on the weight ranking and expert experience evaluation, we obtained the basic probability distribution function of the evidence-based inference theory, and the risk level of the study area was obtained by fusing the flood factors with the evidence-based theory. In this case, it is appropriate to take the grayscale threshold as a function value that varies slowly with the position in the image.
2.2. Establish Flood Forecasting Model
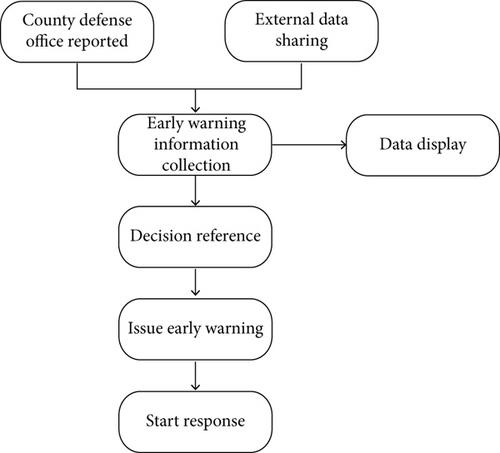
Due to the delayed nature of storm floods and the need for real-time forecasting, a direct “rainfall-water level” model needs to be considered. The river model and the flood algorithm are combined into one, specifically for storm flood prediction. In the early warning response tracking system, the staff of flood control office will start the corresponding flash flood prevention and control plan by the level of warning information and carry out the flood control work according to the preparation of the plan; the business process of the early warning system is shown in Figure 3 below.
Finally, waiting for the flood water to flow through the area, the flood water that travels in the downstream channel is evolved in real time based on the actual monitoring data transmitted back, and so on. To make the differential equation correctly reflect the physical mechanism of water flow, such as using the central format to calculate rapids, it is physically inappropriate to use only the continuity of the solution. Control differential equations express the physical laws of conservation of mass and conservation of momentum, while differential equations sometimes do not strictly maintain the nature of conservation; the numerical solution will appear in the amount of water and momentum imbalance of conservation errors. For the satellite image data such as HSPA-1, ENVISION 1A/1B, RESOURCE-3, and RESOURCE-1 02C, which only have blue, green, red, and near-red bands, the normalized difference water index (NDWI) is used to automatically extract water bodies using the contrast between absorption and reflection of water bodies in the green and near-red bands. The data structure of finite element is used for river network description similar to the rod system structure, and the data preparation is simple for the problem of adding river cross sections in the program study phase. By means of 3S technology and Internet technology, while relying on the water and rainfall data information that has been collected into the reservoir, rapid response and unified command and dispatch of flash flood-related events are realized.
3. Application Analysis of Big Data Fusion Analysis in Basin Flood Prediction
3.1. Calibration Analysis of Water Source Parameters
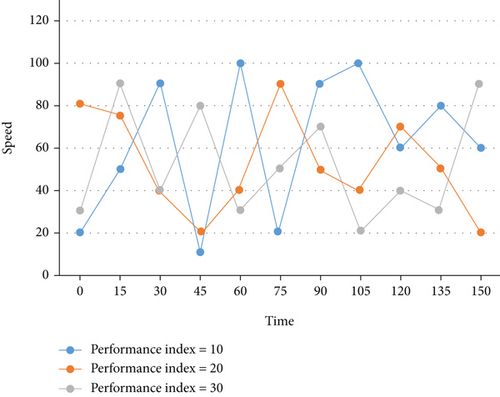
Due to the complexity of hydrological elements, describing the relationship between systems by physical quantities is inherently error-prone, coupled with the fact that many actual measurements are not observable, or are missed, or the observations are not representative. Energy losses are mainly concentrated in the data transmission process. In order to compress the amount of data and reduce energy consumption while improving the accuracy of data fusion, a water source model parameter rate determination method is proposed. This method often uses the empirical method to determine the initial values of the parameters and then uses the hydrological model calculation to perform the calculation of the production and convergence processes. Then, the hydrological model calculations are used to calculate the production and sink processes, and the process is compared with the measured process, and the optimization and debugging are continuously carried out to determine the optimal values of the parameters empirically using the principle of minimum error. Next, to verify whether the control law is effective, the performance indexes are selected as 10, 20, and 30, and the simulation curves are shown in Figure 4.
First, continuous data for a certain period are selected for the calculation, and the selected time series data information including the abundance and exhaustion years gives better results. In the distributed big data fusion principle, the distributed data set is first obtained and the data set is divided into several subsets. Then, by drawing Tyson polygons based on the location of watershed stations, the area weights of Tyson polygons are used to obtain the weighted sum of watershed surface rainfall. The data collection and caching mechanism of the complex heterogeneous multilayer network is centered on real-time sensing of data and accurate processing of decision information, eliminating the quality constraints of network data by redundant information and various types of interference from the external environment. For individual phase to be analyzed, the selected data can be selected based on the geographic base map and remote sensing base map through interactive methods and exported. Based on the operational data of the reservoir and the multiphysical field remote sensing data, the relationship between the reservoir volume and the watershed area is described; then, what changes in the volume of the small reservoir ponds and dams are derived based on the evaporation information of the precipitation, and the flood interception volume of the corresponding flood period is derived. By visualizing the rainfall map with histograms according to time, users can clearly grasp the local rainfall changes. The comparison curves of water level and storage volume at different times are shown in Figure 5 below.
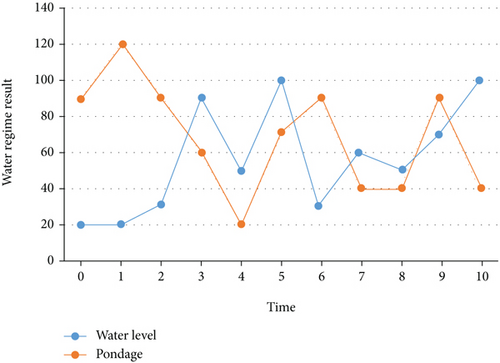
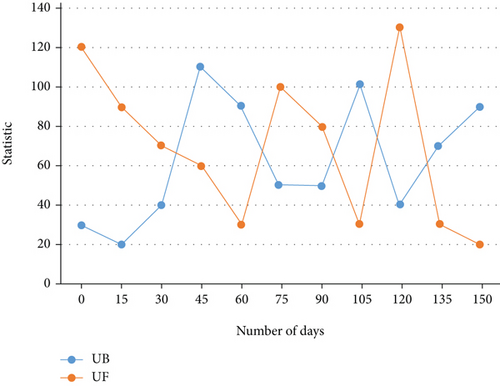
Secondly, the calculated results are compared with the measured results to calculate the error, and the optimal values of the parameters are obtained by repeating the calculation until the final error is minimized. Then, several subsets are clustered at the same time to get several clustering centers. In order to well fuse the detection data of the wireless sensor network and make the obtained estimated values match the actual values more closely to achieve the purpose of high accuracy and high reliability state estimation, the Mann-Kendall test is introduced to compress the data in order to reduce the data communication. Using the Mann-Kendall test, the annual rainfall in the watershed was tested for abrupt changes and the annual rainfall Mann-Kendall curve was plotted. Kendall’s statistic curve is shown in Figure 6.
However, the data collection and transmission probability control for multilayer networks and the decision mechanism to maintain the stability of the system become the bottleneck problem of network big data integration. So the flash flood disaster prediction and early warning system carries out simulation prediction and comprehensive research and judgment by establishing mathematical models for various types of disasters. It uses 2D and 3D visualization to present the results and determine the current warning level and hazard level of the event. And according to the simulation prediction and comprehensive research and judgment results to predict the secondary and derived from the disaster, the scope of influence, consequences, and risk of flash flood disaster are assessed. When there is a large variation of water flow along the course (such as the existence of bottom slope), the calculation of the nonflush term is more complicated and may bring considerable errors. Therefore, the amount of regulation of each flood control means should be allocated and the prediction results should be obtained by computer algorithm. Other objective functions can also be used as criteria to evaluate the error, such as annual runoff and surface water flow process, although not as objective as the flow process line, but its advantage is that it only reflects local factors, such as only reflecting the production of flow and has nothing to do with the confluence. The higher the elevation of the region and the larger the standard deviation of elevation represent, the easier the drainage of the region and the less likely to have waterlogging and flooding, according to which the influence degree distribution under the combined effect of elevation and standard deviation of elevation is obtained, as shown in Table 1 below.
| Elevation and elevation standard deviation | 0-5 | 5-10 | >10 |
|---|---|---|---|
| 0-20 | 0.772 | 0.567 | 0.417 |
| 20-40 | 0.651 | 0.437 | 0.393 |
| 40-60 | 0.578 | 0.329 | 0.377 |
Finally, the process line is the total result of the whole process of flow production and convergence, which can be used as an optimization criterion and can also be called overall optimization. To determine whether the sum of the cluster centers is less than the scale threshold of the data fusion problem, if the result is yes, then the number of data is the value obtained from the sum of the data clustering centers is clustered and the resulting categories are fused to complete the distributed data fusion. In the case that the sum of squared residuals of all measured values is minimized, the arithmetic mean is considered as the most reliable value to complete the estimation of the actual value. If the rapid flow is influenced by the upstream flow pattern only, while the slow flow is influenced by both upstream and downstream flow patterns, this can be achieved by taking the difference backward along the feature. When solving the criterion weights of the influencing factors relative to the total study content, it is necessary to solve the relative weights of the same level factor judgment matrix for the factors at the previous level first.
3.2. Calculation and Analysis of Order Weight
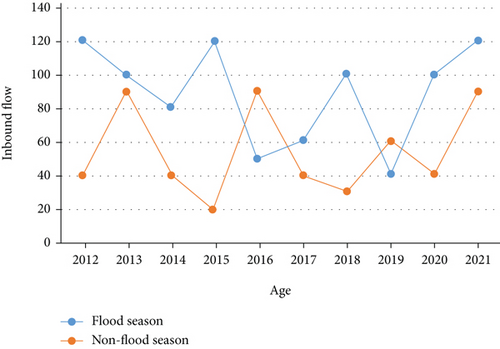
In the study of flood risk evaluation based on ordered weighted averaging, when decision-makers are more pessimistic, the lower the importance of the sequential layers, the higher the weight they are assigned, and the evaluation results show the least important attributes of the indicators. A two-by-two comparison of factors at each level compares their importance to the study content and is represented by numerical values. In order to study the change process of incoming flow in flood and nonflood periods, the information of incoming flow in flood and nonflood periods from 2012 to 2021 was used to draw Figure 7.
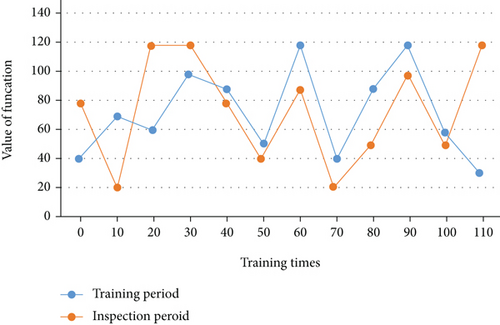
First, the problem is analyzed and studied. For the study of flood risk evaluation, it is necessary to classify and stratify the analysis of the influencing factors of flooding. Since the fluxes transported across the interface between control bodies are equal in size and opposite in direction for adjacent control bodies, the fluxes along all internal boundaries cancel each other for the whole calculation domain. Assuming the river as a channel, the relationship between the water level and the storage volume of each river section is found, and the change in water level and the rate of advance of the flood are obtained according to the relationship between the difference between the inlet and outlet of the tank storage theory and the constant value of the increase and decrease of the tank storage volume. The data is normalized and passed to Keras, a deep learning framework, in a NumPy data structure, and the optimal clustering result is used to limit the region for generating cluster heads. Next, the LSTM framework structure is selected to determine the dimensionality of the input vector in terms of the eigenvalue dimension. Using the system field statistics function, the flooded area is counted and the total flooded area is output or recorded, and the results of the loss calculation corresponding to different eigenvalues are shown in Figure 8.
Secondly, the dominant or subordinate relationship between factors at the same level is analyzed, and the lower level factors are subordinate to and influence the lower level factors, and according to this rule, the recursive hierarchical structure model is established. The process of flow at the mouth is often high peaks, steep shapes, rapid and slow flow conversion, and water depth disparity, resulting in the classical format that often fails, requiring the use of a format based on completely shallow water equations and high resolution of discontinuity and the need to use a small time step; the explicit format is usually more favorable than the implicit format. It generalizes, abstracts, and simplifies the objective phenomena of nonconstant flow in open channels based on the basic principles of mass conservation law, Newton’s second law, and energy conservation to obtain this nonlinear hyperbolic system of partial differential equations. The output dimension of the LSTM cell window is selected to be 100, and the dense function is connected to compress the 100-dimensional output into 1-dimensional, and a suitable excitation function is selected to convert the final forecast results. After finishing the inundation state extraction, the area field is added to the vector file, the projection is set to equal area projection, and the area field is recalculated by using the system calculation geometry function. Calculate the presoil water content, deduce the real-time soil infiltration rate, derive the net rainfall process from the precipitation process, and analyze the influencing factors of river network storage in the basin. The data collected in the abnormal data rejection results are transmitted to the cluster head node to complete the distributed data intelligent fusion.
Finally, the eigenvectors of the maximum eigenvalue of the judgment matrix are normalized to the weights, after which the relative weights of the elements of the lowest level are multiplied by the relative weights of the elements of the upper level, which is the criterion weight of the final required elements. There are often some extremely shallow water areas in the flow field, the flow friction loss should be specially treated (because the water depth is zero when the friction ratio drop calculated by Manning’s formula tends to infinity), and the numerical solution is required not to produce false oscillations, so as to avoid calculation instability. Adjusting the values of decision risk coefficients, we can get the order weights under other decision risk coefficients, which are summarized in Table 2.
| Decision risk coefficient | V1 | V2 | V3 |
|---|---|---|---|
| α = 0.1 | 0.0001 | 0.0002 | 0.0003 |
| α = 0.2 | 0.0263 | 0.372 | 0.441 |
| α = 0.3 | 0.0341 | 0.382 | 0.458 |
The basic equations of nonconstant flow in open channels are formed by the continuous and momentum equations, and their corresponding functions elucidate the relationship between the flow elements and the process coordinates and time. The loss functions are selected as mean square error, mean absolute error, and root mean square error (MSE), followed by the Adam optimizer, and the flood process and flood volume in the study area are simulated using Python language programming, and the simulation results are compared with the measured information. Because the cluster head selection is random, the number of member nodes within the cluster varies from cluster to cluster, which will make the network of cluster head nodes with more member nodes consume more energy and lead to unbalanced network load and shorter survival period of network nodes after data fusion. Therefore, if you need to calculate the inundation depth and water volume, you can extract the boundary range of the water body that needs to calculate the water volume through the system and turn the water body boundary surface to line and line to scatter point.
4. Conclusions
With the rapid advancement of computer technology, the application of big data is getting more and more widespread attention. Big data analysis methods are new technologies and new methods based on the original calculation methods as well as mathematical models, which are constantly improved and updated. Flood risk uncertainty and multisource information fusion are a hot topic in current research; however, the causes affecting flood occurrence are complex, and the uncertainty of the objective world and human cognition reinforces the uncertainty in flood risk assessment. Big data fusion analysis can significantly improve data utilization and address the problems of high network energy consumption and short survival period of network nodes in current data fusion algorithms. The application of multiphysics field remote sensing big data fusion analysis to flood risk evaluation research better reflects the differences in risk attitudes of different decision-makers, because different decision-makers have different criteria for considering the importance of indicators, which is more in line with the actual situation of flood risk evaluation. The application of basin flood forecasting based on multiphysics field remote sensing big data fusion analysis to carry out operational normal monitoring of floods can complement the ground monitoring, forming a three-dimensional monitoring, which can provide data support for flood and drought disaster defense. It can also be connected to the flood control command system, as a part of the flood control command system, through cooperation with meteorology, hydrology, rivers, Skynet, and other departments to centralize the data through the server and the system to facilitate the relevant command decision-makers to grasp the data, timely planning, and timely release, to protect everyone’s life and property safety. On the other hand, the study did not analyze the relationship between the relevant factors. It is necessary to use artificial intelligence and other technical means to find a certain regularity. It makes the calculation speed faster, and the results obtained are closer to the measured values, which is of great benefit to guide the practical work.
Conflicts of Interest
The authors declare that they have no known competing financial interests or personal relationships that could have appeared to influence the work reported in this paper.
Acknowledgments
This work was supported by Hechi University Curriculum Model Reform Project: Research and Practice on Classroom Teaching Reform of “Advanced Mathematics” in Science and Engineering under the Training Mode of Applied Talents in Local Universities (No. 2015KTJY20); Guangxi Higher Education Reform Project: Research and Practice on Value Guidance of Infiltration Teaching Mode of “Mechanics” Course (No. 2021JGA302); National Natural Science Foundation of China: Boundedness and asymptotic behavior of stochastic, non-smooth and other complex differential equations (No. 11961021); and Natural Science Foundation of Guangxi Province: Existence and Dynamics of Solutions for Fractional Elliptic Equations (No. 2018GXNSFAA138140).
Open Research
Data Availability
The data used to support the findings of this study are available from the corresponding author upon request.


