Mechanical Properties and Micromorphology of Calcium Oxide Expansion Agent on River Sand/Machine-Made Sand Concrete
Abstract
Freeze-thaw damage is one of the main factors affecting the service life and durability of concrete. Optimizing the microscopic pore distribution of concrete is an effective measure to improve its frost resistance. This paper takes mixed sand (machine-made sand + river sand) concrete as the research object and analyzes the influence mechanism of different content of CaO expansion agent on the physical and mechanical properties and frost resistance of mixed sand concrete. Concrete samples with different calcium oxide contents (0%, 6%, 8%, and 10%) were prepared by mass substitution with fly ash. Early air content, slump, compressive strength testing, and other analysis methods are used to determine the physical and mechanical properties of river sand-manufactured sand concrete with different calcium oxide expansion agent blending ratios. Freeze-thaw cycles were observed under X-ray computed tomography, SEM, and EDS to explore the mechanical properties, porosity, and microstructures of the samples. The concrete air content increases, the porosity first decreases and then increases, and its compressive strength decreases as the mixing ratio of calcium oxide expansion agent increases, but the mixing ratio has little effect on the slump. When the content of calcium oxide in concrete is higher than 8%, the mass compressive strength and relative dynamic elastic modulus of concrete increase with the increase of substituting calcium oxide expansion agent. The cross section of the concrete sample is a two-dimensional plane before freezing-thawing, and the pore structure densified as CaO content increases. However, new cracks are generated in the sample with 10% expansion agent content. After 400 freezing-thawing cycles, 0% and 6% calcium oxide expansive samples have irregular three-dimensional structures with concave and convex, and many connected holes and penetrating cracks appear. There are a small number of disconnected void clusters in the section of the sample with 8% and 10% content. A large number of calcium hydroxide ((Ca(OH)2) crystals fill the pores and cracks and improve the frost resistance of concrete.
1. Introduction
The consumption of natural resources by engineering construction activities has severely affected many local natural ecologies. The necessity for concrete, the main material used for construction, bridge, underground space, and other engineered structures, has created an increasing demand for river sand materials. The exploitation of these materials has wreaked destruction on natural river ecologies, some beyond the point of no return.
Machine-made sand has emerged an alternative material for river sand and attracted the attention of scholars and industry professionals. River sand is commonly mixed with machine-made sand (mixed sand) to make concrete, but the resulting material is prone to microcracks after hardening [1–5]. Water and salt [6] substances enter the interior of concrete through the cracks and drive down the durability and service life of concrete through frost heave, electrochemical corrosion, and sulfate erosion [7–9]. The durability of concrete is related to the service life and service performance of the structure containing it, so these factors are a significant concern. Chemical corrosion and physical frost heave are particularly important in terms of concrete durability. The freeze-thaw cycle is an important environmental variable that affects the material degradation process. For concrete structures in mid-to-high latitude regions, freeze-thaw cycles must be carefully considered when studying the evolution of material durability.
The United States, Europe, Japan, and other countries have carried out in-depth research on concrete freeze-thaw damage [10–15]. Dempsey and Thompson [16] studied the influence of concrete mechanical properties in a freeze-thaw environment.
Yang et al. [17] analyzed the relationship between the number of freeze-thaw cycles, compressive strength, and relative dynamic elastic modulus through freeze-thaw cycle tests and assessed the internal structural damage of concrete. Shang and Song [18] found that the freeze-thaw process would destroy the microstructure of concrete, and the compressive strength of concrete gradually decreased [19, 20]. Yong [21] found that the microcracks in concrete will continue to expand during the later freeze-thaw test, which will adversely affect the frost resistance of concrete. After multiple cycles of freeze-thaw, the compressive strength and relative dynamic elastic modulus of concrete are greatly reduced due to internal cracking [22] plus a large number of small fragments [23], debris, and aggregates on the surface [24, 25]. Coussy and Monteiro [26] revealed that the frost heave stress inside concrete is related to pore density [17], solid matrix interface zone, temperature difference, and other factors. Joloust al. [27] used optical microscopes to study the cement-based failure morphology and the cracking of the matrix-aggregate interface after different freeze-thaw cycles. Valenza and Scherer [28] found that microcrack propagation of concrete widened and deepened as the number of freeze-thaw cycles increased. Obviously, freeze-thaw damage accelerates the migration of ions and moisture in concrete to the interior of the concrete [29]. Guo et al. [17] conducted the freeze-thaw test of concrete mixed with fly ash, fiber, MgO, SRA, etc., and different types of dosages can change the pore structure of concrete and improve the frost resistance of concrete, and the effect of fly ash + fiber mixture on the frost resistance of concrete works best. The frost resistance of concrete works best. De Graef et al. [30] used computer tomography (CT) to quantitatively analyze the distribution of pores and cracks in concrete under freeze-thaw cycles [31]. Kim et al. [32] combined scanning electron microscopy and CT to study the evolution characteristics of a concrete pore structure in a freeze-thaw environment and then determined the relationship between freeze-thaw times, pore changes, and mechanical properties.
Freeze-thaw damage in concrete is generally considered to be mainly caused by changes in the capillary crystal phase, where the liquid phase becomes solid and the volume increases to about 9% of the original. If the ice crystal stress exceeds the tensile strength of the concrete matrix, new microcracks are generated inside the concrete and radiate to the periphery of the matrix [33]. Water and corrosive ions enter the concrete through the cracks, aggravating the deterioration of the concrete. The above process must have two conditions: First, the concrete contains a certain amount of freezable water; second, concrete structures are in an alternating environment of positive and negative temperatures [34]. Wang et al. [35] found that the incorporation of polyvinyl alcohol (PVA) fiber and nano-SiO2 into concrete affects the workability and pore structure of concrete, thereby improving the frost resistance of concrete. An expansion agent can be mixed into concrete to make these changes [13].
When the amount of expansion agent is small, it basically has no effect on the internal structure of concrete. Excessive addition of expansion agent will cause expansion stress to be greater than the tensile strength of the matrix, resulting in new cracks in the concrete. A proper amount of expansion agent can optimize the internal pore structure of concrete, increase the density, and hinder the penetration rate of free water [36–38].The commonly used expansion agents are CSA (3CaO•Al2O3•3CaSO4•30-32H2O) and MgO(Mg(OH)2), which reacts to form AFt (ettringite) and MgO (magnesium hydroxide), respectively, to fill the pores and cracks in concrete. Though effective, CSA requires a large amount of water and has poor stability [39–41] and MgO expander has low early strength [42]. Compared with CSA and MgO expander, calcium oxide (CaO) expander has better stability, higher expansion efficiency, higher early strength, low temperature, and better humidity sensitivity [43, 44].
There have been relatively few studies on CaO expansion agent in terms of the early performance, compressive strength, relative dynamic elastic modulus, and microstructure of concrete. To the authors’ knowledge, there has been no previous study on the effect of CaO expansion agent on the physical and mechanical properties of river sand-manufactured sand concrete in freeze-thaw environments. In this study, the mass ratio of CaO expansion agent as a replacement for fly ash was used as the control index. The effects of different expansion agent contents (0%, 6%, 8%, and 10%) were investigated via scanning electron microscope (SEM) and X-ray diffraction in river sand-machine-made sand concrete before and after freezing and thawing. The mechanical parameters and microstructure changes were observed to determine the evolution mechanism of concrete durability under freeze-thaw cycles and to determine the optimal ratio of CaO expansion agent in river sand-machine-made sand concrete.
2. Materials and Test Methods
2.1. Materials
2.1.1. Cement
The cement used is P.O. 42.5 Portland cement. The chemical composition is shown in Table 1.
| Chemical composition | CaO | MgO | SiO2 | Fe2O3 | Al2O3 | SO3 |
|---|---|---|---|---|---|---|
| Content (%) | 91.3 | 1.26 | 2.72 | 3.16 | 1.28 | 0.43 |
2.1.2. Fly Ash and Mineral Powder
The fly ash adopts F-II-type fly ash and mineral powder. The technical indicators are shown in Table 2.
| Product model | 7d activity index (%) | Fineness (%) | Loss on ignition (%) | Water content (%) | SO3 (%) | CaO (%) | Cl− (%) | Density (g/cm3) |
|---|---|---|---|---|---|---|---|---|
| Class F fly ash | - | 22.8 | 5.11 | 0.2 | 0.7 | 0.1 | 0.05 | 1.7 |
| Slag powder | 7.2 | 22.5 | 0.84 | 0.2 | 0.9 | 0.05 | 2.82 |
2.1.3. Calcium Oxide Expansion Agent
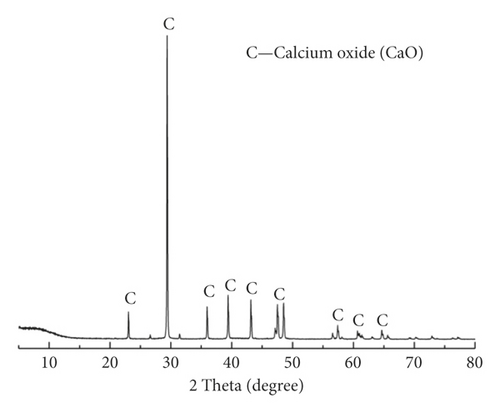
The CaO expansion agent adopts the CaO expansion agent SY-G Y type. The technical indicators are shown in Table 3, and XRD diffraction analysis is performed, as shown in Figure 1.
| Product model | Fineness (%) | Setting time (min) | Compressive strength (MPa) | Restrained expansion rate (%) | |||
|---|---|---|---|---|---|---|---|
| Initial set | Final set | 7 d | 28 d | Water (7 d) | Air (21 d) | ||
| Calcium oxide expander | 36 | 175 | 267 | 33.6 | 45.2 | 0.066 | 0.018 |
2.1.4. Natural Fine Aggregate and Coarse Aggregate
Crushed stone is coarse gravel processed and produced by Shaanxi Quarry, of which 2.5–5 mm and 5–10 mm particle sizes account for 10% and 90%, respectively; river sand and machine-made sand are natural river sand and gravel sand in Shaanxi (see Table 4 for indicators).
| Name | Mud content (%) | Apparent density (kg/m3) | Bulk density (kg/m3) | Porosity (%) | Moisture content (%) | Fineness modulus |
|---|---|---|---|---|---|---|
| Natural coarse aggregates | 0.3 | 2680 | 1535 | 42 | - | - |
| Natural fine aggregates | 1.6 | 2636 | 1550 | 41 | 7.4 | 2.5 |
| Mechanism-made sand | 2.0 | 2538 | 1548 | - | 6.8 | 3.2 |
2.2. The Mix Ratio of Different Contents of Concrete
The mixing ratio and number of river sand-machine-made sand concrete with different quality calcium oxide expansion agents instead of fly ash are shown in Table 5. In the table, C-0, C-6, C-8, and C-10 represent calcium oxide, respectively. The mass of expansion agent replaces 0%, 6%, 8%, and 10% of fly ash.
| Tested specimen | Mixing ratio | Expander (kg/m3) | Fly ash (kg/m3 | Mineral powder (kg/m3) | River sand (kg/m3) | Machine-made sand (kg/m3) | Water (kg/m3) | Cement (kg/m3) | Gravel (kg/m3) |
|---|---|---|---|---|---|---|---|---|---|
| C-0 | 0% CaO | 0 | 80 | 70 | 460 | 400 | 146 | 210 | 1060 |
| C-6 | 6% CaO | 21.6 | 58.4 | 70 | 460 | 400 | 146 | 210 | 1060 |
| C-8 | 8% CaO | 28.8 | 51.2 | 70 | 460 | 400 | 146 | 210 | 1060 |
| C-10 | 10% CaO | 36 | 44 | 70 | 460 | 400 | 146 | 210 | 1060 |
2.3. Making Concrete Samples
Different blending ratios (0%, 6%, 8%, and 10%) of CaO expansion agent river sand-machine-made sand concrete samples were produced in batches. Stone, river sand, machine-made sand, cement, fly ash, mineral powder, and CaO expansion agent were mixed in a mixer for 3 min, and then the admixture was evenly mixed with water and slowly poured into a blender for another 3-4 min of stirring. The mixer was stopped, the concrete was poured out of the mixer, and the air content of the concrete was measured with a CA3 fresh concrete gas content meter prior to slump testing. According to GB/T50080-2016 [45], 100 mm × 100 mm × 100 mm and 100 mm × 100 mm × 400 mm specimens were cut; after standing for 24 h, it was demolded with a pressure air gun and then moved to a standard curing room (temperature 20 + 2°C, humidity 95%) for 28 days. After 4 days, all samples were immersed in water at a temperature of 20 ± 2°C. The water surface was kept 20–30 mm above the top of the sample to ensure that the concrete sample was saturated before freezing and thawing.
2.4. Test Method
2.4.1. Slump Test
- (1)
The test concrete was poured from the mixer onto a wet steel plate ground and then evenly loaded in three sections into a bucket with a small spatula and tamped 25 times with a rod from the outside to the center over an even distribution. After tamping, the height of each layer was about one-third of the cylinder height. After the last layer of tamping was completed, the excess concrete was scraped off and the surface was smoothed with a spatula.
- (2)
The remaining concrete slurry around the bottom of the cylinder was removed, and then the slump cylinder was lifted vertically and steadily within 5 to 10 s. The time from concrete loading to testing was restricted within 150 s.
- (3)
After lifting the collapse cylinder, the highest point of the concrete sample was measured with a ruler after the top of the cylinder had collapsed.
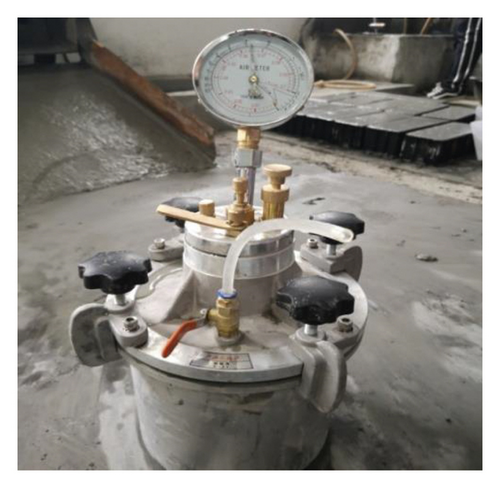
2.4.2. Gas Content Test
- (1)
Before the test, the inner surface of the container and the lid were cleaned with a wet rag. The concrete sample was loaded in three portions and tamped with a rod 25 times evenly each time. Finally, it was tamped 10 to 15 times along the outer wall of the container to fill up the sample holder. A scraper was used to flatten the surface, and then the bolts were capped and tightened.
- (2)
The operating valve and exhaust valve were closed, and then the drain valve and refill valve were opened. Water was poured into the container through the water filling valve. The exhaust valve was closed once there was no bubbling water coming from it, and then the air inlet valve was opened and pressurized with an inflator. When the gauge pressure was slightly greater than 0.1 MPa, the exhaust valve was used to adjust the pressure to 0.1 MPa and closed.
- (3)
The pressure balance valve stem was pressed 2-3 times, and then the circumference of the measuring bowl was tapped with a wooden hammer. The pressure balance valve stem was pressed again. After the pressure gauge pointer stabilized, the measured air content of the concrete mixture sample value was read and recorded.
2.4.3. Freeze-Thaw Cycle Test
- (1)
After the sample age reached 28 days, it was taken out of the water tank and wiped with a damp cloth to remove surface moisture. Four pieces of 100 mm × 100 mm×100 mm or one piece of 100 mm × 100 mm×400 mm was placed into each 115 mm × 115 mm×500 mm rubber sample box. A 100 mm × 100 mm×400 mm sample was placed in the center of the freeze-thaw box, then the test piece box was placed into the test piece rack in the freeze-thaw box, and clean water was poured into it until reaching a level of at least 100 mm above the top of the sample.
- (2)
A 12 mm hole was drilled with an electric hammer into the center of the sample in the freeze-thaw box, and then a temperature sensor was inserted to measure the center temperature. Two thermometers were inserted into the sample box around the freeze-thaw box to measure the antifreeze temperature as well.
- (3)
The height of the antifreeze liquid in the freeze-thaw box was adjusted to ensure it was higher than the sample. A gap of more than 200 mm between the sample boxes was also maintained so that the antifreeze in the freeze-thaw box could flow smoothly.
- (4)
During the freezing and thawing process, the minimum and maximum temperature in the center of the sample were set to -18 ± 2 °C and 5 ± 2 °C, respectively. Each freezing and thawing cycle was completed within 2–4 h, and the thawing time was not less than 1/4 of the entire freeze-thaw time.
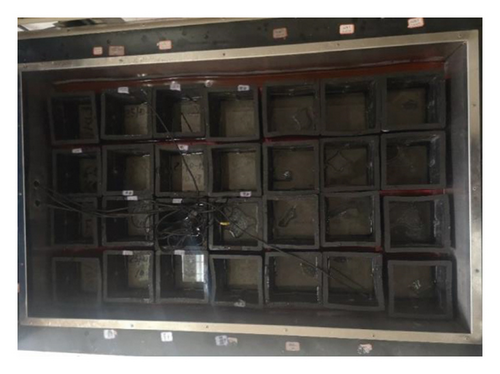
A total of 400 freeze-thaw cycles were performed. After each freezing-thawing 25 times, the sample was taken out and the surface moisture was wiped with a wet cloth. The size, quality, dynamic elastic modulus, scanning electron microscopy, and XRD analysis of the concrete sample were determined. The compressive strength was tested after 50 cycles. Scanning electron microscopy and XRD diffraction analysis were conducted before freezing and thawing and after 400 cycles of freezing and thawing.
2.4.4. Determination of Relative Dynamic Modulus
- (1)
After every 25 freeze-thaw cycles, 100 mm × 100 mm×400 mm sample was removed from the freeze-thaw box, and then its surface moisture was wiped off with a damp cloth before weighing it.
- (2)
The sample was placed on a rubber pad with two rubber pads on both sides of the 1/4 long side, and then a sensor was placed in the middle of the sample.
- (3)
The instrument was turned on and used to measure the length, width, and quality of the sample over a frequency range of 1000–3000 Hz. Until the data stabilizes, the dynamic elastic modulus value was read at three different positions, and then the values were averaged.
2.4.5. Scanning Electron Microscopy
- (1)
Take concrete samples of different CaO expansion agents before freezing and thawing and after 400 times of freezing and thawing and place them in an oven set at 45 °C for 48 h and close the oven for natural cooling.
- (2)
The concrete sample was broken with a hammer, and a mortar test block about 6 mm in size was removed.
- (3)
The mortar sample was immersed in absolute ethanol for 6 h and then placed in a KQ-300VDE dual-frequency numerical control ultrasonic cleaner for 30 min. After cleaning, the sample was taken out, placed in a clean beaker, and baked in an oven at 45 °C for 24 h.
- (4)
The mortar sample was fixed to the electron microscope round table with conductive tape, and then anion sputtering apparatus was used to spray it with platinum to increase its conductivity.
- (5)
EDS elemental analysis was performed on any suspicious components to qualitatively evaluate the material composition of the mortar sample.
2.4.6. X-Ray Diffraction
- (1)
The samples were placed in an oven set at 45 °C for 48 h and then left in the closed oven to cool naturally.
- (2)
An electric hammer was used to drill the powder at the depth of 0–10 mm on the non-forming surface, and then larger particles were filtered out with a 0.075 mm sieve.
- (3)
The concrete powder with different mass expansion agent was placed on the scanning table, and the X-ray diffraction equipment parameters were designed. The voltage was 40 kV, the surface velocity was 50/min, the minimum current was 100 mA, and the scanning angle was 5-80°.
2.4.7. X-Ray Computer Tomography
- (1)
After freezing and thawing 0, 100, 200, 300, and 400 times, the same concrete sample was scanned by X-ray computed tomography. Before scanning, the sample was placed in the oven with the temperature set at 45°C for 48 h, and the oven was closed for natural cooling. Before scanning, the sample was placed in an oven with a temperature of 45°C for 48 h and the oven was allowed to cool down naturally.
- (2)
A brush was used to remove fine sand particles from sample surfaces to reduce damage to the scanner.
- (3)
When using X-ray computed tomography scanner each time, voltage 120 kV, current 300 mA, scanning thickness 0.6 mm, interval 0.6 mm are set.
- (4)
Finally, AVIZO9.0.1 software was used to further process the collected images and sample porosity under the action of F-T analyzed using the resulting three-dimensional (3D) display of contour morphology. Through image enhancement, denoising, and threshold cutting, further image processing was realized. The influence of AVIZO9.0.1 software on the data was reduced by setting the intensity range at 0–2320 and colormap at 0–3547.
- (5)
Concrete porosity was calculated according to
3. Results and Discussion
3.1. Early-Age Test of Calcium Oxide Expansion Agent Concrete
3.1.1. Changes in Air Content and Slump of Calcium Oxide Expansion Agent Concrete
Figure 4 shows the air content and slump of freshly mixed river sand-machine-made sand concrete as they vary with the content of CaO expansion agent. The character “C” in the symbols C-0, C-6, C-8, and C-10 in the figure indicates concrete, as mentioned above. The numbers 0, 6, 8, and 10 indicate that the mass blending ratio of CaO expansion agent as a replacement for fly ash is 0%, 6%, 8%, and 10%, respectively.
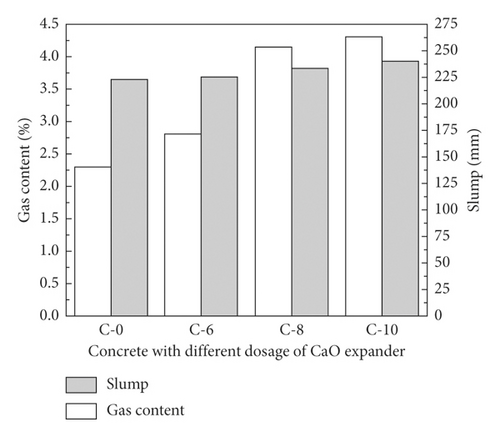
As shown in Figure 4, the content of CaO expansion agent has relatively little effect on the slump of the concrete. The air content of the concrete gradually increases as the amount of CaO expansion agent increases. The slump and air content of C-6, C-8, and C-10 concrete are about 1.009, 1.045, and 1.076 times, which are 1.217, 1.804, and 1.869 times that of the C-0 benchmark concrete, respectively. As the amount of CaO expansion agent increases, the air content and slump of concrete gradually increase. This is likely because the CaO expansion agent hydration consumes less water than fly ash, which increases the fluidity of the concrete. Calcium hydroxide (Ca(OH)2), the product of CaO expansion agent and water, may produce extrusion stress on the cement matrix, changing the diameter and number of pores, thus affecting the air content of the concrete.
3.1.2. Changes in Compressive Strength of Concrete with Calcium Oxide Expansion Agent
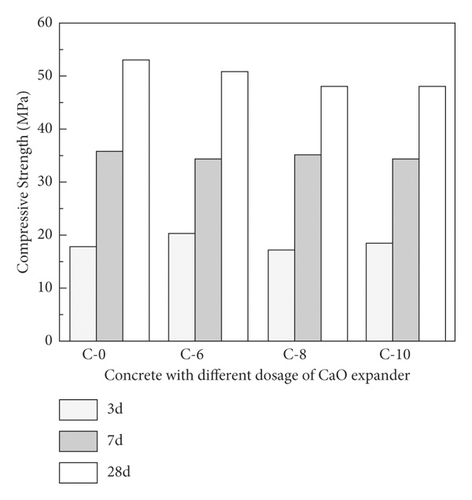
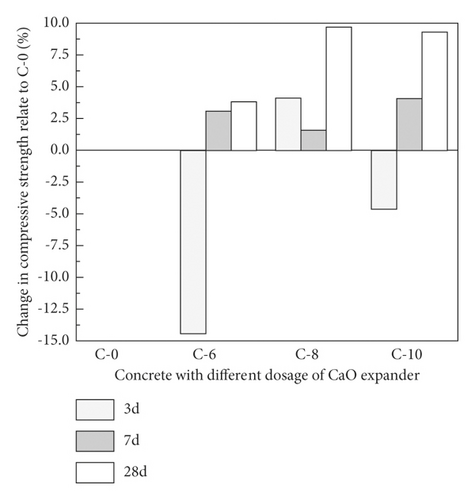
After curing for 3 days and 7 days, there is little change in the early compressive strength of concrete with different amounts of CaO expansion agent. The compressive strengths of the C-0, C-6, C-8, and C-10 concrete samples on the 3th and 7th days were 17.6 MPa, 20.2 MPa, 16.9 MPa, and 18.4 MPa and 35.5 MPa, 34.4 MPa, 34.9 MPa, and 34.05 MPa, respectively (>5%). The compressive strength is relatively low until the 7th day because the hydration rate of the cement in the initial curing stage is faster than that of the CaO expansion agent. The material at this point is mainly supported by the hydration product of cement, calcium silicate, which keeps the compressive strength relatively stable. The compressive strengths of C-0, C-6, C-8, and C-10 concrete samples on the 28th day are about 52.7 MPa, 50.7 MPa, 47.6 MPa, and 45.2 MPa, respectively. At this point, the compressive strength increases as the amount of CaO expansion agent gradually decreases. Compared with C-0 concrete, the compressive strength loss rate of C-6, C-8, and C-10 concrete is about 3.975%, 9.677%, and 9.259%, respectively. This may be due to the fact that the calcium oxide expansion agent replaces part of the fly ash, resulting in more tiny void cluster structures inside the concrete, increasing the concrete porosity. At the same time, the voids and cracks in the concrete are filled with fly ash particles into calcium hydroxide, a hydration product of calcium oxide. Because the overall compressive strength of Ca(OH)2 is lower than that of fly ash particles, the compressive strength of the concrete gradually decreases as the calcium expansion agent amount increases (Figure 5).
3.2. Freeze-Thaw Test of Calcium Oxide Expansion Agent Concrete
3.2.1. Weight Changes
As shown in Figure 6, before 100 freeze-thaw cycles, the quality of concrete with different mixing ratios of CaO expansion agent does not change significantly. The quality of the 10% sample concrete increases slightly between 100 times and 325 cycles as the loss of concrete quality gradually decreases. After 325 cycles, C-0 and C-6 concrete have higher quality than C-8 and C-10. After 400 freeze-thaw cycles, the concrete masses of C-0, C-6, C-8, and C-10 are approximately 0.909, 0.965, 0.99, and 0.989 times, respectively. The quality loss of concrete without CaO expansion agent is the largest, followed by C-6 concrete; theC-8 concrete has the smallest quality loss.
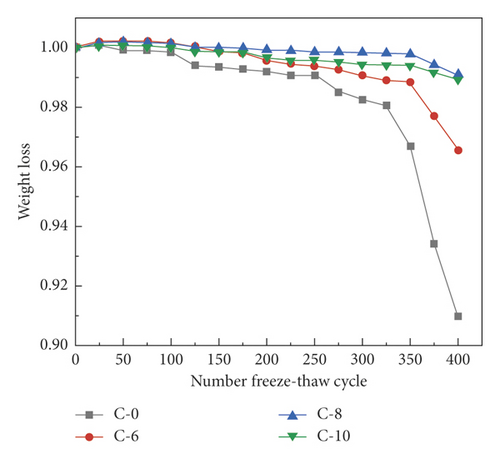
Before 100 freeze-thaw cycles, the free water around the concrete sample migrates into the concrete through its pores and cracks. The free water quality may be slightly greater than the surface loss of the sample, which creates a slight increase in the quality of the sample. Between 100 and 325 cycles, the surface mass loss of the concrete sample is greater than the mass of water migration and the concrete quality declines. As freezing and thawing continue, the mortar on the surface of the concrete sample falls off, resulting in varying degrees of interconnected voids from the surface and the inside of the sample [24]. Free water more easily enters the interior of the concrete, causing the frost heave stress generated inside the concrete sample to exceed the tensile strength of the concrete matrix, resulting in the complete peeling of the mortar from the surface of the concrete sample as the coarse aggregate from the corner of the sample falls off [27]. However, only a portion of the mortar peels off of the sample when it has 8% or 10% CaO expansion agent.
A proper amount of CaO expansion agent on the surface can reduce the quality loss of concrete to a certain extent. This may be due to the fact that Ca(OH)2, the product of CaO hydration, produces compressive stress on the cement matrix and the interface transition zone which fills the pores and cracks in the material, changing its pore structure while reducing the migration of moisture during the freezing and thawing process [25–27, 34]. This drives down the internal ice crystal stress and mitigates the quality loss in the concrete.
3.2.2. Dynamic Modulus of Elasticity
As shown in Figure 7, before 100 freeze-thaw cycles, there is relatively little loss of dynamic elastic modulus of concrete with different replacement amounts of CaO expansion agent. After 100 freeze-thaw cycles, the loss of dynamic elastic modulus of C-0 and C-6 concrete trends downward while the loss of C-8 and C-10 concrete is lower. After 400 freeze-thaw cycles, the relative dynamic elastic moduli of C-6, C-8, and C-10 expansion agent concrete samples are about 0.176, 0.939, and 0.926 times, respectively. The relative dynamic elastic modulus of CaO free expansion agent concrete after 325 freeze-thaw cycles is 0.180 times.
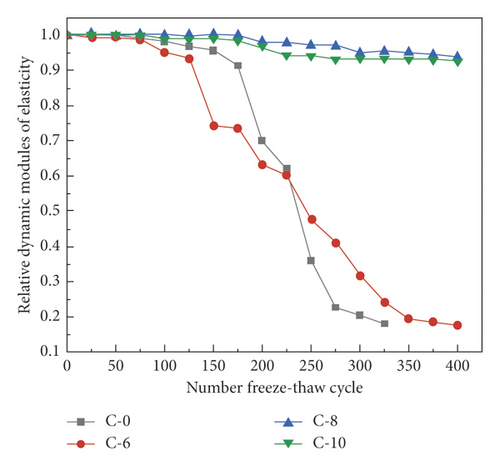
At the beginning of the freezing and thawing process, the damage caused by water to the concrete is mainly concentrated on the cement mortar layer on the surface; there is relatively little relative dynamic elastic modulus loss. As freezing and thawing continue, the concrete expands from the surface to the inside to produce interconnected cracks and pores [13, 34, 35]. Water is then more likely to migrate into the concrete and frost heave stress may increase. When the frost heave stress is greater than the tensile strength of the base, cracks may occur inside the specimen which drive down the relative dynamic elastic modulus. In C-8 and C-10 samples, the CaO hydration product refines the concrete pores and evenly distributes them inside the concrete, reducing the original defects in the transition zone of the concrete interface without the expansion agent [38, 39]. The frost stress in the concrete diffuses to the closer pores during the freezing and thawing process, weakening the damage otherwise caused by frost.
3.2.3. Compressive Strength
As shown in Figure 8, before 150 freeze-thaw cycles, the compressive strength loss of C-0 and C-6 concrete is relatively low and the compressive strength loss of C-8 and C-10 concrete basically does not change. After 150 freeze-thaw cycles, the compressive strength loss of C-0 and C-6 concrete decreases approximately linearly while the loss of C-8 and C-10 concrete is relatively low. After 400 freeze-thaw cycles, the compressive strengths of C-0, C-6, C-8, and C-10 samples are about 0.511, 0.55, 0.920, and 0.902 times, respectively. The loss of compressive strength in C-0 and C-6 is the most serious and the compressive strength of C-8 and C-10 concrete is relatively stable.
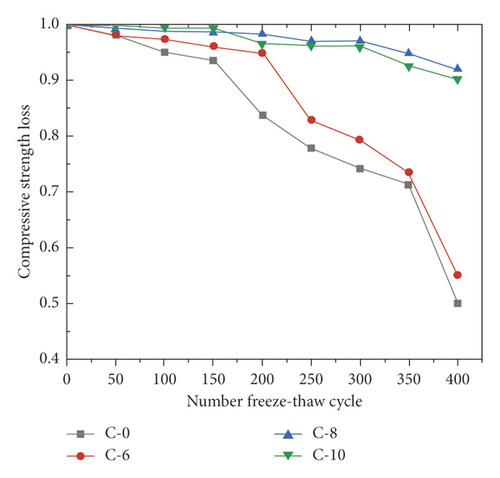
Concrete compressive strength fails due to slippage of the interface transition zone between the cement base and the coarse aggregate [7, 18, 20–23]. During the freeze-thaw process, as water migrates into the concrete through pores and cracks, frost expansion stress damages the low-strength interface transition zone in the concrete and accelerates its deterioration rate. The Ca(OH)2 hydrated product affects the concrete matrix; extrusion stress is generated in the interface transition zone which reduces the internal pore diameter of the concrete and increases its compactness, thereby improving its frost resistance. The change law of the compressive strength of concrete with different expansion agents is similar to the change law of the relative dynamic elastic modulus.
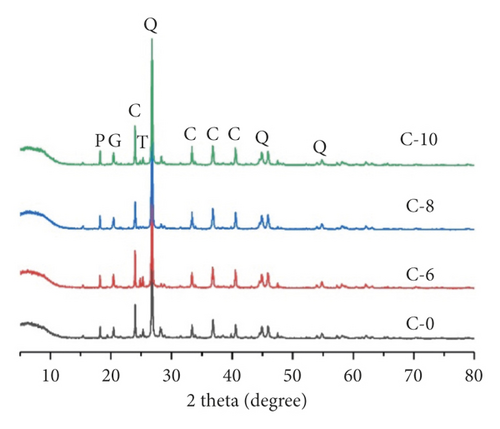
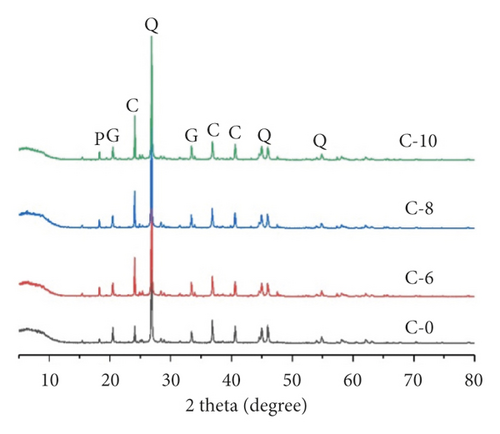
3.2.4. X-Ray Diffraction Analysis of Different Dosage Calcium Oxide Expander Concrete
As shown in Figure 9, the concrete composition is basically the same after freezing and thawing 0 and 400 times; it is mainly calcium hydroxide (Ca(OH)2), calcite, gypsum(CaSO4), and thaumasite. The diffraction intensity of related components after 400 freeze-thaw cycles is weak, indicating that the internal skeleton of the concrete has been lost. The most significant loss is calcium carbonate (CaCO3). Figure 10 shows that the diffraction intensity of Ca(OH)2 in the concrete gradually increases as the CaO content increases. After 400 freeze-thaw cycles, the Ca(OH)2 peak intensity of concrete with different CaO expansion agents gradually decreases, especially in the C-0 sample, where it basically disappeared. The presence of Ca(OH)2 again appears to increase the compressive strength and dynamic elastic modulus of the concrete to a certain extent.

3.2.5. X-Ray Computed Tomography Analysis
Concrete is a heterogeneous multiphase composite material, and its deterioration characteristics from F-T damage are closely related to its porosity. The effects of different blending ratios of CaO expansion agent on the appearance profile, pore density, and porosity of concrete were examined under the action of F-T cycles. These tests used CT to examine and produce a 3D rendering and pore analysis of sample cubes of concrete with different blending ratios of CaO expansion agent after various numbers of F-T cycles (as above).
The 3D rendering contours of river sand/machine-made sand concrete with different mixing ratios of CaO expansion agent after 0, 100, 200, 300, and 400 F-T cycles are shown in Figures 10-13. The gray color indicates cement mortar, and the white color indicates coarse aggregate. Before F-T treatment, concrete surfaces were relatively flat and smooth, with only a small amount of fine pore structure. By 100 F-T cycles, the surfaces of all specimens did not suffer clear erosion, as F-T erosion exerted a low degree of deterioration on these surfaces. After 200 F-T cycles, the number of pores on C-0 and C-6 surfaces gradually increased and jagged structures appeared around them, while the number of surface pores of C-8 and C-10 samples mainly increased and became larger. After 300 cycles, C-0 and C-6 surfaces were clearly eroded and deblocking phenomena occurred around them. At the same time, a large amount of exposed aggregate was visible on these surfaces. However, the C-10 surface showed mortar shedding and coarse aggregate exposure, with a small amount of aggregate sloughing around it. In contrast, no exposed aggregates were observed around the C-8 sample, while more and clear pore structures were present on the surface. The evolution of the 3D renderings of concrete with different blending ratios of CaO expansion agent was seen to be basically consistent with quality loss of the concrete, which further explained the correlation between concrete quality loss and appearance, again verifying the effects of F-T erosion. The damage of the outer concrete gradually migrated from the outside to inside.


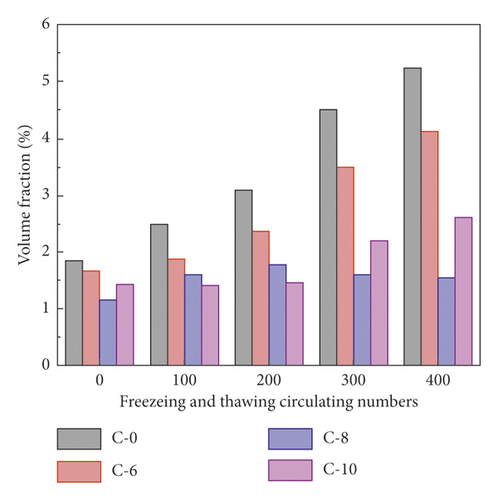
The cubic pore diagrams of river sand/machine-made sand concrete with different blending ratios of CaO after 0, 100, 200, 300, and 400 F-T cycles are shown in Figures 14-17. Before F-T treatment, the densities of C-0 and C-6 samples were higher than those of C-8 and C-10 samples. The pore densities of C-0, C-6, and C-10 samples increased significantly with increased F-T cycles, while the pore density of the C-8 sample was found to first increase and then decrease with further increased F-T cycles. The pore density of the C-8 sample was more significant with 200 cycles, which showed that hydration products and expansion stress, produced by the proper mixing ratio of the expansion agent, reduced concrete porosity and improved its frost resistance. Sample pore density was easily found to be basically consistent with changes in the 3D rendered contour map. This showed that F-T erosion had a certain relationship with concrete pore density regarding the deterioration of concrete frost resistance.


Examination of the effects of CaO expansion agent, blended in different ratios, on concrete porosity under an F-T environment showed that, before F-T treatment, the porosities of C-6, C-8, and C-10 were 0.911, 0.628, and 0.785 times that of C-0, respectively (Figure 18). The content of expansion agent content first decreased and then increased porosity, with C-8 sample porosity being the lowest. With increased F-T cycles, concrete porosity was mainly divided into two stages: slow and fast increase stages. Before 200 F-T cycles, the porosity of C-0, C-6, C-8, and C-10 increased slowly with increased cycles and the porosity of C-0, C-6, C-8, and C-10 was ∼3.101, 2.359, 1.764, and 1.43%, respectively. After 200 cycles, the porosity growth rates of C-0 and C-6 were significantly higher than those of C-8 and C-10, showing a rapid growth trend, while C-8 showed a downward trend. In this stage, frost heave stress generated by free water caused new pores and cracks in the concrete. At the same time, the mortar layer and aggregate on the outer sample surface fell off, which caused the overall sample volume to decrease and sample porosity to increase rapidly. After 400 cycles, the porosities of C-0, C-6, C-8, and C-10 samples were 2.856, 2.47, 1.343, and 1.819 times those from before F-T treatment, respectively, which indicated that C-8 samples were in a F-T environment, with porosity having the smallest change. After 400 cycles, the porosity of samples C-0, C-6, C-8, and C-10 was 2.856, 2.47, 1.343, and 1.819 times the porosity before F-T treatment, respectively, indicating that the porosity of sample C-8 has the lowest change under freeze-thaw conditions. From 3D rendering contour maps, cube-pore maps, and porosity distribution maps in the F-T environment, it was concluded that as the replacement of fly ash by CaO expansion agent gradually increased, the hydration product Ca(OH)2 in the concrete gradually increased before F-T. At this time, the hydration product generated compressive stress on the cement base and the interface transition zones and filled the larger pore structures, forcing large pores to gradually transition to small pores, thus reducing the density and porosity of the concrete. Under the action of F-T erosion, concrete containing CaO effectively hindered the speed of external water migration into the concrete, reduced damage to the concrete from ice crystal stress, decreased concrete porosity changes, and improved concrete frost resistance. This mainly showed that the deterioration rate of mechanical properties (compressive strength, relative dynamic, and elastic modulus) was relatively slow. However, expansion stresses generated by excessively high CaO content might far exceed the tensile strength of the matrix, resulting in new microcracks and pores in the concrete, thus increasing concrete density and increasing porosity. At this time, free water in the F-T environment more easily migrated into the concrete interior, accompanied by higher ice crystal stress with freezing, thus reducing frost resistance. In the F-T environment, frost resistance and service life of concrete increased with increased CaO blending ratio, but the excessively high CaO produced local stresses that can damage the matrix and generate new cracks and pores, which cannot enhance the durability of concrete.
3.2.6. SEM and EDS Analysis
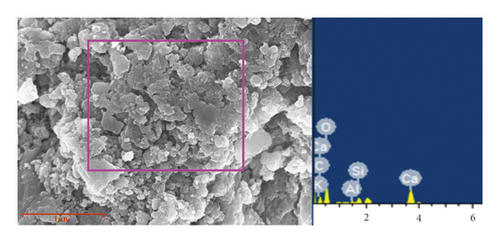
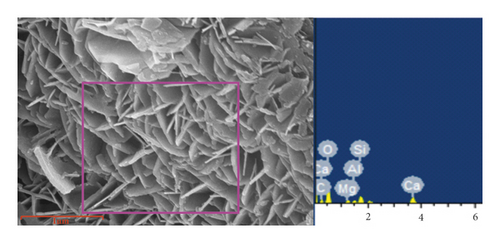
SEM tests were carried out on the concrete samples with 0 and 400 freeze-thaw cycles to further explore the antifreezing mechanism. The test was first conducted at high magnification, and then the magnification was gradually reduced as the observation object was held in the field of view. Figures 19–26 show microstructure diagrams with 1000, 5000, 10000, and 50000 magnifications. The structural components of the samples were also obtained via EDS analysis; the insets in Figures 19–26 are larger images of the corresponding SEM images.


As shown in Figures 19, 21, 23, and 25, the cross section of the concrete sample before freezing and thawing presents gentle two-dimensional (2D) structural features. There are some single-hole and disconnected clusters in the C-0 and C-6 concrete samples. There are clusters of voids with a smaller equivalent aperture and some cracks in the C-10 sample concrete. After 400 freeze-thaw cycles, the cross sections of C-0 and C-6 concrete specimens show irregular and uneven 3D structures. The integrity of the specimens has declined, and there are many small cracks and granulations. The integrity and flatness of C-8 and C-10 are improved compared with C-0 and C-6 samples. The C-8 concrete is still a complete section after 400 freezing and thawing cycles.
As shown in Figures 20, 22, 24, and 26, the sample cross sections show different pore structures as the replacement amount of CaO expansion agent increases. After the C-0 sample concrete freezes and thaws 400 times, the concrete fracture transitions from a brittle, flower-shaped fracture to a ductile dimple; there is no brittle failure at this point. Clusters of disconnected voids in the concrete section basically disappear while the connection of voids and cracks increases [33, 34]. The skeleton around the holes is needle-like or flake-like, which makes the surface of the concrete fracture composed of flakes form a 3D fracture surface, decreasing the strength of the concrete.
The energy spectrum of the flake-like particles is shown in Figure 27. The main constituent elements are calcium, carbon, and oxygen; the flake-like particles are CaCO3 crystals. A large number of flaky structures were found in the fractures of the C-6, C-8, and C-10 samples. The energy spectrum of the flakes is shown in Figure 28. The main constituent elements are calcium, carbon, and oxygen; the flakes are Ca(OH)2crystals. Before freezing and thawing, the fractures of concrete with different CaO expansion agents were basically brittle and flower-like. There were a large number of disconnected small cavities [29–31] in the fractures of C-8 and C-10 samples with a large amount of Ca(OH)2 and CaCO3 skeletons. The denser microstructure blocks the path of water infiltration, so there is no large frost heave stress inside the test blocks, thereby reducing the damage to the surrounding concrete matrix due to freezing and thawing. After 400 freeze-thaw cycles, there are a large number of brittle layered patterns in the fracture of the C-8 and C-10 samples. A small part of the ductile dimple fracture morphology persists. Many interwoven calcium hydroxide skeletons in the pores and cracks improve the compressive strength of the concrete compared with that without CaO expansion agent.
4. Conclusion
- (1)
The air content of the concrete gradually increases, its porosity decreases first and then increases, and compressive strength gradually decreases as the amount of CaO expansion agent increases, but the amount of expansion agent has only a small effect on the slump.
- (2)
In a freeze-thaw environment, an increase of the expansion agent content causes the compressive strength and relative dynamic elastic modulus loss of the concrete to decrease. The frost resistance of concrete is optimal when CaO expansion agent replaces fly ash at 8% by mass.
- (3)
As the replacement amount of CaO expansion agent increases, the amount of calcium hydroxide generated in the concrete pores gradually increases and fills the pores and cracks. This increases the compactness of the concrete while decreasing the number of pores. However, new cracks are generated in the concrete at a replacement rate of 10%. This may be because the expansion stress of the calcium hydroxide product exceeds the tensile strength of the matrix, which increases the porosity of the concrete. At this time, the frost resistance of concrete decreases again. When the expansion stress exceeds the tensile strength of the matrix, new cracks are generated and the frost resistance of the concrete is reduced.
- (4)
Between 0 and 400 freeze-thaw cycles, the cross section of the concrete sample transitions from a flat 2D to an irregular 3D structure. The integrity of the sample is damaged at this point with a replacement rate of 8%. The concrete cross section is essentially a 2D structure.
Conflicts of Interest
The authors declare that they have no conflicts of interest.
Authors’ Contributions
Feng Wei and Fei Zhang were responsible for conceptualization, review and editing, validation, and funding acquisition. Fei Zhang was responsible for methodology, resources, and project administration. Feng Wei was responsible for data curation, original draft preparation, visualization, and supervision. Li Gao and Rui Wang were responsible for formal analysis. Xiang Ren and Dan Zhang were responsible for investigation. All authors have read and agreed to the published version of the manuscript.
Acknowledgments
This research was financially supported by the Department of Education of Shaanxi Province (20JK1019), Yulin Science and Technology Bureau (2019-85-3), Shaanxi Provincial Department of Science and Technology (2020JM-626), and Shaanxi Province Science and Technology Resources Open Sharing Platform Project (2019PT-18).
Open Research
Data Availability
All data supporting the conclusions of this study are included in this article.


