Reverse Cyclic Loading Effect on RCC Wall-Floor Slab-Deep Beam Connection
Abstract
High-rise structures are more vulnerable when subjected to lateral loading. Generally, the shear walls function as the main lateral load resistant system in high-rise structures. In the case of high-rise structures with an open ground story, the shear wall-floor slab-deep beam acts together as a rigid jointed frame connection to withstand gravity and lateral force induced by external loadings like earthquakes and wind. The wall-floor slab-deep beam connection will be subjected to a higher concentration of stresses, which is a more vulnerable area in any high-rise structure. Hence, it is necessary to design this connection with more ductility. This article presents the experimental investigations carried out to study the behavior of three different reinforcement detailing in RCC wall-floor slab-deep beam connections, such as (1) 90° bend up bars connection as per Indian Standard Code (Conventional connection), (2) U-hooks connecting the core region as per Euro code 2, and (3) proposed U-hooks with additional reinforcement in the core region transverse to the beam orientation. The additional reinforcement is provided at a distance of 50 mm from the face of the shear wall. The parameters considered for this study are load-carrying capacity, energy dissipation, ductility, and stiffness. The results were then compared with that of the conventional connection. It was found that the proposed U-hook with additional reinforcement performed better than that of the conventional connection and type 2 connection.
1. Introduction
A wide range of reinforced cement concrete high-rise buildings are emerging in developing countries like India and are very popular due to various advantages, like high Floor Space Index (FSI), economy, less noise, ventilation, and fresh air. A building between 50 and 250 m is generally defined as a tall building as per Indian standards [1]. The finest design of a tall building is an art and science, with the collective years of experience by the engineers, with techniques of stress analysis, structural design, and detailing, put to sensible use at the right time and place [2]. The forces induced by wind and earthquakes are challenging for the structural connections of tall buildings. In high-rise buildings, the function of the shear wall is to resist lateral loading [3]. The shear wall is connected with a beam and slab to increase the stiffness and reduce the torsion effects of the irregular shape (plan) of high-rise buildings [4]. The critical stresses in the joint of the structural elements during the vibration of the structure cause lateral sway of the building, reaching a point of discomfort to the occupants. In this structural form, the floor slabs act as diaphragms distributing the horizontal loads to the vertical shear wall [3]. Occasionally, shear walls are getting terminated at the ground floor roof level to create parking space on the ground floor. In such cases, the shear walls are terminated to deep transfer girders. The transfer girders are often introduced to transfer the loads from higher to lower zones and they are particularly vulnerable structural members under seismic loading [4]. Numerous research works are concentrated on the interaction among the effects of the transfer structures [4–11]. Few researchers focused on the behavior of shear wall-slab connection under lateral cyclic loading effects on out-of-plane and in-plane [12–16].
The transfer structures or idealized deep beams are shear members used to distribute the heavy loads from high to low zones in high-rise buildings. Compared with the transfer slab system, the transfer girder system is more flexible and creates less strain on vertical structural members, and lowers the base shear [17]. The reinforcement detailing of the transfer girder is very important to achieve its theoretical load transfer mechanism in the building to withstand the designed forces and avoid the failure of the girder due to improper curtailment or inadequate reinforcement detailing [18]. The external walls over the transferring structures or deep beams are particularly weak under lateral loads [19]. The shear distribution at the slab-wall junction is the essential force resistance element when subjected to significant stress concentration [13, 15]. Many studies have been carried out on strengthening shear wall-slab joint diaphragms with different structural irregularities. As per the recommendation of the American Concrete Institute, the reinforcement has to be extended toward the support with the required anchorage length to increase the stiffness of the connection. On the other hand, the British Standards recommended a U-hook at the joint with the required development length from the interface of a shear wall [20].
The present research article highlighted the extra stirrup, which can be provided at the joint core region for exhibiting a higher ultimate strength. It is also observed that the additional tension reinforcement spanning the spandrel beam enhances the strength of a slab-column connection to a certain extent.
2. Significance of Study
Even though the connection between RCC wall-floor slab-deep beam is a critical area in high-rise buildings subjected to lateral loads, only a few experimental investigations were conducted. The present research article concentrates on the performance of RCC wall-slab-deep beam connections subject to lateral loading with different reinforcement joint configurations such as 90° bend up bar (Conventional), U-hook, and U-hook with additional reinforcement.
3. Analysis and Design of Building
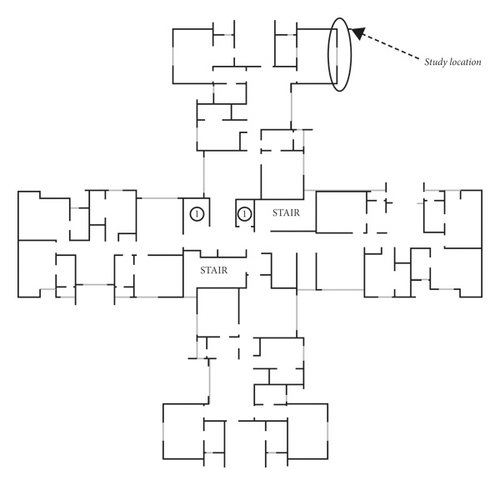
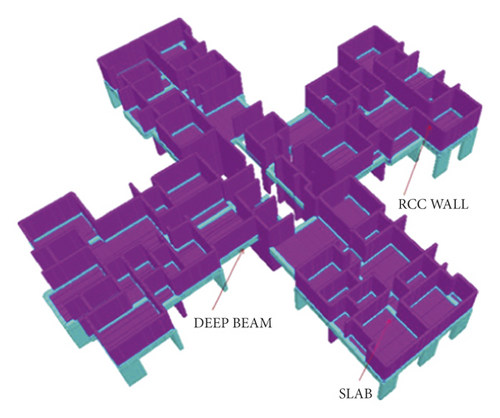
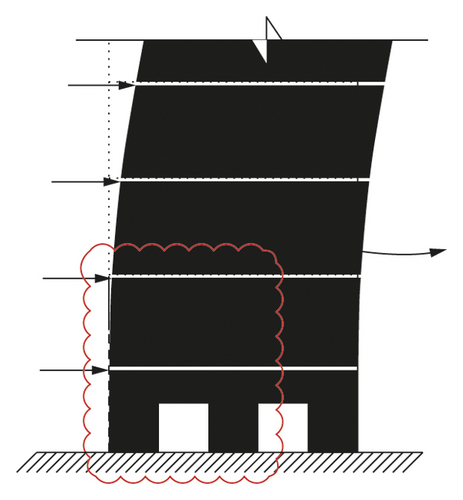
In this study, a critical connection in a high-rise structure has been considered. In order to arrive at the force resultant at the joint concerned, one typical high-rise building situated in Chennai was modeled and analyzed using Staad.pro. The building plan and 3D cross-sectional view of the building are shown in Figures 1 and 2. This structure consists of basement + stilt + 19 floors. The height of the basement floor is 6 m, the stilt floor is 3.5 m and the other floors are 2.9 m in height. The structure is hybrid in nature. The upper floors are constructed with a shear wall-slab system. The basement and stilt floor is with rigid frame system. The loadings from the upper floors were transferred to the stilt and then to the foundation through the transfer girders at the stilt floor roof level. The structure is located in Chennai (Seismic Zone III) and is resting on a medium soil profile. Seismic loading is also considered in the analysis of structure as per IS 1893:2016 [21]. The sub-assemblages were designed and detailed as per the guidelines IS 456:2000 [22], IS 1893:2016 [21], and IS 13920:1993 [23], respectively. The structure was analyzed for various load combinations and identified for the critical location (Figure 1). The force resultants at the critical location are provided in Table 1.
| Particulars | Value |
|---|---|
| Axial load (kN) | 6161.63 |
| Shear (kN) | 225.24 |
| Bending moment (kNm) | 463.225 |
The structural elements such as deep beam, shear wall, and slab were designed to resist the above force resultants. The designed cross-sectional details are given in Table 2. The specimens then modeled to the scale of 1:3 are shown in Table 3. The model is scaled-down as per Cauchy similitude law [24] and the reinforcements are reduced to (1/32 = 1/9) of design area of reinforcement [25]. The model properties are mentioned in Table 2.
| Elements | Particulars | Prototype (mm) | Model (mm) |
|---|---|---|---|
| Beam | Clear span | 1500 | 500 |
| Depth | 1000 | 335 | |
| Width | 300 | 100 | |
| Column | Height | 2500 | 875 |
| Length | 1500 | 500 | |
| Width | 300 | 100 | |
| Shear wall | Height | 2970 | 990 |
| Thickness | 200 | 70 | |
| Width | 4500 | 1500 | |
| Parameter | Conversion | Factor (no units) |
|---|---|---|
| Length scale factor (SL) | Prototype length/model length | 3 |
| Area scale factor (SA) | SL2 | 9 |
| Force scale factor (SF) | Sσ X SL2 | 9 |
| Moment scale factor (SM) | SF X SL | 27 |
3.1. Specimen Details
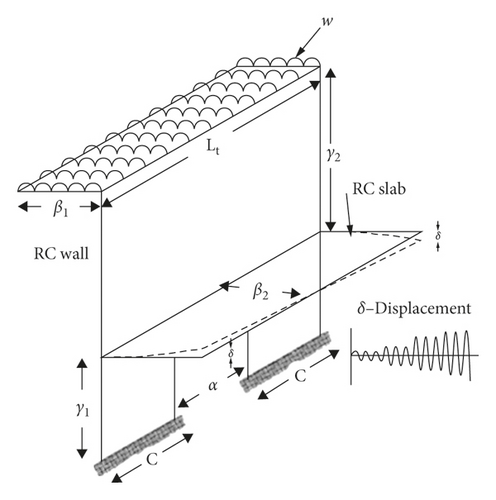
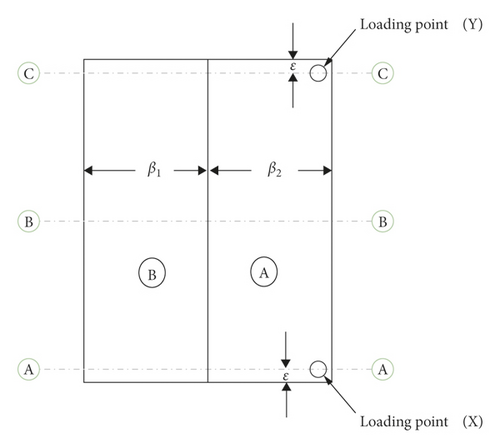
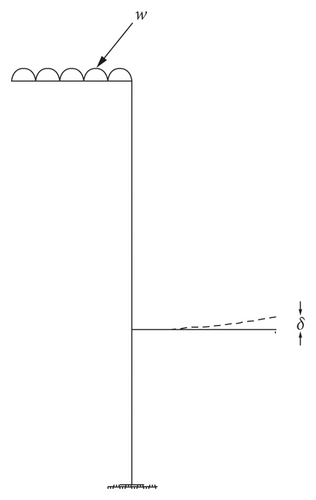
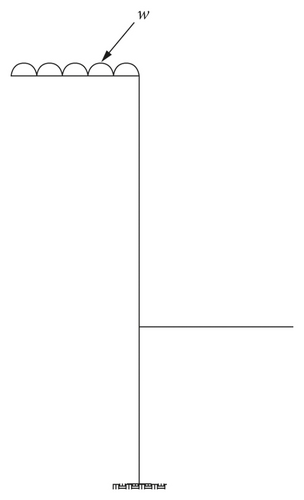
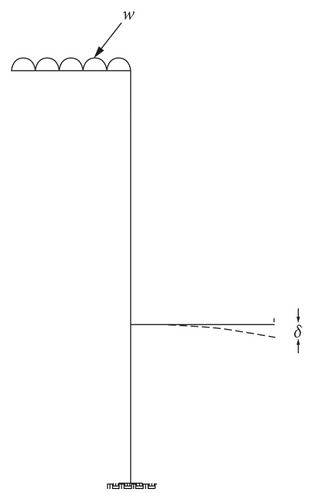
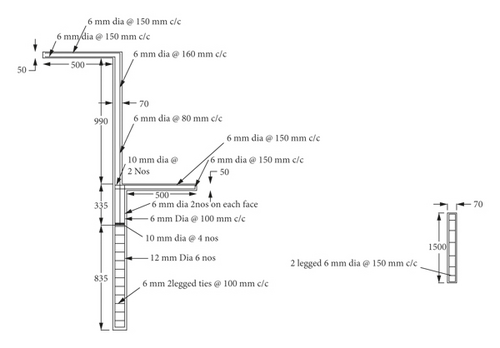
The scaled-down model specimens were tested at the laboratory and subjected to scaled-down force resultants. The axial load on the wall has been applied at the top by stacking concrete cubes. In order to simulate the out-of-plane bending moments in the shear wall, the cubes were arranged on a slab of 500 mm wide, cast on the top surface of the wall (Figure 3(a)). Figure 3(b) provides a clear view of the slab to be tested (Portion A) and the slab which carries the axial dead load (Portion B). The reverse cyclic loading was applied to the slab (Portion A). The in-plane loading protocol on the shear wall has been simulated by using a couple of forces at point ‘X’ and point ‘Y’ (Figure 3(b)) upward and downward. The sectional view through section A-A of Figure 3(b) shows the upward loading in the slab at A-A (Figure 3(c)). Similarly, section B-B shows the undeflected middle portion of the slab, whereas Figure 3(c) shows the upward loading of the slab while taking a section through C-C. The reversed cyclic loading was applied. The reinforcement detailing for the 1:3 scaled-down specimen is detailed in Figure 4. A typical sectional view of the wall-slab-deep beam connection is shown in Figure 4(a). The geometric detail of the specimen is provided in Table 4. The present study focuses on three different types of detailed patterns.
| Description | Notation | Dimension (mm) |
|---|---|---|
| Height of RC frame from bottom FS | γ1 | 1195 |
| Height of RC wall from FS to CS | γ2 | 955 |
| Projection of FS from deep beam | β1 | 535 |
| Projection of CS from top of shear wall | β2 | 550 |
| Width of opening | α | 500 |
| Depth of opening | γ3 | 835 |
| Length of the specimen (FS/CS) | Lt | 1500 |
| Half-length of the specimen excluding opening | C | 500 |
3.1.1. 90° Bent Bars (Type 1)
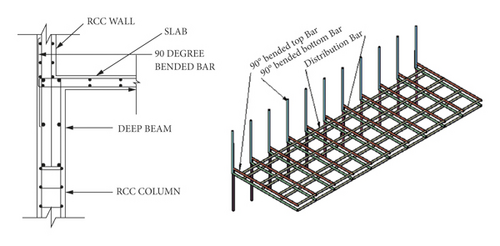
Type 1 connection is with 90° bent bars, as shown in Figure 4(b) The slab reinforcements were bent at 90° at the end of the wall and extended for a length equal to the anchorage length. The bottom bars of the slab were bent at 90° and stretched upward. Similarly, the top bars of the slab were bent at 90° and stretched downward.
3.1.2. U-Hook (Type 2)
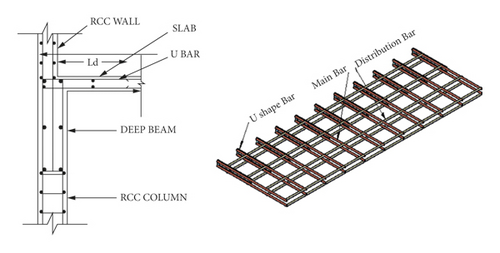
In type 2 detailing, an additional U-hook has been introduced in the joint region, as shown in Figure 4(c). The shear wall reinforcements were passed through the extended U-hook in the joint region, which provides lateral confinement for the shear wall reinforcement.
3.1.3. U-Hook with Additional Bar (Type 3)
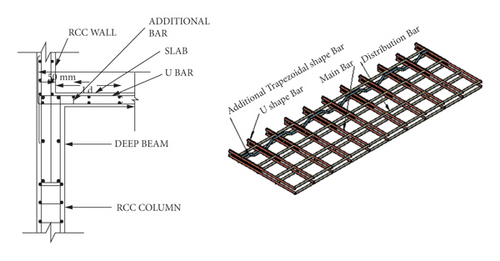
In these specimens, additional zigzag reinforcement has been provided at the interface of the wall and slab, as shown in Figure 4(d).
Typical reinforcement, 90° bent (Type 1), U-hook (Type 2), and U-hook with additional bar (Type 3) detailing is shown in Figures 4(a)–4(d), respectively.
4. Experimental Work
4.1. Specimen Preparation
The one-third scaled-down specimens were cast with Ordinary Portland Cement (53 grade) conforming to IS 12269-1987 [26], river sand passing through a 4.75 mm IS sieve and having a fineness modulus of 2.73 as fine aggregate. The crushed granite stone of maximum size not exceeding 10 mm and having a fineness modulus of 6.09 was used as coarse aggregate. The M30 grade concrete was used for casting the specimen. To improve the workability owing to the dense reinforcement configuration, a water-reducing admixture was also added to the potable water used to prepare the mix. The compressive strength of the cube on day 28 was 33 N/mm2. Steel rods with the stress of yield 415 N/mm2 were used as reinforcement. The specimens were cured adequately at the laboratory.
4.2. Experimental Setup
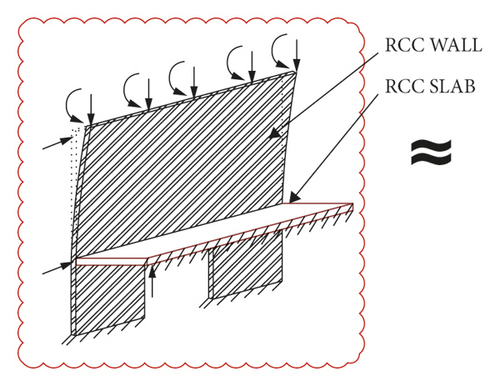
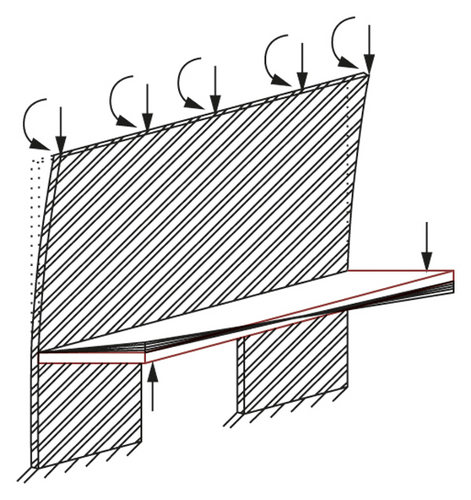
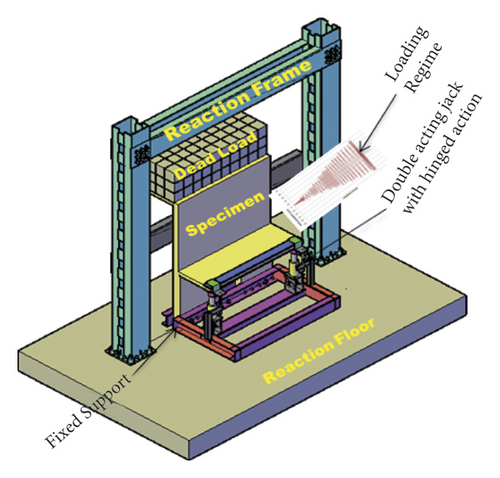
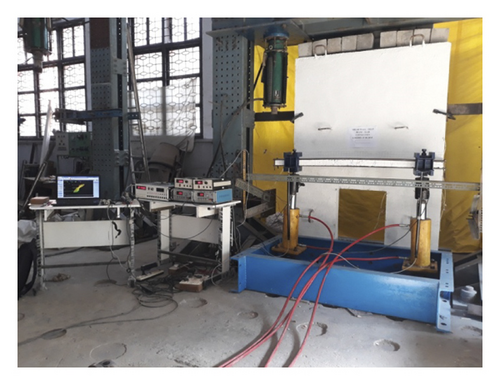
The experimental investigations were conducted at Structural Dynamics Laboratory, Division of Structural Engineering, Anna University, Chennai, India. Figure 5 provides the detailing of the loading mechanism adopted for this study [27]. The extract of the location considered is displayed in Figure 5(a) and actual lateral loading on the joint region is shown in Figure 5(b). The in-plane lateral loading in the shear wall-slab-deep beam joint has been simulated as a couple, as shown in Figure 5(c). The specimens are tested in a well-equipped setup and given displacement-based cyclic loading, as shown in Figure 6. The column is fixed at the base by attaching it to two steel channels using 12 high-strength threaded rods. The steel channels are properly anchored to the strong test floor. The projection at the top of the shear wall is not restrained for displacements and rotations, because it is only for applying the axial load and out-of-plane moment. This was achieved by stacking concrete cubes in layers over the top projection of the shear wall. A total load of 70 kN was applied by assembling cubes which accounts for 10% of the total axial load capacity of the shear wall [28]. The wall was held at the back so that the moment develops on the wall due to loads on the extended slab being transferred as a load to the wall. The eccentricity of the vertical load from the plane of the shear wall has developed the effect of the out-of-plane moment on the shear wall. For testing the sub-assemblage, an equivalent system of forces in the slab is generated to simulate the actual in-plane loading of the shear wall underground motion. To apply the simulated reversed cyclic loading on the specimen, 20 Ton capacity hand-controlled hydraulic push and pull jacks were connected to a reaction steel frame. Two hydraulic jacks were linked to the slab ends with a ball and jacket arrangement to allow eccentric loading, as shown in Figure 6. The specimen was subjected to an increasing displacement in a cyclic manner up to failure [29]. The displacement at the end of the slab was initiated with 1 mm and increased up to failure. Each displacement was applied in three cycles, as shown in Figure 7. The loading sequence was observed using load cells while applying reversed cyclic loading. The drift ratio has been calculated as the ratio of slab displacement to the end of the slab from the joint to the position of LVDT, as given in Table 5. The specimens were instrumented with load cells, LVDT, and strain gauges to monitor the behavior of specimens during testing.
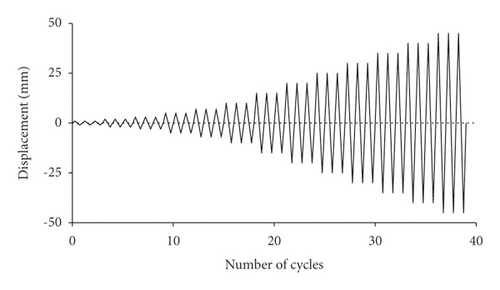
| SI no | Displacement (mm) | Drift (%) |
|---|---|---|
| 1 | 1 | 0.2 |
| 2 | 2 | 0.4 |
| 3 | 3 | 0.6 |
| 4 | 5 | 1.0 |
| 5 | 7 | 1.4 |
| 6 | 10 | 2.0 |
| 7 | 15 | 3.0 |
| 8 | 20 | 4.0 |
| 9 | 25 | 5.0 |
| 10 | 30 | 6.0 |
| 11 | 35 | 7.0 |
| 12 | 40 | 8.0 |
| 13 | 45 | 9.0 |
5. Results and Discussion
An experimental study has been carried out on three types of specimens (90° bent (Type 1), U-hook (Type 2), and U-hook with additional bar (Type 3)). Various parameters such as (i) crack width, (ii) ultimate load-carrying capacity, (iii) hysteretic loops, (iv) energy dissipation, (v) ductility, and (vi) elastic stiffness of the connection were observed. Type 1 specimen has less stiffness and load-carrying capacity than Type 2 and Type 3 specimens. Due to less stiffness of the joint, the cracks were appeared at lower displacements and hence the shear resistance of the joint also reduced. In hysteresis loops, the pinching area is small compared with the other two types of specimens because of a lack of confinement at the core region and less energy dissipation capacity. Type 2 specimen has more shear cracks at the joint region due to discontinuity of reinforcement from the connection region to the wall compared with Type 1 specimen, still, the overall load-carrying capacity of the specimen has been increased. Type 3 specimen has a better joint shear capacity and higher resistance to cracks in the joint due to increased confinement of concrete near the joint region with an additional zigzag bar. The following session discusses the data observed during the experimental investigation.
5.1. Crack Width
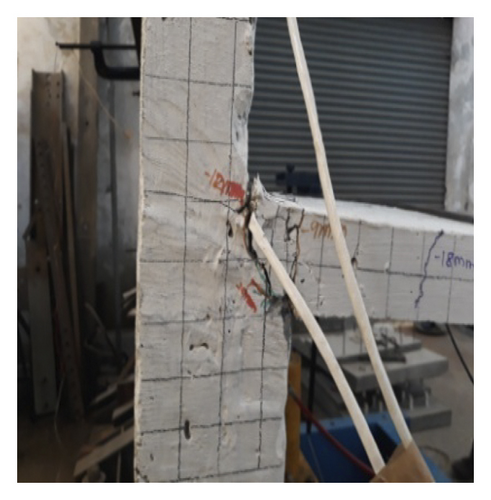
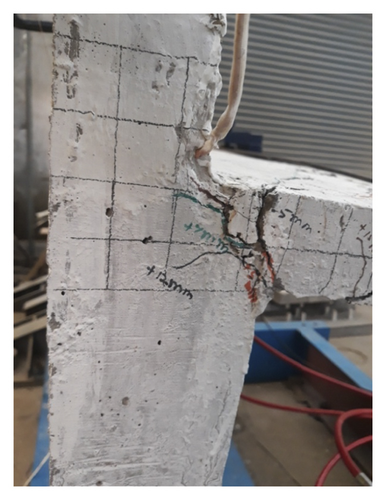
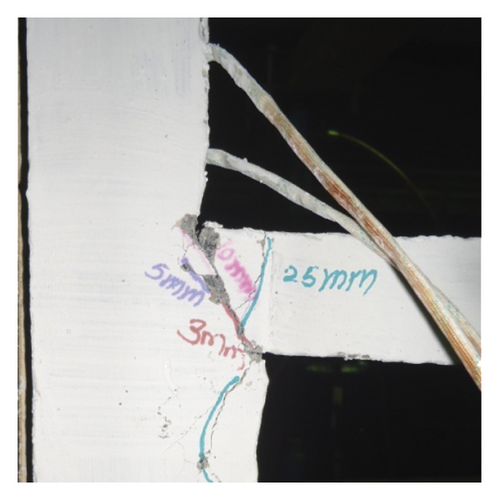
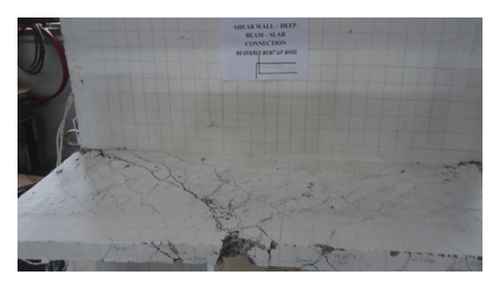
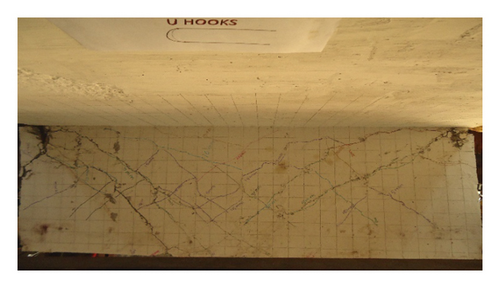
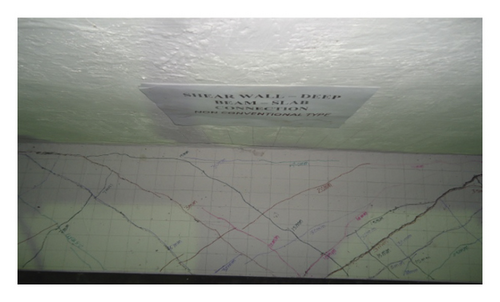
All the specimens exhibited cracks in the slab and joint regions. The side view of the cracked Type 1, Type 2, and Type 3 specimens are shown in Figures 8(a)–8(c), respectively. In Type 1 specimen, the initial visible crack was noticed in the floor slab and extended to the joint region at 6.3 kN (displacement −2 mm). The crack width developed from 0.5 to 2 mm for the load of 9.6 and 10.16 kN, respectively. In Type 2 specimen, the initial visible crack was noticed in the floor slab and extended to the joint region at 6.6 kN (displacement −3 mm). The crack width developed from 0.5 to 2 mm for a load of 9.6 and 11.43 kN, respectively. In Type 3 specimen, the initial visible crack was noticed in the floor slab and extended to the joint region at 7.16 kN (displacement −5 mm). The crack width developed from 0.5 to 3 mm for the load of 10.21 and 12.14 kN, respectively. The load and displacement at the occurrence of the initial crack, at the failure stage, etc., were noted and listed in Table 6. The shear cracks developed at the joint and diagonal cracks appeared on the slab surface due to the in-plane loading mechanism. More shear cracks were noticed in Type 2 than Type 1 and Type 3 due to the discontinuity in the reinforcement from the connection region to the wall. In Type 3, the shear crack pattern was insignificant due to the additional zigzag reinforcement. Crack opening and closure are recorded while applying the cyclic loading. An increase in crack width was observed at the failure stage, and an immediate failure occurred due to shear in Type 1 at a maximum displacement of 45 mm. Also, initially visible cracks were observed in the middle of the floor slab and propagated toward the joint of the specimens. In addition, diagonal cracks were observed at the end of the joint regime. The crack distribution was noted at both top and bottom of the floor slab. The top crack pattern in the slab is shown in Figures 9(a)–9(c), corresponding to Type 1, Type 2, and Type 3. It was noted that, in Type 3 specimen, the crack pattern in the floor slab started at 50 mm away from the face of the wall due to the additional provisions of shear reinforcement within the 50 mm region. All specimens exhibit similar crack patterns with various crack widths except Type 3. These observations indicate the benefit of additional zigzag reinforcement in resisting cracks near the joint region.
| Particulars | Type 1 | Type 2 | Type 3 | |||
|---|---|---|---|---|---|---|
| Load (kN) | Displacement (mm) | Load (kN) | Displacement (mm) | Load (kN) | Displacement (mm) | |
| Initial crack | 6.3 | 2 | 6.6 | 3 | 7.16 | 5 |
| Crack width 0.5 mm | 9.6 | 15 | 9.6 | 15 | 10.21 | 15 |
| Failure stage | 8.8 | 45 | 9.53 | 45 | 9.6 | 45 |
5.2. Ultimate Load-Carrying Capacity
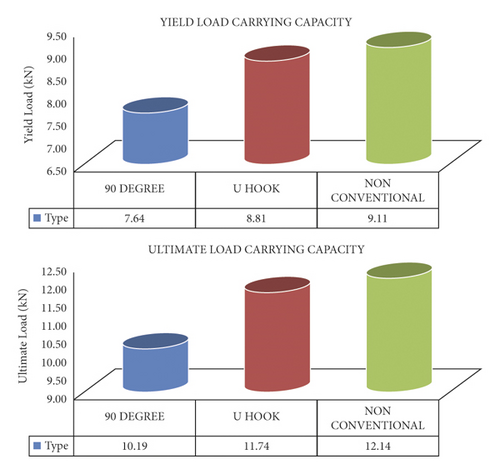
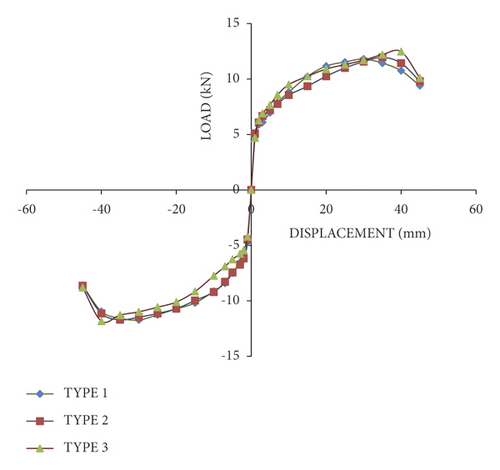
The present study was carried out in a displacement control test setup. The load corresponding to each displacement cycle was noted. The load at yield and ultimate failure stage are presented in Figure 10. Type 2 and Type 3 specimens exhibited 15.3% and 19.24% increase in yield load-carrying capacity with respect to Type 1 specimen. A similar trend has been noticed in the ultimate stage also. Type 2 and Type 3 specimens carried 15.21% and 19.14% higher load at the ultimate stage than Type 1 specimen. Type 1 specimen has low stiffness compared with Type 1 and Type 2 specimens, so the shear resistance of the joint and load-carrying capacity are reduced. Type 2 specimen with U-hook provides additional confinement at the joint and hence the load-carrying capacity was increased than Type 1. In Type 3 specimen, U-hook with zigzag reinforcement provided shear resistance capacity and performed better.
5.3. Hysteretic Loops
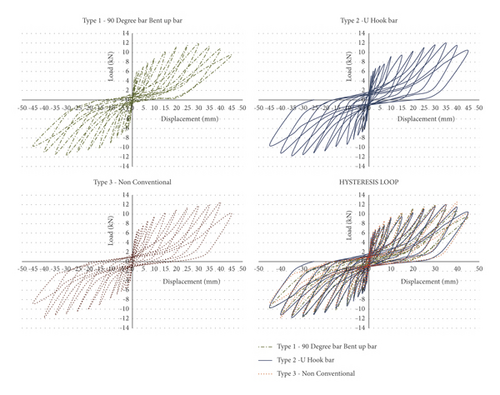
The load-displacement hysteretic curve displays the applied force at the slab ends and displacement at 450 mm distant from the joint. Figure 11 depicts the hysteretic curves for the three specimens. The three connections displayed a consistent load versus displacement hysteretic response early in the loading process, but thereafter pinching was seen in the hysteresis loops in the case of all three connections. During displacement cycles, the curves revealed comparable stiffness and strength deterioration. It is evident that the reinforcing steel in the core region contributed to the resistance. In the 90° bendbar connection, the displacement of the specimen is more when compared with other types because of the lack of confinement at the core. In contrast, in the case of the U-hook connection, the U-hook and slab reinforcement provided confinement to the core. In the 90° bend up bar specimen, the pinching area is small compared with the other two types of specimens. As the displacement cycle progressed, the regions of the hysteresis loops grew bigger, indicating strong energy dissipation capability. Figure 12 shows the force vs. displacement envelope curves for the three specimens.
5.4. Energy Dissipation
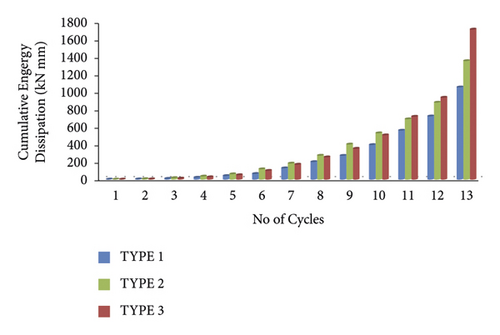
When a sufficient amount of energy is transferred to the connections without a significant loss of strength and stiffness, the joint is said to be ductile. The high energy dissipation capacity of the connection indicates that it is performing well. The area contained by the hysteretic loop in each cycle was estimated to arrive at the energy wasted by the specimen during each cycle. The total energy dissipated was calculated by adding the energy dissipated in each cycle. Figure 13 shows the energy frittered away during the loading cycle plotted against the corresponding displacement cycle for each of the three specimens. Compared with Type 1 (90° bend up bar) detailing, the cumulative energy dissipation capacity of Type 2 (U-hook) and Type 3 (U-hook with extra reinforcement) detailing increased by 21% and 38.6%, respectively. The field engineers have to treat the wall diaphragm with utmost care in the ductility requirements in high-rise buildings since it dissipates high energy during the seismic loads [30].
5.5. Ductility
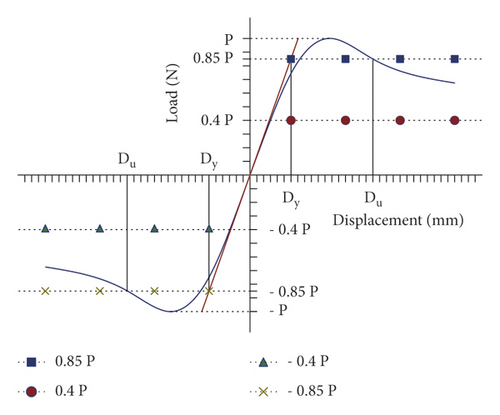
The ductility is defined in seismic design as the ability of the structure to undergo larger amplitude cyclic deformation in the inelastic range without any substantial reduction in strength. The ratio of the maximum displacement to deformation at yield is expressed as displacement ductility. Yield load (Py), yield displacement (Dy), peak load (Pmax), and the corresponding displacement (Du) on the load-displacement curve are determined as per ASCE guidelines [31] from Figure 14. The ductility has been calculated based on elastoplastic behavior. The ductility factor is shown in Table 7. Type 3 (U-hook with additional reinforcement) has more ductility factor value, but the yield displacement has less value compared with Type 1 (90° bent up bar) and Type 2 (U-hook). The additional zigzag reinforcement provided at the connection region contributed to the highest ductility factor for that Type 3 specimen.
| Specimen | Yield displacement (mm) | Ultimate displacement (mm) | Displacement ductility factor (no unit) | Average displacement ductility factor (no unit) | |||
|---|---|---|---|---|---|---|---|
| Positive direction | Negative direction | Positive direction | Negative direction | Positive direction | Negative direction | ||
| Type 1 | 15.32 | 11.94 | 40.52 | 40 | 2.64 | 3.35 | 3.00 |
| Type 2 | 12.22 | 10.64 | 43.25 | 45 | 3.54 | 4.23 | 3.88 |
| Type 3 | 11.14 | 10.41 | 45 | 45 | 4.04 | 4.32 | 4.18 |
5.6. Elastic Stiffness of Connection
The elastic stiffness of structural joints or connections is known as secant stiffness, which can be obtained by the load-displacement curve. Based on the recommendation, the procedure to calculate secant stiffness was adopted [32]. The secant stiffness for all the specimens was calculated under reversed cyclic loading, as presented in Table 8. The elastic stiffness gradually increased from the face of the joint to the core of the joint. Compared with Type 1 specimen, the elastic stiffness was increased by 39.2% and 52.7% for Type 2 and Type 3 specimens, respectively. The results show that Type 3 specimen exhibits higher elastic stiffness than other specimens.
| Specimen | Yield displacement (mm) | Secant stiffness (kN/mm) | Average secant stiffness (Ksec) (kN/mm) | ||
|---|---|---|---|---|---|
| Positive direction | Negative direction | Positive direction | Negative direction | ||
| Type 1 | 15.32 | 11.94 | 0.78 | 0.70 | 0.74 |
| Type 2 | 12.22 | 10.64 | 0.98 | 1.08 | 1.03 |
| Type 3 | 11.14 | 10.41 | 1.12 | 1.14 | 1.13 |
6. Discussion and Results
The present study proposes a new reinforcement detailing for the connection region of the shear wall-floor slab-deep beam. The new connection detailing comprises the normal U-hook at the core region and a zigzag reinforcement in the slab at 50 mm from the face of the shear wall. The nomenclature given to the proposed connection is Type 3. The study was carried out on the conventional connection with 90° bent bars at the core (Type 1) and with U-hook at the core (Type 2) also. The observations are summarized in the following section.
7. Conclusion
- (i)
The initial visual fracture occurred at a load of 7.16 kN for deformation of 2 mm in Type 3 specimen, but Type 1 (90° bend up bar)and Type 2 (U-hook) specimens were noticed at the load of 6.3 and 6.6 kN, respectively.
- (ii)
Type 3 (U-hook with additional reinforcement) specimen exhibited higher strength compared with Type 1 (90° bend up bar) and Type 2 (U-hook) specimens. Experimental results show that the maximum ultimate strength of Type 3 (U-hook with additional reinforcement) specimen is 19.1% and 3.5% higher than that of Type 1 (90° bend up bar)and Type 2 (U-hook) specimens, respectively.
- (iii)
When comparing Type 2 (U-hook) and Type 3 (U-hook with extra reinforcement) specimens with Type 1 (90° bend up bar) specimen, spindle-shaped hysteretic loops with substantial energy dissipation capacity are observed. The enhancement in energy dissipation for Type 3 (U-hook with additional reinforcement) specimen is 31.3% higher than that of Type 1 (90° bend up bar) specimen.
- (iv)
The energy dissipation capacity of Type 2 (U-hook) and Type 3 (U-hook with additional reinforcement) specimens had superior performance when compared with that of Type 1 (90° bend up bar) specimen. When compared with Type 1 (90° bend up bar) specimen, the cumulative energy dissipation capacity of Type 2 (U-hook) and Type 3 (U-hook with extra reinforcement) specimens increased by 21% and 38.6%, respectively.
- (v)
The elastic stiffness of connection in Type 3 (U-hook with additional reinforcement) specimen was enhanced compared with Type 1 (90° bend up bar) and Type 2 (U-hook). An increase of 39.3% and 8% when compared with Type 1 (90° bend up bar) and Type 2 (U-hook) specimen was observed after providing additional reinforcement away from the face of the wall.
- (vi)
The stiffness factor of Type 3 (U-hook with additional reinforcement) specimen was good compared with Type 1 (90° bend up bar) and Type 2 (U-hook). An increase of 52.7% and 39.2% compared with Type 1 (90° bend up bar) and Type 2 (U-hook) specimens provides additional reinforcement away from the face of the wall.
- (vii)
From the experimental investigation, it was finally concluded that Type 2 (U-hook) and Type 3 (U-hook with additional reinforcement) specimens performed very well in terms of ultimate load and energy dissipation compared with Type 1 (90° bend up bar) specimen.
Conflicts of Interest
The authors declare that there are no conflicts of interest regarding the publication of this article.
Acknowledgments
This research was carried out to study the effect of RCC wall-floor slab-deep beam connection due to reverse cyclic loading. And the financial support was self-borne by the authors.
Open Research
Data Availability
The data used to support the findings of the study are included in the article.


