[Retracted] Convolution-LSTM-Based Mechanical Hard Disk Failure Prediction by Sensoring S.M.A.R.T. Indicators
Abstract
The traditional Infrastructure as a Service (IaaS) cloud platform tends to realize high data availability by introducing dedicated storage devices. However, this heterogeneous architecture has high maintenance cost and might reduce the performance of virtual machines. In homogeneous IaaS cloud platform, servers in the platform would uniformly provide computing resources and storage resources, which effectively solve the above problems, although corresponding mechanisms need to be introduced to improve data availability. Efficient storage resource availability management is one of the key methods to improve data availability. As mechanical hard disk is the main way to realize data storage in IaaS cloud platform at present, timely and accurate prediction of mechanical hard disk failure and active data backup and migration before mechanical hard disk failure would effectively improve the data availability of IaaS cloud platform. In this paper, we propose an improved algorithm for early warning of mechanical hard disk failures. We first use the Relief feature selection algorithm to perform parameter selection. Then, we use the zero-sum game idea of Generative Adversarial Networks (GAN) to generate fewer category samples to achieve a balance of sample data. Finally, an improved Long Short-Term Memory (LSTM) model called Convolution-LSTM (C-LSTM) is used to complete accurate detection of hard disk failures and achieve fault warning. We evaluate several models using precision, recall, and Area Under Curve (AUC) value, and extensive experiments show that our proposed algorithm outperforms other algorithms for mechanical hard disk warning.
1. Introduction
At present, Infrastructure as a Service (IaaS) cloud platforms have become the main solution to provide enterprise IT infrastructure. With the development of big data technology and application, more and more enterprises begin to realize the importance of data, so they put forward higher requirements for the availability of data. The traditional IaaS cloud platform generally introduces dedicated storage devices into the platform to achieve high availability of data storage and provides virtual machines in cooperation with dedicated computing devices in Figure 1 [1]. This heterogeneous architecture often leads to two problems: first, it makes the heterogeneity of platform hardware more significant and increase the operation and maintenance cost and scalability cost of the platform; second, when computing resources and storage resources come from different devices, the connection between the computing resources and the storage resource of one virtual machine have to be based on the network connection among devices, which would reduce the performance of the virtual machine. With the proposal of Hyperconverged Infrastructure (HCI), more and more IaaS cloud platforms begin to adopt the homogeneous architecture. Servers in the platform would uniformly provide computing resources and storage resources that are shown in Figure 2 [1]. This homogeneous architecture could effectively solve the problems encountered by the heterogeneous architecture.
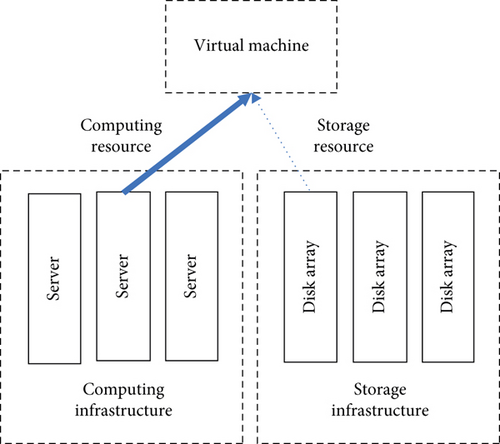
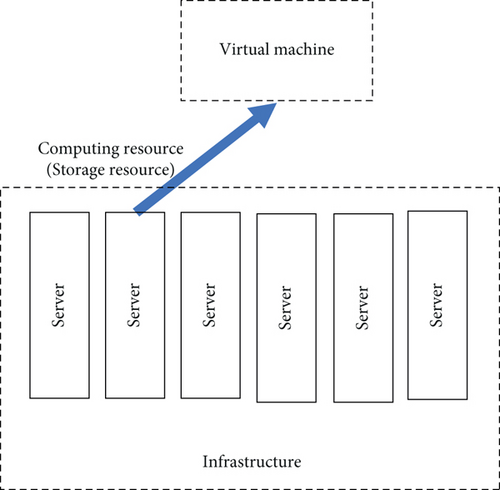
Since there is no dedicated storage hardware for high data availability in the heterogeneous architecture, the cloud platform needs to introduce corresponding mechanisms to guarantee the data availability. Realizing high data availability of IaaS cloud platform mainly involves two aspects: one is data backup and the other is to realize the storage resources availability management. The data backup part mainly introduces backup policy management and backup data management. This part is not the focus of this paper. Furthermore, there are two main types of storage resources in the server: solid-state drive (SSD) hard disk and mechanical hard disk. SSD hard disk could provide higher data reading and writing speed, yet the cost is high, hence it is often used to realize the virtual machine system disk with high performance requirements. The mechanical hard disk, although its data reading and writing speed is relatively low, yet its cost is low, hence the mechanical hard disk is the main way to realize the data storage capacity of IaaS cloud platform. If we can predict the life of mechanical hard disks more accurately and perform operations such as data backup in a timely manner, we can effectively reduce the risk of damage. Existing mechanical hard disks already provide Self-Monitoring Analysis and Reporting Technology (S.M.A.R.T.) that can be used to sensoring the operational status of the mechanical hard disk. Furthermore, S.M.A.R.T. provides indicators of the operational status of the various components of the drive, such as heads, platters, motors, and circuits assisting in the prediction of mechanical hard disk status.
Therefore, the key issue to address is how to predict mechanical hard disk life based on S.M.A.R.T. indicators in a timely and accurate manner. In recent years, several researchers have proposed methods for mechanical hard disk failure prediction, mainly divided into mathematics-based methods [2, 3] and machine learning-based failure prediction method [4]. These methods do not adequately consider the problems of removing unnecessary S.M.A.R.T. indicators, small number of failure samples, and making full use of timing data while predicting mechanical hard disk lifetime. In addition to this, some studies [5–7] have focused on assessing the dynamic reliability and fault prediction of the whole system, while we have mainly completed fault prediction for individual component hard disk.
- (1)
How to filter the S.M.A.R.T. indicators that have the greatest impact on fault warning. The S.M.A.R.T. indicators of mechanical hard disks are the basis for determining faults. Nevertheless, there are also some characteristics that are not relevant to the failure result, excessive characteristics that are useless and may even affect the final analysis result
- (2)
How to solve the problem of imbalanced sample size of failures. Statistically, the annual mechanical hard disk damage rate in data centers is around 2%-5%. Therefore, in the sensoring data of hard disk operation status, the data related to abnormal status is far less than that related to normal status
- (3)
How to make the most of the timing relationships of mechanical hard disk data. Existing warning models for faulty hard disks first use time series data compression to complete feature extraction, and then pass the extracted data into a classifier for classification. This process has the potential to result in the loss of a large number of valuable features
Therefore, the key problem to be solved in mechanical hard disk failure prediction in this paper is how to timely and accurately predict the service life of mechanical hard disk, so as to actively carry out data backup or migration before mechanical hard disk failure, so as to improve data availability.
To address the above challenges, we first propose the Relief feature selection algorithm to filter indicators and select valuable indicators. And we propose the Generative Adversarial Networks (GAN) model to generate a small number of class samples. Then, we propose the Convolution-Long Short-Term Memory (C-LSTM) to solve the problem of long-term dependence on time-series data and accurately detects faulty hard disk data.
The outline of this paper is listed as follows: Section II Related work reviews and discusses the previous related work; Section III Algorithm presents our algorithm; the experiment setup, results, and analysis are presented in Section IV Experimental results and discussion; in the end, Section V Conclusions makes a conclusion of this paper.
2. Related Work
Mechanical hard disk failure alerts have become increasingly important with the growth of IaaS cloud platforms. The hard disk is one of the most common failed components in today’s IT systems, and damage to it can lead to suspension of system services or loss of data. As more and more services run on them, the damage caused by hard disk corruption is increasing every year.
2.1. Anomaly Detection of Mechanical Hard Disks
There are already several methods for detecting anomalies on mechanical hard disks. Yang et al. [8] proposed an evaluation method for comparing feature selection methods and anomaly detection algorithms for predicting hard disks failures. Yu et al. [9] proposed an adaptive error tracking method for hard disks fault prediction. Wang et al. [10] proposed a domain adaptive method to improve fault prediction performance.
With the development of deep learning, combined with its many excellent properties, deep learning is now widely used to solve problems in the prediction domain [11–13]. How to handle time series data needs to be considered when using deep learning methods to accomplish hard disk failure prediction. Several existing studies have been considering how to handle time series data. Hu et al. [14] propose a disk failure prediction system based on a Long Short-Term Memory (LSTM) network. By replacing the input in the LSTM network with the continuous operating records of the disk, the problem of individual variation of the disk can be solved.
2.2. Self-Monitoring Analysis and Reporting Technology (S.M.A.R.T.) Indicators
Self-Monitoring Analysis and Reporting Technology (S.M.A.R.T.) is a monitoring system that collects indicator performance that can be used to infer the actual condition of a hard disk. S.M.A.R.T.-based active fault tolerance uses a threshold approach [15], but traditional S.M.A.R.T.-based fault detection has problems in terms of accuracy [16]. It is no longer sufficient to complete the analysis using S.M.A.R.T. alone. A number of S.M.A.R.T.-based optimisation methods have been proposed. Li et al. [2] explored the ability of Decision Trees (DTs) [17] and Gradient Boosted Regression Trees (GBRT) [18] to predict hard disk faults based on S.M.A.R.T. indicators, and experimentally demonstrated that both prediction models have high fault detection rates and low false alarm rates. Chaves et al. [3] present a failure prediction method using a Bayesian network. The method calculates the deterioration of hard disks over time using S.M.A.R.T. indicators to predict eventual failures. De Santo et al. [19] propose a model based on LSTM, which combines S.M.A.R.T. indicators and temporal analysis for estimating the health of a hard disk based on its failure time.
Li et al. [20] proposed a combination of XGBoost, LSTM, and ensemble learning algorithms to effectively predict hard disk failures based on S.M.A.R.T. indicators. In conjunction with S.M.A.R.T., Shen et al. [21] propose a hard disk failure prediction model based on LSTM recurrent neural networks and a new method for assessing the degree of health. The model exploits the long-term time-dependent characteristics of hard disk health data to improve prediction efficiency and efficiently stores current health details and deterioration.
In addition to selecting all the attributes of S.M.A.R.T., some studies have also taken the approach of selecting some of the attributes. Wu et al. [4] propose the use of information entropy to optimise S.M.A.R.T. indicators to enable the selection of the most relevant attributes for prediction, combined with a Multichannel Convolutional Neural Network-Based Long Short-Term Memory (MCCNN-LSTM) model to complete the prediction of hard disk failures.
2.3. Sample Imbalance
The above study focuses on the use of S.M.A.R.T. indicators to detect anomalies and health states of hard disks. In addition, hard disks are healthy for most of their life cycle with relatively few failures, which creates a problem of sample imbalance.
GAN-based methods are often used to solve the problem of sample imbalance. Lee and Park [22] proposed a GAN-based fusion detection system for imbalanced data. Xu et al. [23] proposed a convergent Wasserstein GAN to solve the problem of class imbalance in network threat detection. Huang and Lei [24] proposed a novel Imbalanced GAN (IGAN) to deal with the problem of the class imbalance.
In addition to the GAN-based approach, a number of others have proposed solutions to the problem of imbalanced hard disk failure samples. Tomer et al. [25] propose to apply machine learning techniques to accurately and proactively predict hard disk failures. Shi et al. [26] proposed a deep generative transfer learning network (DGTL-Net) that integrates a deep generative sample for generating pseudofailure network to generate pseudofailure samples and a deep transfer network to solve the problem of hard disk distribution discrepancy, enabling intelligent fault diagnosis of new hard disks. Ircio et al. [27] proposed an optimised classifier to solve the problem of imbalance between hard disk failure and normal hard disk height. Wang G. et al. [28] propose a multi-instance long-term data classification method based on LSTM and attention mechanism to solve the problem of data imbalance.
3. Algorithm
We present an evaluation method for comparing feature selection methods and anomaly detection algorithms for predicting hard drive failures. It enables the rapid selection of the best algorithm for a particular model of hard disk. It includes an evaluation mechanism for assessing feature selection methods from a performance and robustness perspective and for assessing the performance, robustness, efficiency and generalisability of anomaly detection algorithms.
Hard disk failure prediction needs to deal with three important points, indicator selection, timing compression, and imbalanced sample processing. The overall process is shown in Figure 3.

Nevertheless, these time series feature extractions are often not enough. The main problem is that the previous data is forgotten faster and faster over time, and the sequence of values is not considered, resulting in the data not playing its due role.
On the other hand, the processing of imbalanced samples is relatively rough, often using oversampling of a few categories of data or undersampling of most categories of data. Nevertheless, oversampling of a few categories of data leads to changes in the probability of data features, which appear to have excellent performance in the training set, and decrease in the effect of the test set, resulting in a low recall rate. Using undersampling algorithms, clustering, and other methods to remove part of the samples to achieve sample balance, often resulting in loss of important features, or reduced data sample size, resulting in overfitting problems.
This algorithm is divided into offline model implementation and online data analysis. The detailed algorithm flow is shown in Figure 4.
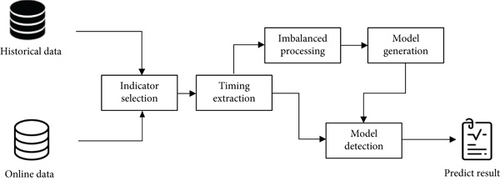
- (1)
Indicator Selection. Relief feature selection algorithm is used to filter parameters and select valuable indicators
- (2)
Imbalanced Processing. In view of the few samples of mechanical hard disk damage, the GAN [29] model is used to generate a small number of class samples to achieve a sample balance state model is used to generate a small number of class samples to achieve a sample balance state
- (3)
Model Generation. Using the processed data set to train the health status of the mechanical hard disk to generate models such as C-LSTM
3.1. Relief-Based Feature Selection Algorithm Parameter Selection
The S.M.A.R.T. [30] indicators gathered by the sensors installed in the mechanical hard disks for sensoring the mechanical hard disks’ status usually have a fault warning characteristic, which are the basis for determining faults [31]. However, there are also some indicators that are not relevant to the failure result—excessive indicators that are useless and may even affect the final analysis result. When performing a hard disk analysis, it is necessary to consider the various complexities faced by hard disks. For instance, the capacity of a hard disk will gradually increase over time. In addition, the hard disk will slowly deteriorate, although the two are not very relevant as the capacity of a hard disk may be adjusted at any time. Therefore, it is essential to select the indicators to remove interfering features.
We know that when an attribute is favorable for classification, then samples of that kind are closer to that attribute, while samples of the opposite kind are further apart from that attribute.
3.2. GAN-Based Imbalance Data Processing
In the daily operation of an IaaS cloud platform system, the number of failed hard disks is relatively small, while the number of normal samples is always large. Statistically, the annual mechanical hard disk damage rate in data centers is around 2%-5%, and a hard disk is normal for most of the time, which results in the raw positive and negative sample data always being imbalanced. Using machine learning methods for failure prediction on imbalanced data sets requires either oversampling a smaller number of data categories to achieve data balance or undersampling a larger portion of the data. Conventional oversampling algorithms, however, can lead to changes in the probability of data for a few classes, undersampling leading to loss of important features in most classes, or overfitting problems due to insufficient training data. Examples include the use of Synthetic Minority Oversampling Technique (SMOTE) oversampling algorithms [34], which synthesize new samples for a few classes based on interpolation, and the use of clustering algorithms to implement undersampling and discard some samples to alleviate class imbalance.
Considering the problems of the original algorithm in dealing with imbalanced data, the innovation of this algorithm is to use the zero-sum game idea of GAN to generate less category samples. The GAN continuously plays a game through the generative network G and the discriminative network D, which in turn enables G to learn the distribution of the data. Using the GAN method, the generative network G and the discriminative network D are continuously played by using the zero-sum game idea in game theory, which in turn enables G to learn the distribution of the data.
Through k rounds of training, the discriminator can accurately distinguish between the original data and the data generated by the generator G. Next, train the generator so that the generator can confuse the discriminator and make it indistinguishable. Through multiple rounds of training and adjusting the discriminator and generator network results, a better model effect can be achieved. However, the stability of GAN training is not good, and it is difficult to achieve the desired effect in this experiment. By improving GAN, there are currently better algorithms such as Deep Convolutional GAN (DCGAN) [37], Wasserstein GAN (WGAN) [38], and Wasserstein GAN with Gradient Penalty (WGAN-GP) [39].
WGAN uses the Wasserstein distance, which has superior smoothing properties compared to Jense-Shannon (JS) and solves the gradient disappearance problem [23]. In addition, WGAN addresses not only the problem of GAN training instability but also provides a reliable indicator of the training process, and the indicator is highly correlated with the quality of the generated samples. Therefore, we choose WGAN as a method to solve the data imbalance problem.
3.3. Based on LSTM Network Anomaly Detection and Recognition
Our proposed LSTM network-based model solves the problem of long-term dependence on time-series data and accurately detects faulty hard disk data. The traditional faulty hard disk early warning model uses time series data compression to first extract features, and then transfer the extracted data to the classifier for classification, resulting in the loss of many valuable features. To extract the temporal relationships of mechanical hard disk data, LSTM networks are added to the model training in this paper.
3.3.1. The Improved Network Structure of LSTM
The original LSTM network structure only takes into account the temporal sequence of data in time. Nevertheless, for hard disks, changes in certain parameters will affect the data of other parameters. Compared to the common LSTM structure, this algorithm borrows from the Convolutional LSTM, which means that convolutional computation is added to the input layer, local perception and pooling are introduced, spatial features are added and input to the LSTM structure together with the original data. The structure of C-LSTM is shown in Figure 5.
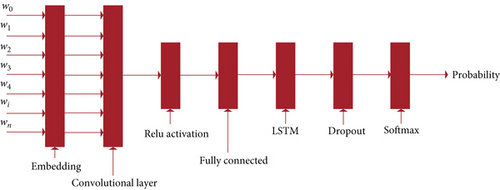
When calculating the loss function, the problem of gradient explosion arises, our model uses clip gradients method [42] to keep the weights within a certain range.
4. Experimental Results and Discussion
To verify the predictive effectiveness of the algorithm, fault warning experiments were conducted on mechanical hard disk data from data centers and compared with traditional undersampling-based equalization and binary classification methods (the demo of experiments: https://github.com/Eva0417/HardDisk).
4.1. Data Description
The experimental data is from Backblaze, and it consists mainly of data which gathered by sensors from nearly 30,000,000 mechanical hard disks over a 1-year period in 2017 (the dataset: https://github.com/1210882202/data). The data is mainly S.M.A.R.T. indicators gathered once a day, with some of the disks not sensoring S.M.A.R.T. indicators over time, indicating that the mechanical disk has been damaged. The objective of the experiment was to predict whether the disk would become damaged in the future based on the last sixty days of data for these disks. As mechanical hard disks generally deteriorate slowly as the components age, this experiment assumes that the mechanical hard disk is not damaged within fifteen days and this data is marked as healthy, and if the disk is damaged within fifteen days this data is marked as faulty. Based on the sample data, the experiment hopes to design a fault warning model with excellent performance in terms of accuracy, recall, and Area Under Curve (AUC) value.
4.2. Baseline
- (1)
Logistic Regression (LR) [43]. LR is a supervised learning method often used in anomaly detection. For one variable or multiple independent variables, find the best fitting model to describe the set of independent variables, and complete the anomaly detection in this way
- (2)
Random Forest (RF) [44]. RF is a common method of anomaly detection by bringing together multiple decision trees. The basic unit is a tree-structured decision tree. With this structure, normal instances can be learned and instances that are not classified as normal are considered as anomalies
4.3. Experimental Setup
4.3.1. The Settings of LSTM
- (1)
Input and Output. For the input data, the data relevance is first judged using the Relief algorithm to obtain valid 16-dimensional data, and the data sample map is obtained based on the faulty sample generation method. The specific input is a None ∗ Seq ∗ 16-dimensional tensor, and the output is a None ∗ 2-dimensional tensor
- (2)
Network Structure. The LSTM network used in the experiments uses a network containing two layers of LSTM hidden layers, with a dropout layer added after each hidden layer, followed by a fully connected layer connecting the LSTM and the output, and finally a SoftMax layer
- (3)
Network Parameters. The key parameters of the neural network used for the experiments were set as shown in Table 1
| Name | Meaning | Value |
|---|---|---|
| embedding_dim | The dimension of input data | 16 |
| seq_length | The length of sequence | 60 |
| num_classes | Thenumberof classes | 2 |
| keep_prob | The dropout rate | 0.5 |
| learning_rate | The learning rate | 1e-4 |
| batch_size | The size of batch | 256 |
| num_epochs | The number of trainings | 5 |
| lstm_size | The LSTM size | 3 ∗ 16 |
| lstm_layers | The LSTM layer | 2 |
4.3.2. The Settings of C-LSTM
- (1)
Input and Output Settings. The input data is the same as the original LSTM
- (2)
Network Structure. The network used in the experiment adds a layer of Convolutional network after the input layer, which is combined with the original input data and fed into the LSTM hidden layer network
4.4. The Results of Experiment
In applying the Relief screening algorithm, attribute-related statistical components are calculated for the indicators which gathered by sensors in hard disks, the larger the score, the greater the classification power. The statistical components are ranked by size and scaled to take the key indicators needed. First, we analyzed data collected from 26,339 disks over a six-month period in the first half of 2017. The results based on the Relief filtering algorithm are shown in Figure 6.
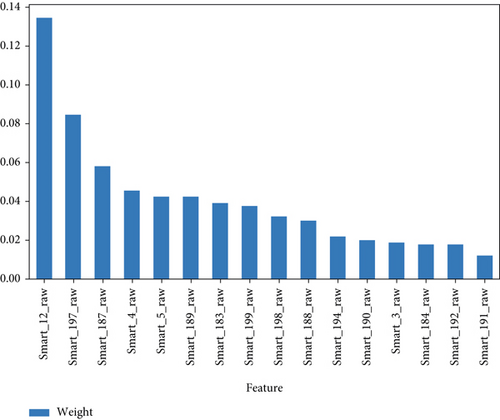
In Figure 6, the horizontal axis represents each dimension number, and the vertical axis represents the relevance of each dimension to the results, taking values in the range [0, 1], with closer to zero indicating less relevance to the results. Based on the results of the statistical components obtained in Figure 6, the parameters whose results are greater than the threshold are selected, and the final hard disk correlation is obtained.
According to the above analysis, we use the WGAN network to conduct experiments, and the sample generation is shown in Figure 7.

The horizontal axis of Figure 7 represents each indicator gathered by sensors of the mechanical hard disk, and the vertical axis represents time. Darker colors in Figure 7 represent lower indicator values, and lighter colors represent higher indicator values. As can be seen from Figure 7, the WGAN network uses the principles of game theory to generate samples that are relatively similar and can simulate a large amount of information, while at the same time differing from direct replication. The experimental results show that the use of WGAN for feature extraction and regeneration of the overall fault sample solves the problem of sample imbalance and expands the fault sample.
In addition to experimenting on our proposed C-LSTM model, we have also experimented on the comparison algorithms.
According to the specific experimental setup, the results of this experiment for the comparison model of LR are as shown in Figures 8–10. In these figures, we use different color to show the different scores of LR.
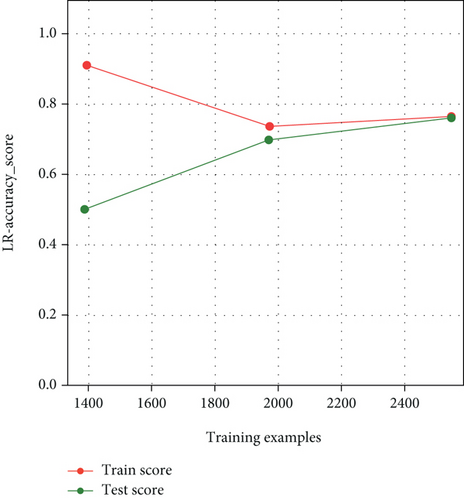
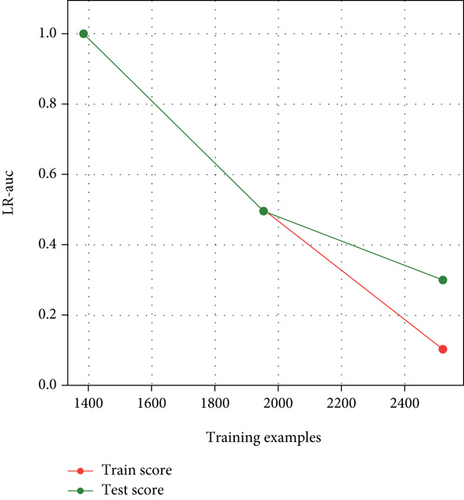
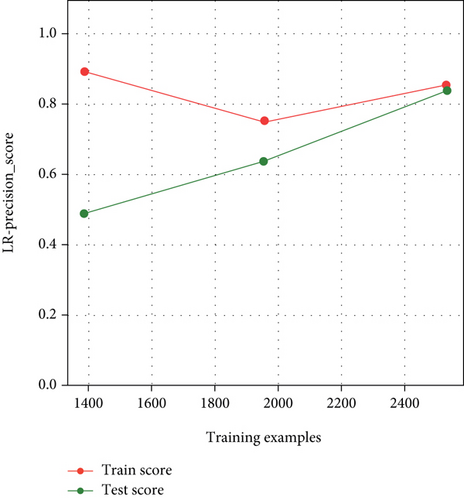
According to the specific experimental setup, the results of this experiment for the comparison model of RF are as shown in Figures 11–13. In these figures, we also use different color to show the different scores of RF.
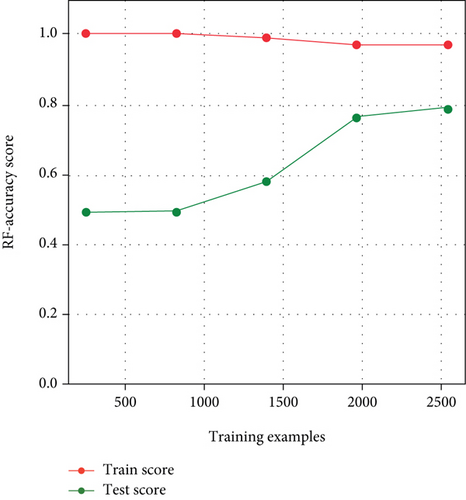
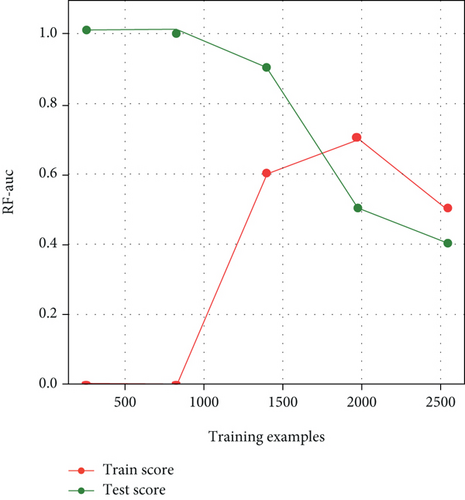
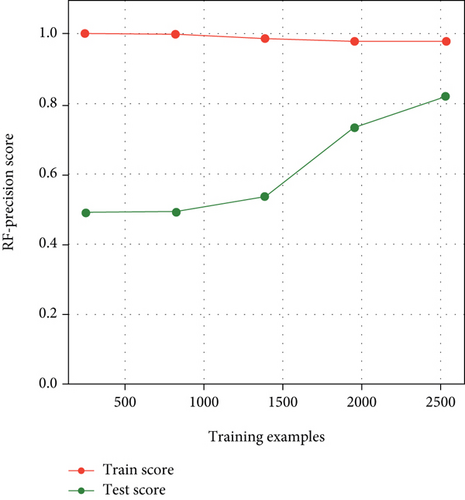
According to the specific experimental setup, the results of this experiment for training the network model of LSTM are as shown in Figures 14–16.
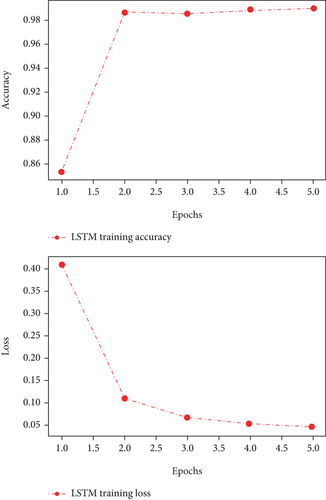
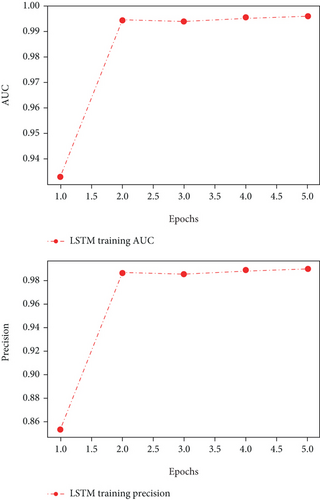
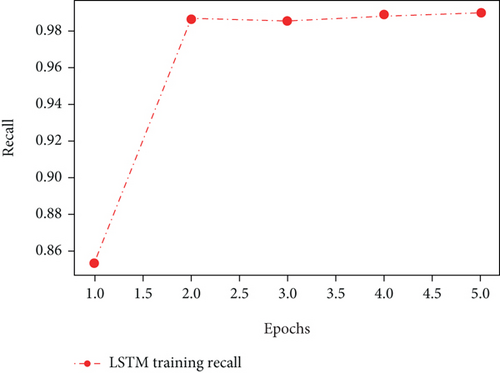
The horizontal axis of graphs in Figures 14–16 represents the number of training epochs, the vertical axis of the first graph in Figure 14 represents the accuracy rate during training, and the vertical axis of the second graph represents the training loss data. According to the graphs in Figure 14, we can see that after 3 epochs, the training gradually leveled off (in this paper, we define that a loss reduction of no more than 0.1 after 1 epochs is considered smooth), where the loss converged at around 0.05. Based on the Figures 15 and 16, we can see that the accuracy of training is around 0.91.
The results of this experiment on the training of the C- LSTM network model are shown in Figures 17–19.
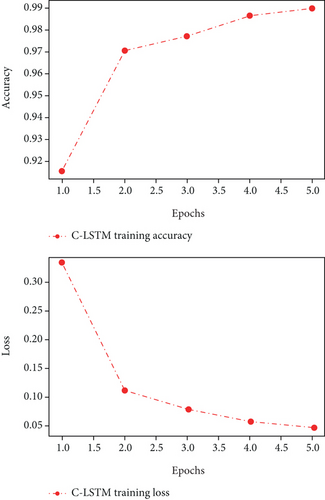
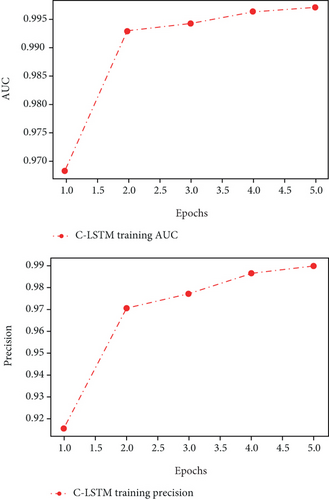
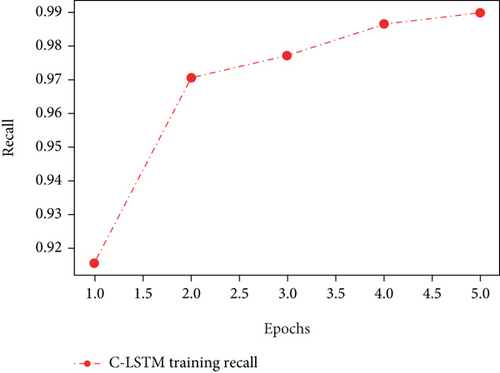
The horizontal axis of graphs in Figures 17–19 represents the number of training epochs, the first graph’s vertical axis represents the accuracy rate during training in Figure 17, and the second graph’s vertical axis represents the training loss data. After 4.0 epochs, the training gradually leveled off, with the loss converging at around 0.05 and the accuracy at training at around 0.93.
Comparing the training results of the LSTM in Figures 14–16 with the C-LSTM network model in Figures 17–19, we can conclude that the C-LSTM has a faster convergence speed, lower loss drop, and higher accuracy. Therefore, from a training perspective, the C-LSTM performs better.
The individual classification models were evaluated ac- cording to precision, recall and AUC value, and the results are shown in Table 2. In terms of each metric, the C-LSTM model has the best result.
| Algorithm | AUC | Precision | Recall |
|---|---|---|---|
| LR | 0.6983 | 0.9743 | 0.6058 |
| RF | 0.7342 | 0.9834 | 0.6253 |
| LSTM | 0.7564 | 0.9878 | 0.7054 |
| C-LSTM | 0.7613 | 0.9896 | 0.7103 |
5. Conclusions
Firstly, the mechanical hard disk is installed with sensors for sensoring the status of the mechanical hard disk and the S.M.A.R.T. indicators gathered by these sensors on the operational status of the various components of the disk can be used to predict the life of the mechanical hard disk. Based on this, we focus on how to accurately predict mechanical hard disk failure and achieve effective improvement of data availability in the IaaS cloud platform.
The model proposed in this paper includes three parts: Relief feature selection algorithm, WGAN, and LSTM models. To remove features from the S.M.A.R.T. indicators of mechanical hard disks that are irrelevant to the failure results, we use the Relief feature selection algorithm to remove interfering features and complete the parameter screening. As the number of failed hard disks is small in the IaaS cloud platform system, we use the zero-sum game idea of WGAN to generate fewer category samples to solve the sample data imbalance problem. Finally, we use the improved C-LSTM model to complete hard disk failure detection and early warning.
Through extensive experiments, we constructed our own model and evaluated the model we designed and other methods using precision, recall, and AUC value. The experiments demonstrate that our proposed algorithm outperforms other algorithms for mechanical hard disk warning.
As our future work, we aim to extend our approach to SSD-based IaaS cloud platforms. In our proposed approach, we mainly implement mechanical hard disk S.M.A.R.T.-based fault warning through WGAN and LSTM to achieve effective improvement of data availability in IaaS cloud platforms. However, as more and more IaaS cloud platform systems gradually adopt SSD to pursue significant performance improvement. Based on this, how to better realize the automation of repair in SSD-based IaaS cloud platform and study the automatic adaptation of parameters are our future goals to achieve.
Conflicts of Interest
The authors declare that they have no conflicts of interests.
Acknowledgments
This work is supported by Science and Technology Project from State Grid Information and Telecommunication Branch of China: Research on Key Technologies of Operation Oriented Cloud Network Integration Platform (52993920002P).
Open Research
Data Availability
All data, models, and code generated or used during the study appear in the submitted article.


