[Retracted] Financial Early Warning Model for Listed Companies Based on the Smart Sensor Data Network
Abstract
This paper uses intelligent sensors to build a data network, collects information about listed enterprises in all aspects, performs frequency statistics and semantic analysis based on the financial domain lexicon on information related to listed enterprises, and introduces big data variables into a nonlinear support vector machine early warning model of enterprises combined with financial indicators. This paper introduces online reviews as big data indicators based on financial early warning theories and methods. Suitable financial indicators and big data indicators are selected for the financial early warning model to filter the available indicators. The prediction results of only financial indicators are compared with the prediction results of incorporating big data indicators. Quantify the comment information related to enterprises on the platform through sentiment classification and statistics on the number of comment information posted. The cost-sensitive support vector machine is used as the base classifier of the improved AdaBoost algorithm to build a dynamic imbalance warning model. To address the problems of large complexity and computation of unbalanced big data classification, high reliance on a priori knowledge, and classification performance to be improved, the classification and detection method of the intelligent sensor data network is proposed. By introducing migration learning, the problem of knowledge acquisition and training efficiency of high-dimensional complex data feature extraction in a big data environment is effectively solved, and the network performance is optimized by a conjugate gradient descent algorithm. Through simulation experiments, the prediction accuracy of the model for positive class samples is significantly improved after the nonequilibrium processing, the recall rate of the network model reaches 84.15%, and the prediction accuracy of the network model under different time steps reaches more than 90%. The experiment proves that the model can send out financial alert information more quickly and efficiently and accurately when a financial crisis may occur, relative to the traditional financial forecasting methods.
1. Introduction
With the development of mobile communication technology, the rise of the Internet of Things, and the advent of the era of industry 4.0, the sensor industry, agriculture, communications, space exploration, and other fields play an important role. At present, the domestic high-end sensor market is still occupied by foreign manufacturers, and China’s sensor industry needs to increase investment to meet the needs of the domestic high-end market as soon as possible [1]. Sensors can be divided into analog sensors and digital sensors according to the nature of their output quantities. An analog sensor output signal is an analog signal, the general signal is weak, difficult to use directly, and impossible to transmit over long distances. The output signal of digital sensors is digital, the signal transmission is convenient, has strong anti-interference ability, and can work in more complex environments. It is foreseeable that the digitization and intelligence of sensors are the hot spot of academic research and industry development trends in the future [2]. Information perception and acquisition processing are the basis of the Internet of Things applications, increased test and measurement tasks require a networked sensor system as a test platform to achieve the combination of high precision, high speed, diversity, flexibility, and intelligent perception, so the traditional sensors are in the process of transformation to new sensors. New sensors are characterized by miniaturization, digitalization, intelligence, multifunctionality, and networking, which not only promotes the transformation of traditional industries but also leads to the emergence of a new Internet of Things industry as a new economic growth point. In this process, requiring all traditional enterprises have digital intelligent processing module development, and production capacity is unrealistic and unnecessary, so digital intelligent processing module developed into a sensor. In this process, it is unrealistic and unnecessary to require all traditional enterprises to have digital intelligent processing module development and production capacity, so digital intelligent processing module develops into an independent functional module in the sensor system and becomes a unique production line.
With the advancement of technology and the development of the times, the present society is completing the transformation from the information age to the data age. It has brought many opportunities and challenges to all occupations. Financial analysis is an important part of the work of enterprises and has been impacted by the innovation of data mining technology, which provides an effective solution for enterprises to conduct intelligent financial analysis, optimize the quality of enterprise financial statements, and prevent possible financial risks of enterprises and other problems that are difficult to solve in the process of traditional financial analysis [3]. However, the complex problems brought by data also bring new challenges for enterprises. First, with the change in data level, with the advent of the data era, enterprises not only need to complete the collection, collation, and analysis of internal data but also need to collect, identify, sort, and store external environmental data, industry data, industry chain data, competitor data, consumer data, and so on. The second is the change in data types. In the process of production and operation activities, enterprises will generate a large amount of data, including both structured data for traditional financial decision-making and unstructured data that also have a great impact on the financial decision-making of enterprise stakeholders [4]. The second challenge of the data era is to store and utilize unstructured data appropriately and to use unstructured data to assist financial data for decision making. It is difficult to meet the decision-making needs of modern enterprises by using traditional financial analysis methods, and data mining technology needs to be used in the process of financial analysis to help enterprises meet these challenges successfully. A financial early warning has always been an unavoidable problem in the development process of enterprises, and the indicators in the financial early warning model studied by previous researchers mainly focus on financial indicators. However, the actual situation is that every time a financial crisis breaks out in an enterprise, it is exposed that relying solely on financial indicators in financial crisis early warning has certain limitations because financial indicators have lagging and manipulability, and these characteristics will hurt the accuracy of financial early warning. With the development of the Internet economy, the cost of obtaining information for enterprises has been reduced, the competition among enterprises has become increasingly intense, and more enterprise managers and enterprise-related personnel have started to pay attention to the use of nonfinancial indicators to study enterprise financial early warning [5]. Due to the high difficulty of obtaining nonfinancial indicators, the wide range of nonfinancial indicators available and the inconsistent standards, and the different degrees of sensitivity of each company to different indicators, it is difficult to meet the needs of different enterprises for indicators. However, the use of big data technology has enabled an important step forward in the study of financial early warning.
Recently, with the intensification of easy negotiations in various countries and the continuous fluctuation of the market environment, enterprises often encounter various problems such as financial deterioration in their actual business management. The emergence of financial problems is often fatal for the development of the whole company, which makes the issue of financial crisis gradually develop into the focus of attention of the economies closely related to the development of enterprises. Therefore, the establishment of an effective and scientific financial early warning model is a direction of research significance for risk management in the process of business operation and management [6]. However, due to the limitation of data analysis and processing technology, traditional financial early warning models are based on simple statistical Z-score models, support vector machines, and BP neural network models, and there are problems in the process of model construction such as incomplete selection of sample data, scientific selection of indicator variables, and “uniformity” of the modeling process. With the advent of the big data era, it is important to use deep learning technology to realize the “unification” of financial early warning modeling, reduce the intervention of human factors, and establish a more scientific financial early warning model. Based on the above background, this paper uses an intelligent sensor data network to collect all-around information about enterprises and build a financial early warning model. This paper proposes a more rapid, efficient, and accurate financial early warning model for listed enterprises.
2. Related Works
In European and American countries, the research on sensors much earlier than the domestic has a wealth of technical accumulation. The United States attaches great importance to the research work of sensors and put forward six sensor-related research projects to ensure the national security and socioeconomic development of the United States [7]. Japan as the first modernized developed Asian country in the field of sensor technology to carry out in-depth research work has a strong accumulation of technology, its National Science and Technology Agency in the 1990s developed 70 key research topics, and there are 18 sensor-related. Intelligent sensor-related products, from the market share, the dominant products in the international market are mainly from the German HBM, BECKHOFF, the U.S. STS company [8]. In addition, Japan’s OMRON, Japan’s Mitsubishi, Sweden’s ABB, and other industrial solutions manufacturers, also in this field, provide a complete solution at the system level. Determine the optimal classification hyperplane of the two enterprise samples, as well as the kernel function and find the optimal related parameters. Finally, the decision function of the enterprise financial early warning model based on big data can be obtained according to these. The advantages of the above companies’ smart sensor products are mainly focused on maintaining a higher data output rate case, better suppression of interference and noise, still more to achieve higher accuracy, and having an advanced and common software system. Chatfield et al. proposed a universal remote data sensor system research and design, with an embedded Linux operating system as the software base, for the common industrial CAN, Modbus, and other protocols to achieve the sensor data acquisition, data storage, and remote forwarding functions, but also the use of Web-based and database real-time configuration functions [9]. Smart sensors will develop towards high accuracy and reliability, diversification, compounding, feature-rich, integration, and miniaturization. Yang et al. studied the nonlinear compensation problem of the dynamic weighing system and used BP neural network as well as the L-M algorithm to compensate for the nonlinear relationship between the output voltage and weighing mass of the microdrug weighing system, which has an efficient performance in terms of convergence speed and error performance [4, 10].
Many factors can cause a company to have financial problems, including internal and external factors. The internal factors include poor management, excessive debt, and poor decision-making. External factors include the deterioration of the economic environment and market factors. A financial crisis is a situation in which a company is not operating properly or even goes bankrupt. Most studies consider bankruptcy as the criterion of the financial crisis. Stadlober et al. suggest that the act of financial management is different from the traditional act of “counting money” of the “financial man”. Financial management is more proactive and is closely linked to broader organizational strategies and environmental constraints [11]. Schütze et al. have conducted extensive research on the healthcare industry, suggesting that the industry is increasingly concerned about financial performance and, therefore, the ability to anticipate financial distress. They combine several major studies of business failure in the financial sector and compare them extensively with studies of hospital operations, concluding that most current models for predicting financial distress in hospitals are limited or have many flaws [12]. In a study related to financial crisis prediction, Liu et al. found that the larger the period of data used from the year being predicted, the more effective the big data metrics were. Scholars believe that the sentiment bias generated by big data on online public opinion changes with many internal or external factors and does not reflect the current corporate situation promptly [13]. On the other hand, since there are already various ways to quantify online sentiment indicators, while the quantification of nonfinancial indicators is difficult to handle, quantitative indicators of online sentiment are used instead of nonfinancial indicators.
Times are changing rapidly, the social environment is constantly changing, and information technology is growing rapidly. Of course, with this comes to the risk of corporate finance, which can cause great harm to the company at any time due to a small mistake. Therefore, the early warning of the financial crisis is crucial. The fundamental source of data for financial crisis warnings is financial accounting information and nonfinancial information, on top of which several sensitive indicators are selected and studied to monitor and report on possible financial crises faced by enterprises, thus enabling them to prevent risks and minimize losses promptly. Thanks to the rapid advancement of technology, big data has come into the limelight and has provided us with a lot of convenience and ways to solve problems. Previously, many scholars have made many contributions to promote the research of enterprise financial early warning through their unremitting efforts, but from the research process, scholars relatively pay more attention to and emphasize the financial factors that lead to the occurrence of the financial crisis in enterprises, while ignoring more other factors extracted through the network big data, which include the factor of network public opinion. Therefore, enterprises cannot stay out of the picture thinking that they are independent of the whole social system and need to actively use the subjective initiative of the market, and this real and reliable online public opinion information can help solve the shortcomings of financial early warning with low accuracy in real applications. Data mining technology provides an effective solution to the problems that are difficult to solve in the traditional financial analysis process, such as intelligent financial analysis, optimization of the quality of corporate financial statements, and prevention of financial risks that may arise in enterprises.
3. Financial Analysis and Early Warning System Application Theory and Technology
4. Intelligent Sensor Data Network Design
When a user is authenticated, the same collection and preprocessing operations are first performed on the authentication data. The trained implicit authentication model is used to compare the similarity between the preprocessed authentication samples and the samples in the reference set and give the authentication results, allowing the user to continue to perform subsequent access operations if he or she passes the authentication, otherwise, explicit authentication is performed [16]. In the training phase of implicit authentication based on physiological behavioral features, linear acceleration, magnetic field, gyroscope number, and pressure and press area data of the screen are first collected, and the data are preprocessed with alignment and noise reduction to form a training set for training the implicit authentication model. Utilize web text information to meet basic needs. The research on the application of big data indicators in the field of stocks is very mature and has achieved remarkable achievements, but it is still in its infancy in corporate financial early warning. To train the authentication model, we first need to obtain the sensor data that reflect the physiological behavior of the user. The pressure data and press area data of the screen reflect the physiological characteristics of the user’s finger; the acceleration data, magnetic field data, and gyroscope data reflect the changes in the smart device’s orientation over time and its movement trajectory in space during the movement of the smart device, which to a certain extent reflects the user’s behavior habits.
Information monitoring system data collection must rely on the application of various types of sensors; the accuracy and reliability of sensor data collection are critical to irrigation information monitoring systems. A sensor is a device that converts information collected about specific physical qualities into recognizable information for recording and responding to provide security for the system. Based on securing the timeliness of the collected data of the system, extending the life cycle of the wireless sensing network, and reducing the power consumption of the system, this thesis designs a sensing node based on communication protocols such as I2C to achieve multiparameter collection for the enterprise. As shown in Figure 1, each sensor is first equipped with a microcontroller for data reading and access to write the corresponding protocol. By setting different bus access addresses for each sensor, the MCU can realize data interaction with each sensor through data polling.
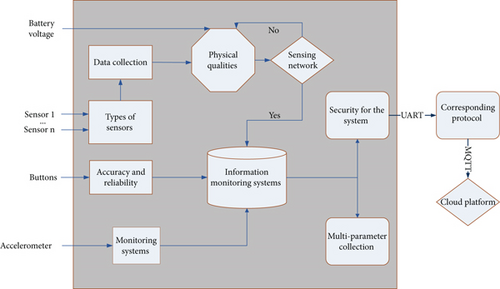
The selection of communication methods of the sensing layer is based on different application objects. NB-IoT is built on the cellular network, and with the development of a cellular network, NB-IoT has achieved full coverage of the area. In this thesis, NB-IOT communication technology is chosen as the main communication method of the system, mainly because of its strong connection capability, coverage capability, low power consumption, and low cost. The classification performance needs to be improved, and a classification and detection method of intelligent sensor data network is proposed. The information monitoring system uses terminal collection nodes to monitor environmental parameters of farmland, valve actuators start and stop, and sends the collected information to the cloud server through a wireless transmission module, which then forwards it to the IoT cloud platform for storage and display, and users use cell phones or computers to obtain business financial related data and actuator status information through the cloud platform to remotely control the field actuator action.
5. Construction of an Early Warning Model for the Financial Management of Listed Companies Based on the Intelligent Sensor Data Network
For listed companies, if they can reasonably use online public opinion reviews for financial early warning, they can effectively improve their ability to face market risks and their competitive ability. Therefore, the financial early warning model mentioned in this paper can effectively reduce the market risk faced by enterprises and enable them to operate normally and safely [17]. The model can predict potential business risks and provide effective early warnings when the risks move to the next stage of development and can also refine more specific issues through the information collected from online opinion reviews, thus facilitating and improving the enterprise crisis management capabilities. This paper not only provides the role of early warning for enterprises but also extracts the crux of the problem from the relevant negative evaluations of enterprises, which can promptly remind enterprises to make corresponding countermeasures and make them aware of the problem early to avoid dealing with sudden financial crises. The evaluation of the model effect cannot just look at the accuracy of the model. In addition, when it comes to predicting financial distress, people are generally more concerned with predicting the number of correct samples.
Financial risk refers to the possibility of losses in the financing, investment, operation, and profit distribution due to the occurrence of uncontrollable or undetermined events in these financial activities. In financial activities, the desire to achieve high returns inevitably corresponds to the need to take high risks [18]. Therefore, financial risk has both advantages and disadvantages, as it can bring high returns, but also has a high chance of causing serious crises. Financial risk cannot be avoided, but it can be controlled if the appropriate means are used. Financial crises are characterized by persistent losses and continuous unprofitability; serious cash flow problems, such as a break in the company’s capital flow, where the inflow of funds is smaller than the outflow of funds, making it impossible for the company to continue its operations; and, in addition, by low profits and poor performance, such as the inability to repay the money owed and the interest due to more debt.
Big data indicators are a new concept proposed by integrating the concepts of big data and network public opinion, and the common way of current research is to quantify sentiment classification and combine various information data volumes. Big data indicators also include financial indicators, and the term “big data indicators” is used here to distinguish them from traditional financial indicators, but the research on big data indicators is still in its initial stage, both in terms of data volume and content of big data are far from meeting the market demand, and the use of network text information can meet the basic needs [19]. The use of online text information can meet basic needs. The research of big data indicators in the field of stock has been very mature and has made remarkable achievements, but it is still in the initial stage in the field of enterprise financial early warning. The company’s capital flow is broken, and the capital inflow is less than the capital outflow, resulting in the company’s inability to continue operating. In addition, it is also reflected in the company’s little profit and poor performance, such as more debt resulting in the company’s inability to repay the amount and interest owed.
After the above process of testing, screening, calculation, and statistics, a complete financial warning index system is finally formed. The solvency is expressed by indicators x2, x3, x4, and x5; profitability is expressed by indicators x7 and x10; x13 and x14 are indicators reflecting cash flow; the capital structure is expressed by indicators x15 and x16; operating capacity is expressed by indicators x31 and x32; and network sentiment indicators are expressed by P1, P2, and P3. The indicator system contains two parts: financial indicators and network commentary sentiment indicators, of which 7 are financial indicators and 3 are network commentary sentiment indicators, as shown in Figure 2. The pressure data and pressing area data of the screen reflect the physiological characteristics of the user’s finger; the acceleration data, magnetic field data, and gyroscope data reflect the change of the direction of the smart device over time during the movement of the smart device and its movement trajectory in space.
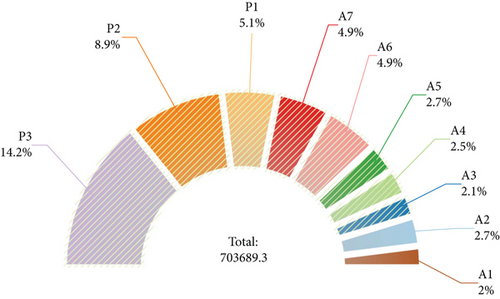
Positive sentiment index P1 = number of positive comments of the company/total number of comments of the company; negative sentiment index P2 = number of negative comments of the company/total number of comments of the company; and P3 is the total number of valid comments. For example, if the number of positive comments of STB (C600074) is 2146, the number of negative comments is 3869, and the total number of comments is 6015, then P1 = 0.35677, P2 = 0.64323, and P3 = 6015.
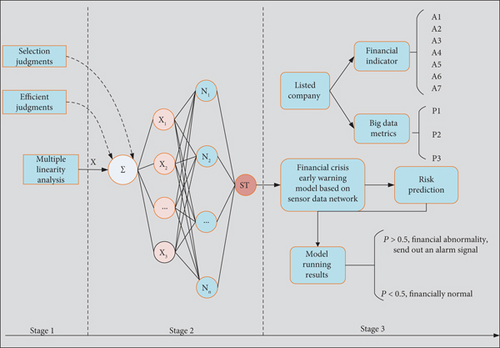
Support vector machines are not able to make selection judgments directly on the already available samples and need to learn the known samples effectively first, and only when the model has learned these features can it make efficient judgments. Therefore, in this paper, the overall sample is divided into two parts, one part is used to train the model and the other part to test the accuracy of the model. Two types of enterprises with and without financial machines in crisis will appear in the two data sets [20]. The collected information is sent to the cloud server through the wireless transmission module, and the cloud server is then forwarded to the Internet of Things cloud platform for storage and display. The user can use the mobile phone or computer to obtain the company’s financial-related data and actuator status information through the cloud platform and remotely control the field actuator. The support vector machine model abstracts the enterprise financial warning problem and uses the model to learn the data features in the training set, to determine the optimal classification hyperplane for the two enterprise samples, as well as the kernel function and the relevant parameters for finding the optimal one. Finally, the decision function of the big data-based enterprise financial early warning model can be obtained based on these. The financial crisis early warning model based on a sensor data network is shown in Figure 3.
6. Results and Analysis
6.1. Smart Sensor Data Network Model Performance Test
In this section, the performance of the sensor system platform itself is analyzed, and the performance of the system platform, such as noise level and stability, is analyzed by measuring the output of the sensor system platform under different inputs. Without loss of generality, this chapter applies the sensor system platform to the digitization and intelligence of a bridge load cell to realize an intelligent weighing system. Through experiments, this chapter analyzes the noise level, stability, and related static indicators of the smart weighing system and calculates the integrated error of the smart weighing system. It also includes unstructured data that has an equally large impact on the financial decisions of business stakeholders. Reasonable storage and utilization of unstructured data and the use of unstructured data to assist financial data in decision-making are the second challenge brought by the data age. Noise levels of the sensor system platform are at zero input and 200 mV input. The zero input of the system platform is achieved by shorting the differential input of the digitizing module, and the 200 mV input is achieved by a resistor-built bridge, where the bridge is designed with an output impedance of 350 ohms, which matches the output impedance of a conventional analog load cell. As shown in Figure 4, the output data of the sensor system platform and its peak-to-peak noise plot when the differential input signal of the sensor system platform is zero at the A/D data rates of 2.5 SPS and 400 SPS. The blue color represents the raw data output from the digitizing module, and the red color represents the filtered data output from the dynamic measurement task of the software system.
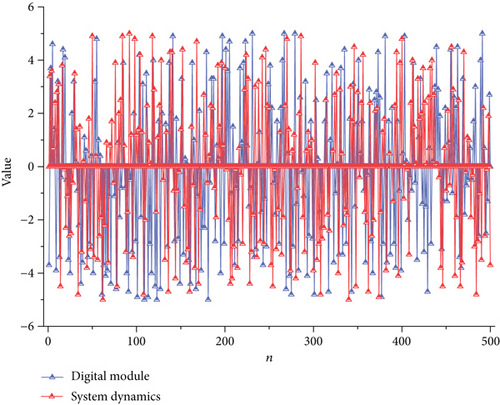
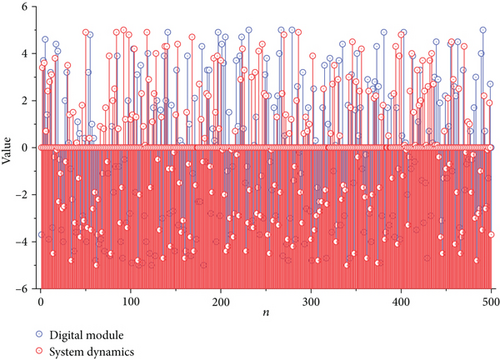
The experimental results show that the raw data is greatly affected by the A/D data rate, and there is a large attenuation of the raw data at the 400 SPS data rate. The reason for the unstable output and high noise level may be the unreasonable way of generating the 200 mV input voltage. The bridge built through the resistor may have a large noise level, thus affecting the performance of the sensor system platform. The input voltage of the A/D sensor at a data rate of 2.5 SPS is calculated to be about 2.2 V, which is numerically the same as the 200 mV input amplified 11 times by the signal conditioning module. Therefore, compared to the output of the digitizer module at a data rate of 2.5 SPS, there is a degradation of the digitizer module at a data rate of 400 SPS. Since the higher the A/D data rate, the higher the frequency of the global chopping, the higher the chopping frequency may be the cause of the attenuation.
And give the authentication result, if the user passes the authentication, it is allowed to continue to perform subsequent access operations, otherwise, explicit authentication is performed. The performance of the prototype was tested in terms of CPU usage, memory usage, and energy consumption using the Android Studio tool for Windows and the pyCharm tool. The prototype was used by a volunteer for about ten minutes to test the CPU usage, memory usage, and energy consumption during the process. The CPU usage of the implicit authentication prototype system running on the smart terminal was 10% on average, the memory usage was about 49.8 MB, which was about 0.8% of the total memory, and the energy consumption of the smart terminal was also at a very low level. As shown in Figure 5, the results of the model system memory usage statistics are shown.
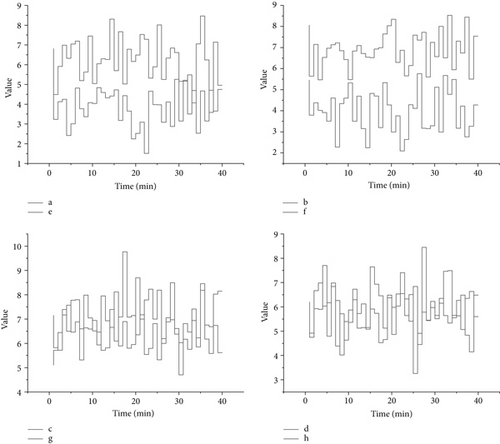
The volunteer operated the smart terminal for about ten minutes and kept opening and closing the application during this period, opening the application a total of 53 times, and the prototype system collected sensing data for application identification. The CPU occupancy during this process was about 14.5%, memory occupancy was about 2346 MB, accounting for 14% of the total memory, GPU occupancy was about 19%, and GPU memory occupancy was about 26.4%. The part that displays the data and transmits the data to other systems or units for control and management is called the data communication output part. The serial connection of the above four parts is called the bus interface part.
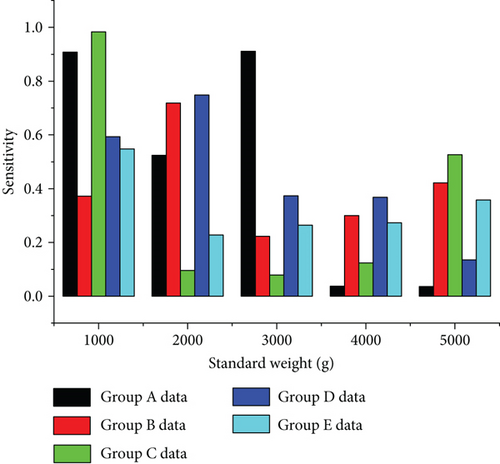
To check the actual performance of the sensor system platform, this subsection combines the sensor system platform and the bridge load cell to form an intelligent weighing system. The range of the bridge load cell is 5000 g. Therefore, the maximum input of the intelligent weighing system is 5000 g. This subsection analyzes the noise level, static indicators, and integrated errors of the intelligent weighing system using standard weights as input.
As shown in Figure 6, the slope of the input-output curve of the smart sensor data network system is its sensitivity. The sensitivity trend of the three sets of data is the same. The sensitivity of the intelligent sensor data network system varies at different stages of its range, and the sensitivity decreases with the increase of the input. Therefore, it is reasonable to use the segmentation method when calculating the standard input weight from the raw data of the intelligent sensor data network system.
To achieve intelligent perception that combines high precision, high speed, diversity, and flexibility, traditional sensors are in the process of transforming into new sensors. In this chapter, the implementation details of the sensor data network model system are described, and the prototype system is tested in terms of functionality and performance. The technical details of Android-side sensing data collection and model deployment are discussed for implicit user authentication based on physiological behavior features, and the technical details of graphical interface presentation, sensing data collection, and launch window. The technical details of the graphical interface display, sensor data acquisition, launch window deployment, and application recognition deployment are discussed. Finally, the functions and performance of the prototype system are tested to verify the feasibility of the theoretical results presented in this paper.
6.2. Empirical Study on the Prediction of Early Warning Models for the Financial Management of Listed Companies
For some enterprises with financial problems or potential financial risks, through the observation and in-depth analysis of financial and nonfinancial data, it is possible to find that certain indicators have abnormal values, i.e., through the horizontal comparison method, the value of the enterprise’s financial indicators are compared with other enterprises and found to be much higher or lower than the industry average. Outlier warning is to take the abnormal value as the benchmark, use the enterprise financial index system as the basis for analysis, judge the reasonableness of the abnormal index, and further analyze the reasons for the abnormal index in combination with other financial indexes or enterprise business reports and other materials. Due to the high difficulty of obtaining nonfinancial indicators, the range of nonfinancial indicators that can be selected is wide, the standards are not uniform, and each company has different degrees of sensitivity to different indicators, so it is difficult to meet the needs of different enterprises for indicators. The outlier analysis method needs to be based on the analysis of enterprise financial indicators, and the reasonable establishment of indicators is the key to the function of outlier analysis. The current financial or nonfinancial indicators of an enterprise do not show abnormalities, but its future development often deserves the attention of managers, that is, through the vertical comparison method, based on the enterprise’s historical data to make a forecast of the future development of the enterprise, for the indicators with a downward trend of early warning.
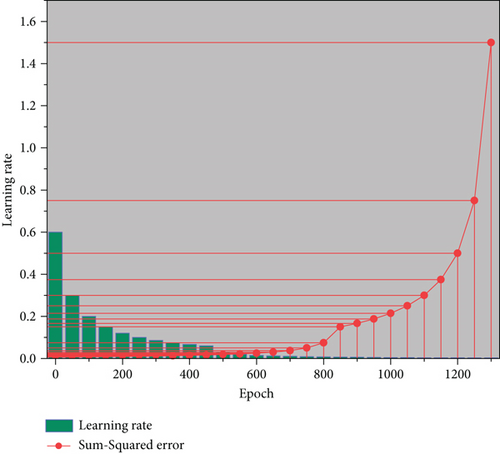
The binary classification model has two classification results: positive class and negative class. In this paper, the positive class sample is company X, and the negative class sample is a normal company. According to the predicted category of the model and the actual category of the sample, four results can be obtained: true positive (TP), false positive (FP), true negative (TN), and false negative (FN). If the predicted category and the actual category agree, it is true; if they do not agree, it is false. The confusion matrix of classification results can be obtained by using TP, FP, TN, and FN to represent the number of corresponding outcomes. In this paper, we use the estimated sample data from the previous study as training samples to train the established network, and the fast-training method is used for training, i.e., the train box training function in the MATLAB toolbox is used for training. After repeated experiments, we use the following parameters in training: the target error is 0.02; the learning rate is 0.01; the ratio of increasing learning rate is 1.05; the rate of learning rate decrease is 0.7; the momentum factor is 0.76; the maximum error rate is 1.04. The variation of the network error and learning rate with the number of training steps is shown in Figure 7.
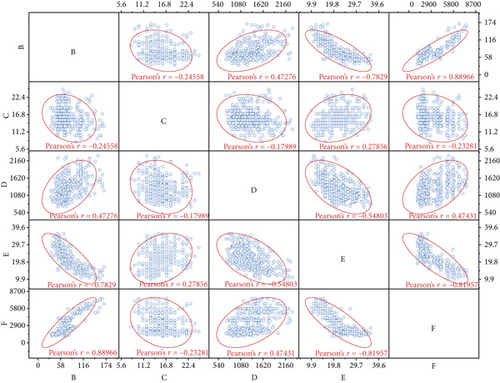
When a company uses a model to assist in making financial decisions, the early warning capability of the model should be relatively smooth to maintain, and it can support the processing work of massive data. The kernel function selected by the AdaBoost algorithm is tested for its ability to handle nonlinear relationships and the parallel algorithm of the AdaBoost algorithm. In the MATLAB environment to construct a scatter matrix graph with nonlinear relationships, as shown in Figure 8, the figure can be seen in the two types of scattering 900, given that the goal is to test the effectiveness of the kernel function in the support vector machine. So, in the selection of scattering, no need to consider the specific meaning of the scatter, the specific meaning here is the economic sense, but from the scatter distribution can be seen to have a certain nonlinear distinguishable relationship. This experimental study uses the AdaBoost algorithm to differentiate the scattered points by edge delineation. It can be visualized from Figure 8 that although there are some differentiation errors near the edges, the variables with nonlinear distinguishable relationships can be well distinguished in general.
Although most of the evaluation indexes of financial distress forecasting models use the accuracy rate, in practical application, the evaluation by the accuracy rate of the model alone usually does not meet the realistic needs, especially in the case of unbalanced sample data, and the accuracy rate does not serve as a good indicator to evaluate the forecasting effect of the model. There is a serious imbalance in the number of samples among listed companies in China. In this case, if all samples are predicted as negative samples, we can get a 95% accuracy rate, but the accuracy rate obtained at this time has no practical significance, and the evaluation of the accuracy rate on the model is invalid, so the evaluation of the model effect cannot only look at the accuracy rate of the model. In addition, in the problem of financial distress prediction, in general, people are more interested in not how many samples are correctly predicted, but in how many of the samples that the model used considers to be in financial crisis are really in financial crisis, and how many of all the companies in financial crisis are identified by the model.
7. Conclusion
In this paper, we construct a data network using smart sensors to collect information about listed enterprises in a comprehensive manner and build an early warning model for the financial management of listed enterprises based on the smart sensor data network. This paper also considers the concept drift and data distribution imbalance in the field of financial early warning and improves the existing ADASVM-TW model to construct the ADA-CSSVM-TW model based on the dynamic feature filtering of dynamic data sets and the cost-sensitive support vector sum as the base classifier. Both the change of variable deletion set in the double significance test and the detection of conceptual drift in the feature set demonstrate the existence of conceptual drift in the field of financial early warning. Big data tools can effectively increase the accuracy and comprehensiveness of the model for early warning of corporate financial crisis using nonfinancial data of the enterprise. Compared to traditional models that only study and analyze based on several financial data of the enterprise, the means of big data can make public opinion analysis of the company’s stock bar and quantify it into numbers, which is a more accurate research result. The construction of the financial early warning model based on big data mainly uses the Internet opinion sentiment indicators to make up for some of the lack of information in the financial indicators, which can play a role in improving the prediction accuracy of the financial early warning model. Due to my limited knowledge and research ability, as well as the objective limitations of the research on this topic, the sample selection process, due to objective limitations, resulted in the inability to select a completely uniform sample of the main business, making the results inevitably have some errors. The sample with the same main business can be studied in future research.
Conflicts of Interest
The author declares that they have no known competing financial interests or personal relationships that could have appeared to influence the work reported in this paper.
Acknowledgments
This work was supported by School of Business, Xinyang Vocational and Technical College.
Open Research
Data Availability
The data used to support the findings of this study are available from the corresponding author upon request.


