GCP-Net: A Gating Context-Aware Pooling Network for Cervical Cell Nuclei Segmentation
Abstract
Accurate segmentation of cervical nuclei is an essential step in the early diagnosis of cervical cancer. Still, there are few studies on the segmentation of clustered nuclei in clusters of cells. Because of the complexities of high cell overlap, blurred nuclei boundaries, and clustered cells, the accurate segmentation of clustered nuclei remains a pressing challenge. In this paper, we purposefully propose a GCP-Net deep learning network to handle the challenging cervical cluster cell images. The proposed U-Net-based GCP-Net consists of a pretrained ResNet-34 model as encoder, a Gating Context-aware Pooling (GCP) module, and a modified decoder. The GCP module is the primary building block of the network to improve the quality of feature learning. It allows the GCP-Net to refine details of feature maps leveraging multiscale context gating and Global Context Attention for the spatial and texture dependencies. The decoder block including Global Context Attention- (GCA-) Residual Block helps build long-range dependencies and global context interaction in the decoder to refine the predicted masks. We conducted extensive comparative experiments with seven existing models on our ClusteredCell dataset and three typical medical image datasets, respectively. The experimental results showed that the GCP-Net obtained promising results on three evaluation metrics AJI, Dice, and PQ, demonstrating the superiorities and generalizability of our GCP-Net for automatic medical image segmentation in comparison with some SOAT baselines.
1. Introduction
Cervical cancer is the fourth most common cancer among women worldwide [1]. According to data from the Global Cancer Observatory (GCO) in 2018, there were an estimated 570,000 new cases and 311,000 deaths due to cervical cancer [2]. According to the latest data from GCO, it estimates that there will be 604,127 new cases of cervical cancer in 2020. Therefore, early detection of cervical lesions is of great significance in reducing cervical cancer mortality. Cervical routine Pap smear or liquid-based cytology (LBC) [3] is the most popular screening method for preventing and early detection of cervical cancer. It has been widely used and has dramatically reduced its incidence and deaths [4]. However, most countries’ existing leading smear screening technology still uses manual reading, which is very troublesome and prone to human error [5]. Therefore, in the past few decades, much research has been devoted to creating a computer-aided reading system based on automatic image analysis [6]. This system automatically selects potential abnormal cells in a given cervical cytology specimen, and finally, the cytopathologist completes the classification. This task includes three steps: cell (cytoplasm and nucleus) segmentation, feature extraction/selection, and cell classification. Precise cell nucleus segmentation is a prerequisite and indispensable part of the computer-assisted analysis of cervical cells and diagnostic decisions.
Some previous conventional methods [7–10] focused on segmenting overlapping nuclei, but they generally used some indirect processing methods. In addition, some ways [11, 12] use shape priors to segment cells in overlapping clumps, but due to the various complex and challenging situations in overlapping clusters (as shown in Figure 1), the shape priors and standard set of boundary patterns imposed in the literature do not provide sufficient shape details for segmentation of overlapping parts. Therefore, these traditional methods cannot solve the challenging overlapping cluster segmentation problem.
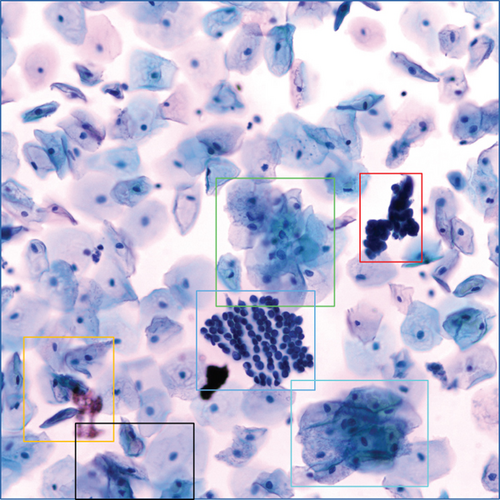
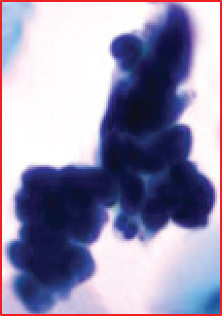
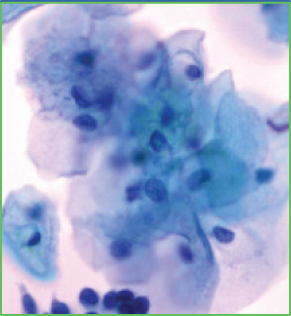
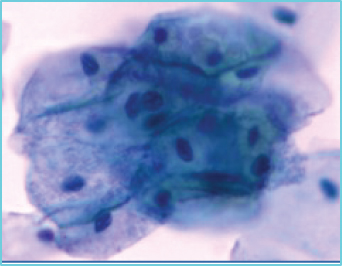
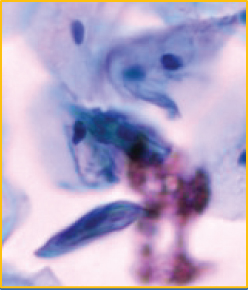
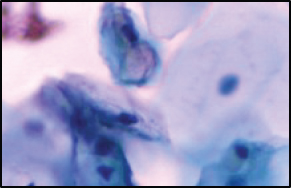
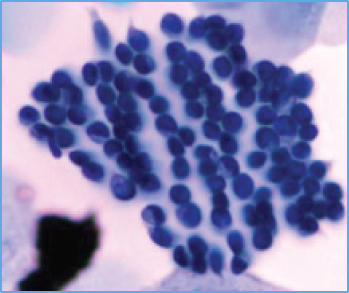
When using deep learning to deal with possible abnormalities in cervical cells, any deep learning model established will be limited by the number and quality of the cell samples in the dataset used. However, the primary publicly accessible datasets currently used in many studies of cervical cytology have been oversimplified and contain a lot of artificially preprocessed data. For example, the nuclei of those datasets are almost separate, their shapes are mostly uniform and have precise contours, and the color difference between the nucleus and the cytoplasm is noticeable [13]. Based on the above datasets, segmenting the nucleus is relatively easy. Most of the papers [14–18] dedicates to the segmentation of overlapping cytoplasm, and there is a small part of work [19–21] also focused on the segmentation of cell nuclei. However, the actual clinical data is much more complicated than the above dataset, as shown in Figures 1(b)–1(g). There are often overlapping or deformed nuclei in smears. The color of some nuclei is similar to the color of the overlapping cytoplasm, etc. These characteristics all lead to the difficulty of cell nucleus segmentation in cervical cell images.
We obtained a set of cervical cell images based on an LBC test from a hospital and a biomedical testing company for this paper. We randomly selected 265 origin images of size 2048 × 2048 from different slides, as shown in Figure 1(a). The presence of cell clusters and the intercellular overlapping and self-folding, diverse shapes and sizes of nuclei, nuclei with blurred contours, and similar colors of nucleus and cytoplasm remains a significant obstacle to the accurate segmentation of single seats. We crop the clustering units of different sizes from the original images to form the dataset we deal with in this paper. Each image in the dataset has a segmentation ground truth marked by professional pathologists. As shown in Figures 1(b)–1(g), several cases are challenging to handle. Therefore, we propose a GCP-Net deep-learning network to process cervical clustered cell images of challenging issues. The U-Net-based Network proposed in GCP-Net strategically incorporates multiscale context gating information and context-aware attention features and decoder features into the final feature map to correctly classify each pixel into the background and nucleus pixels.
- (1)
A Gating Context-aware Pooling (GCP) Module enables to refine details of feature map leveraging multiscale context gating and Global Context Attention for the spatial and texture dependencies, improving the quality of feature learning
- (2)
A decoder block including Global Context Attention- (GCA-) Residual Block helps build long-range dependencies and global context interaction in the decoder to refine the predicted masks
- (3)
Extensive experimental results on our complex ClusteredCell dataset and three typical medical image datasets demonstrate the superiorities and generalizability of our GCP-Net for automatic medical image segmentation in comparison with some state-of-the-art baselines
2. Related Work
Cell nucleus segmentation is researched in academia because its results help judge pathology and medical diagnosis. This section will review the segmentation methods for cervical cell nuclei and other typical medical image nuclei.
In the past few decades, many cervical cell nuclei segmentation methods have been proposed, most of which are based on traditional algorithms, such as watershed algorithm [22], edge enhancement [23, 24], level set [25], clustering [26, 27], and thresholding [28]. For example, [23] uses a segmentation method based on a series of edge enhancement techniques, which performed poorly in blurred nucleus contours. [27] uses a contrast-based adaptive version of the mean-shift and SLIC algorithm and uses an intensity-weighted adaptive threshold to segment cell nuclei in the Pap smear images. In many cases, the above traditional method cannot handle well when images of cervical cells with irregular shapes and sizes appear. With the prevalence of machine learning, the performance of deep learning networks has also improved. In the most challenging cervical cell nuclei segmentation problem, the performance of deep learning networks is better than traditional algorithms [19–21, 29]. [19] used the Herlev dataset, combined Mask-RCNN for rough segmentation, and LFCCRF to refine the nuclei boundary. In [20], both the cytoplasm and the nucleus were segmented, using the combined segmentation method of superpixel and CNN-based network. In this paper, they used a private dataset. The author [21] developed a deep learning method through a multiscale CNN for feature extraction and graph division of cell nucleus segmentation. In this experiment, they privately collect the dataset. The author [29] uses the CNN Bi-path Architecture to segment Pap smear images and classify cervical cancer. The first path is segmentation based on CNN architecture. The second path is a classification process to test the segmentation results by applying the KNN and ANN methods. This method integrates segmentation and classification processing, but it is not suitable for high overlap cervical cell images.
To detect nuclei in multiorgan nuclei segmentation datasets (MoNuSeg [30], CoNSeP [31], and CPM-17 [32]), several methods have been used, such as U-Net [33], CE-Net [34], Triple U-Net [35], CIA-Net [36], SRPN [37], and Hover-Net [31]. U-Net [33] has an encoder-decoder design with skip connections to incorporate low-level information, applied to many segmentation tasks in medical image analysis. The recently proposed CE-Net method [34] extends U-Net by using an enhanced network structure with DAC and RMP Block for medical image segmentation. Triple U-Net [35] leveraged the optical characteristics of hematoxylin and eosin (H&E) staining and proposed a hematoxylin-aware Triplet U-Net, which makes predictions concerning the extracted hematoxylin component in the image. By subtracting instance boundaries from the segmentation maps, overlapped nuclei can be separated; the downside is that such a subtraction operation may lose segmentation accuracy [38]. CIA-Net [36] is a contour-aware CNN model for predicting more precise nucleus boundaries. Hover-Net [31] represents nucleus instances using pixel-to-centroid distance maps in horizontal and vertical directions. SRPN [37] uses the similarity region proposal network to detect nuclei and cells in histological images. The embedding layer proposed here can help the network learn discriminating characteristics based on learning similarity. The performance of these approaches is affected by the empirically designed postprocessing strategies.
Although the methods described above have helped make significant progress in cytology nucleus segmentation, there is still a need to develop more practical and effective strategies.
3. Methods
In this section, we demonstrate the architecture of our GCP-Net and the details of comprising modules.
3.1. Overall Architecture
We design GCP-Net based on the overall architecture from CE-Net [34], which is a modified version of U-Net [33]. As shown in Figure 2, we use the ResNet-34 Block pretrained from ImageNet to replace the encoder block in the original U-Net network. We only retain the first four feature extraction module blocks of ResNet-34. The GCP module proposed in this paper generates more high-lever semantic feature maps, introducing its essential components in Section 3.2. In addition, this paper presents a feature decoder block consisting of GCA-Residual Block, concatenate operation, and transpose convolution. We will give the details of the decoder block in Section 3.3.

3.2. GCP Module
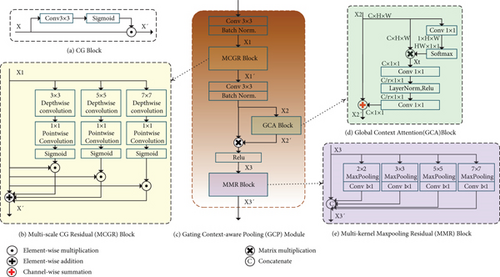
The GCP module is a newly proposed module, as shown in Figure 3(c). This module extractor semantic information generates more high-level feature maps.
3.2.1. Multiscale CG Residual (MCGR) Block
where X ∈ Rn is the input feature vector, σ is the element-wise Sigmoid activation, and ⨀ is the element-wise multiplication. W ∈ Rn×n and b ∈ Rn are trainable parameters. The vector of weights σ(W∗X + b) ∈ [0, 1] represents a set of learned gates applied to the individual dimensions of the input feature X. Through the element-wise multiplication and training between the weight vector and X, the input feature representation X is transformed into a new representation X′ which has the more powerful discriminant capability.
To mitigate the limited receptive field of invariably local operators of the Context Gating module, we propose a Multiscale CG Residual (MCGR) Block, as shown in Figure 3(b). MCGR Block consists of three parallel branches with depth-wise separable convolution [40] and a residual limb. Each branch with depth-wise separable convolution has a different convolutional kernel size to provide various fields. Here, we set the convolutional kernel of sizes 3, 5, and 7 for each branch. Then, each branch with depth-wise separable convolution produces attention weights on a specific scale. After that, attention weights are element-wise multiplied to feature maps to obtain weighted feature maps in different resolutions. Finally, MCGR Block fuses the weighted feature maps and input feature map of the residual branch by element-wise addition for integrating multiscale information.
where X1′ is the output feature and ∗ and ∘ represent the point-wise convolution and depth-wise convolution, respectively. Wp and bp are the point-wise convolution parameters. and are the depth-wise convolution parameters. m ∈ {3, 5, 7} represents three different sizes of the convolutional kernel.
3.2.2. Global Context Attention (GCA) Block
Recent works have shown that contextual information is helpful for models to predict high-quality segmentation results. Modules that could enlarge the receptive field, such as ASPP [41], DenseASPP [42], and CRFasRNN [43], have been proposed in the past years. Furthermore, the attention mechanism has been widely used for increasing model capability. Therefore, we add a GCA Block [44] after the convolutional operation of the multiscale fusion information. It reweights every feature accordingly to create a more accurate feature map. In this way, the network becomes more sensitive to essential elements that significantly improve network performance.
Figure 3(d) shows the detail of the GCA Block. Given an input feature map X2 ∈ RC×H×W, the calculation details are summarized as follows:
3.2.3. Multikernel Maxpooling Residual (MMR) Block
The MMR Block structure is illustrated in Figure 3(e). Generally, maxpooling operation just employs a single pooling kernel, such as 3 × 3. As we know that the size of the receptive field roughly determines how much context information we can use, so in this paper, we use MMR block with four different kernel sizes: 2 × 2, 3 × 3, 5 × 5, and 7 × 7. Each branch with a different kernel outputs the feature maps with various receptive fields. To reduce the weight and computational cost, we use 1 × 1 convolution after each pooling layer. In this way, if the number of channels of the original feature map is N, the dimension of the new feature map is reduced to 1/N. Then, we upsample the new feature map through bilinear interpolation and finally get the feature with the same size as the original feature map. Finally, we concatenate the original feature X3 and the map obtained by upsampling to output X3′.
3.3. Feature Decoder Module
We use the feature decoder module to recover the high-lever semantic features extracted from the feature encoder and context extractor modules. As illustrated in Figure 2, it mainly includes four decoder blocks, a 4 × 4 transposed convolution, two 3 × 3 convolutions with batch normalization (BN), and a sigmoid consecutively. In addition, the feature decoder module outputs a mask with the same size as the original input based on the skip connection and the decoder block. Next, we will introduce the composition of the feature decoder module.
3.3.1. Decoder Block
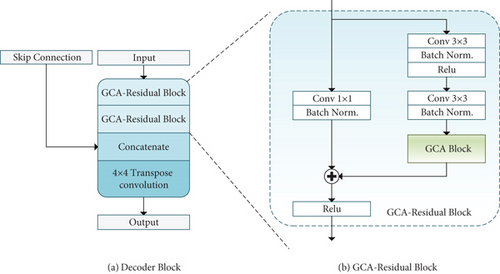
Similar to [45], we adopt an efficient block to enhance the decoding performance. Figure 4(a) shows that the input feature map is first fed into two consecutive GCA-Residual Block and then concatenated with the skip connection. The skip connection brings detailed information from the encoder to the decoder to compensate for the feature loss due to continuous pooling and stride convolution operations. After the concatenate operation, the output feature map is fed to a 4 × 4 transpose convolution, and its spatial dimensions will double.
3.3.2. GCA-Residual Block
A deeper network can significantly improve the model’s performance, but the increase in network depth will cause gradient disappearance or gradient explosion [46]. We use the shortcut connection between layers in the residual learning paradigm to deal with this problem. The GCA-Residual Block (see Figure 3(b)) consists of two 3 × 3 convolutions, a GCA Block and an identity mapping, where each convolution layer follows a batch normalization (BN) and a rectified linear unit (ReLU) activation function. The GCA Block (see Figure 3(d)) acts as a context attention mechanism instructing the network to select critical feature units in each feature map and ignore the unrelated units. We use identity mapping to connect the input and output of the GCA Block.
3.4. Evaluation Metrics
where p and g denote the prediction segment and the ground truth, respectively, in instance level. IoU represents the intersection over the union. When the IoU > 0.5 of each (p, g) pair, the result can be regarded as unique. True Positives (TP), False Positives (FP), and False Negatives (FN) represent matched pairs of segments, unmatched predicted segments, and unmatched ground truth segments, respectively.
4. Experiments
4.1. Dataset
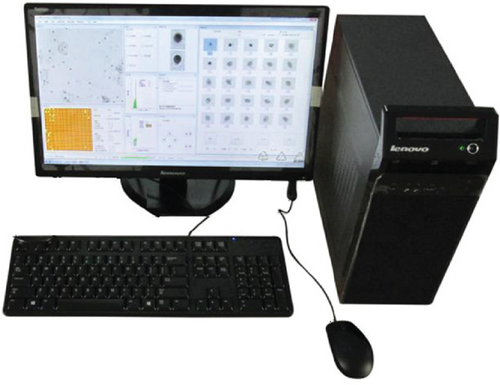
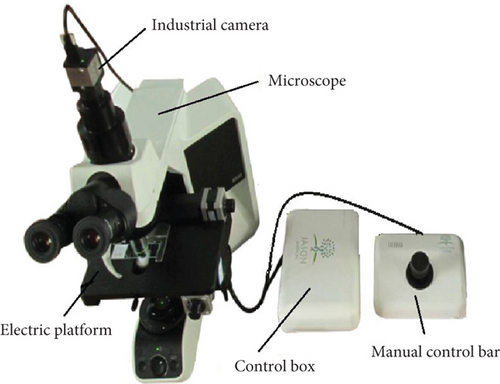
In this work, we obtained a group of clinical cervical cell images based on the LBC test from the 2nd affiliated hospital of Harbin Medical University and Harbin precise yuan test company. We use an automatic pathology scanner to acquire images, as shown in Figure 5. The master control center is a computer equipped with 8 G memory, i5-4590 CPU, and 3.3 GHz, and the image acquisition module is shown in Figure 5(b). The industrial camera is a CMOS camera with an image acquisition resolution of 2048 × 2048 pixels, an acquisition frame rate of 50 frames per second, and a grayscale of 256. The objective lens magnification of the microscope is 20 times. The electric platform can be set to automatic and manual control modes. The automatic control mode can control the electric platform to move, focus, and control the camera to capture images. The image capture begins in the center of the slide and moves automatically as a snake. The pixel overlaps are 30, and each slide can take over 400 images. In manual control mode, manually operating the manual control bar, positioning, and grabbing images are realized.
In this paper, we randomly selected 265 clinical cervical cell images from different slides and coarsely segmented the region of the cell clusters, yielding 2363 clustered cell images with different sizes ranging from 150 to 500 pixels. Then, we randomly selected 568 of them as the test set. Finally, we named this dataset ClusteredCell.
- (1)
Simple. Nucleus had high contrast with cytoplasm, apparent nucleus, and greater distance between each nucleus
- (2)
Normal. Nucleus had low contrast with cytoplasm, the nucleus is faintly visible and pale-colored, multinuclear, or neutrophil impurities; nucleoli or nuclear groove is prominent; cytoplasm is dark; cytoplasm is vacuolar
- (3)
Difficult. There is a significant overlap between the nuclei of most of the cells, with the peripheral nuclei faintly visible and the interiors dark in color
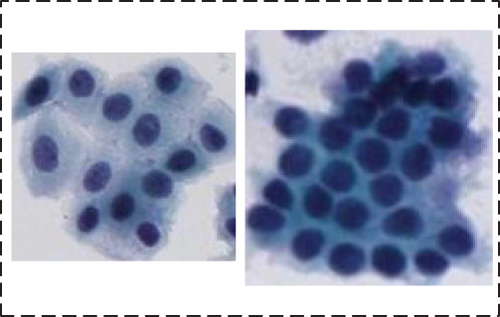
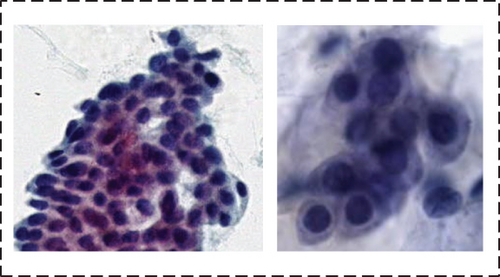
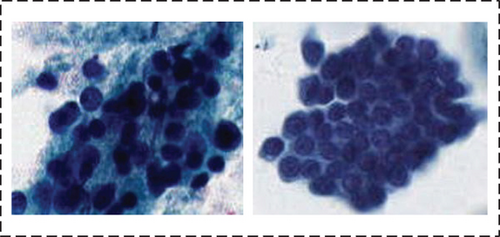
The details of our dataset are shown in Table 1.
| Category | Original image number | Clustered cell image | Group | Number |
|---|---|---|---|---|
| The training set | 265 | 1795 | Simple | 200 |
| Normal | 1500 | |||
| Difficult | 95 | |||
| The test set | 568 | 568 |
- (1)
MoNuSeg [30]. This dataset contains 30 images of size 1000 × 1000 cropped from whole slide images of seven different organs. We use the same image split with the existing methods [46] (16 for training and 14 for testing, each image is 224 × 224 pixels)
- (2)
CoNSeP [31]. This dataset contains 41 H&E stained images with 1000 × 1000 pixels at 40x magnification extracted from 16 CRA WSIs. CoNSeP dataset is split into train set (n = 27) and test set (n = 14) as employed in the original work [31], and each image is cropped into 256 × 256 pixels in the experiment
- (3)
CPM-17 [32]. This dataset contains 40 pathological images with pixel-level annotations, of which 32 are in the training set, and eight are in the test set. Each image, scanned at 40x magnification, has 500 × 500 pixels. In addition, all images in the train set and test set are also cropped into the size 256 × 256
4.2. Implementation Details
The GCP-Net prepares on an NVIDIA GeForce RTX 2080Ti GPU and Intel Core i7-7700 3.60GHz CPU using the PyTorch 1.8 framework. We trained this model for 100 epochs using the Adam optimizer, and the learning rate for all experiments was 2e-4. The loss function uses a combination of binary cross-entropy [50] and dice loss [51]. All the images fed into networks were resized to 448 × 448. The data augmentation strategies used in the training and testing phases are the same as the reference [34]. In the training phase, each image in the original dataset augments eight images, including horizontal, vertical, diagonal flip, and random shifting image, expanding the image from 90% to 110% or in HSV color space color dithering. In the testing phase, like that in the reference [34, 52, 53], the test augmentation strategy is also adopted. That means each test image has to be predicted eight times, and then, we average the predictions to get the final prediction mask. All baseline methods use the same strategy during the training and testing phase.
4.3. Ablation Study
- (1)
U-Net. Basic network
- (2)
Backbone. In the proposed method, we replace the encoder block of U-Net with a pretrained ResNet-34, as shown in Figure 2. We define this modified U-Net with pretrained ResNet-34 as the backbone
- (3)
Backbone +Decoder Block. We replace the original decoder layer with the proposed decoder block
- (4)
Backbone + GCP. We integrate the GCP module in the backbone
- (5)
Backbone + Decoder Block +GCP. This is the final GCP-Net architecture, with the GCP module and the decoder block are used in combination
Table 2 lists the ablation results of these five configurations performed on our ClusteredCell and two public datasets. Below, we conduct a detailed analysis of different model architectural settings and verify them through the five network configurations.
| Model | ClusteredCell (ours) | MoNuSeg | CoNSeP | ||||||
|---|---|---|---|---|---|---|---|---|---|
| AJI | Dice | PQ | AJI | Dice | PQ | AJI | Dice | PQ | |
| U-Net | 0.639 | 0.827 | 0.624 | 0.526 | 0.780 | 0.494 | 0.485 | 0.741 | 0.408 |
| Backbone | 0.667 | 0.881 | 0.672 | 0.642 | 0.827 | 0.594 | 0.461 | 0.797 | 0.448 |
| Backbone + Decoder Block | 0.674 | 0.880 | 0.680 | 0.647 | 0.828 | 0.598 | 0.488 | 0.777 | 0.467 |
| Backbone +GCP | 0.680 | 0.881 | 0.681 | 0.646 | 0.831 | 0.597 | 0.487 | 0.790 | 0.452 |
| Backbone + Decoder Block +GCP (proposed) | 0.683 | 0.880 | 0.687 | 0.651 | 0.830 | 0.601 | 0.586 | 0.835 | 0.563 |
4.3.1. Effectiveness of Pretrained ResNet-34
Fine-tuning from the pretrained ResNet-34 backbone network makes our network in a good initial state to quickly adapt to new modalities of medical images using a relatively small number of training data. Table 2 shows the performance of the modified U-Net with pretrained ResNet-34 as a backbone. We find that although pretrained ResNet-34 introduces almost no additional parameters and calculations, the gain of segmentation performance is still very noticeable. In the ClusteredCell dataset, there have been 2.8%, 5.4%, and 4.8% increases in AJI, Dice, and PQ, respectively. In the MoNuSeg dataset, there has been 11.6%, 4.7%, and 10% increases in AJI, Dice, and PQ, respectively. In the CoNSeP dataset, despite a 2.4% decline in AJI, the Dice and PQ have increased by 5.6% and 4%, respectively.
4.3.2. Decoder Block’s Effectiveness
By replacing the original decoder layers with decoder block in the backbone, decoder block can quickly build long-range dependencies and global context connections in the decoder. As shown in Table 2, we can see that decoder block already achieves better performance than the backbone on three compared datasets with improvements of 0.7%, 0.5%, and 2.7% in terms of AJI score and 0.6%, 0.4%, and 1.9% in terms of PQ score, respectively. The result means that decoder block has better learning and generalization ability than previous methods. Therefore, the decoder block design based on GCA-Residual can effectively improve the segmentation performance.
4.3.3. Effectiveness of GCP Module
The multiscale CG Residual Block in the GCP module adds three multiscale context gating branches and fuses the multiscale feature information through a residual operation. The Global Context Attention block reweights feature information accordingly to create a more accurate feature map. The Multikernel Maxpooling Residual Block could encode the global information and change the combination way of the feature. It can be observed in Table 2 that the results of Backbone +GCP achieve AJI improvements of 1.3%, 0.4%, and 2.6% and PQ improvements of 0.9%, 0.3%, and 0.4% on ClusteredCell, MoNuSeg, and CoNSeP compared to Backbone, showing a 0.4% improvement on MoNuSeg in terms of Dice. That means the GCP module brings more effective feature representations fusion of multiscale branches and helps achieve better segmentation performance.
4.3.4. Effectiveness of Decoder Block and GCP Module Combination
The proposed GCP-Net architecture combines decoder block and GCP module. As a result, we can observe the performance improvement of GCP-Net in AJI, Dice, and PQ in Table 2. It has obtained higher results than Backbone and Backbone + Decoder Block and Backbone + GCP.
4.4. Attention Module Comparison and Selection
In this paper, both the GCP module and decoder block use the attention module for giving feature maps with different weight values. In the process of selecting attention modules, we experimented with five state-of-the-art attention modules (Shuffle Attention [54], ECA Attention [55], CBAM Attention [56], SE Attention [57], and Global Context Attention [44]) in GCP-Net, respectively. The performance of the selected different attention modules is presented in Table 3. The experimental results show that using varying attention modules leads to different implementations results. Still, the differences are insignificant. From comparing the three metrics on the two datasets, it can be seen that Global Context Attention has the most outstanding performance.
| Attention model | ClusteredCell (ours) | MoNuSeg | ||||
|---|---|---|---|---|---|---|
| AJI | Dice | PQ | AJI | Dice | PQ | |
| Shuffle Attention [54] | 0.664 | 0.877 | 0.669 | 0.648 | 0.828 | 0.603 |
| ECA Attention [55] | 0.667 | 0.877 | 0.672 | 0.635 | 0.827 | 0.597 |
| CBAM Attention [56] | 0.671 | 0.879 | 0.677 | 0.638 | 0.825 | 0.599 |
| SE Attention [57] | 0.681 | 0.878 | 0.684 | 0.640 | 0.824 | 0.598 |
| Global Context Attention [44] | 0.684 | 0.880 | 0.688 | 0.651 | 0.830 | 0.601 |
4.5. Experiment Results
To evaluate the performance of the proposed models, we compared our proposed model to recent segmentation approaches. Those approaches have used in computer vision (U-Net [33], UNet++ [58], Attention U-Net [59]), medical imaging (CE-Net [34]), and also to methods specifically tuned for the task of nuclear segmentation (Hover-Net [31], CIA-Net [36], Triple U-Net [35]). Below, we present quantitative comparison results on four different biomedical imaging datasets.
4.5.1. Results on ClusteredCell Dataset
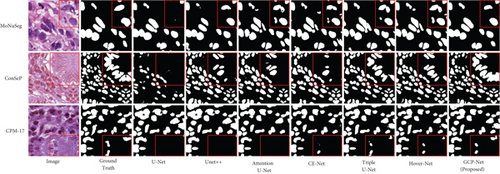
ClusteredCell is a private cervical cell nuclear segmentation dataset described in detail in Section 4.1. Comparing seven widely accepted segmentation methods with different backboned (see Table 4) shows that proposed method has improved performance than the SOTA methods (on the same train-test split).
| Model | ClusteredCell (ours) | MoNuSeg | CoNSeP | CPM-17 | ||||||||
|---|---|---|---|---|---|---|---|---|---|---|---|---|
| AJI | Dice | PQ | AJI | Dice | PQ | AJI | Dice | PQ | AJI | Dice | PQ | |
| U-Net [33] | 0.638 | 0.827 | 0.624 | 0.526 | 0.781 | 0.494 | 0.485 | 0.741 | 0.408 | 0.556 | 0.804 | 0.506 |
| UNet++ [58] | 0.654 | 0.858 | 0.646 | 0.620 | 0.814 | 0.568 | 0.556 | 0.828 | 0.536 | 0.649 | 0.852 | 0.608 |
| Attention U-Net [59] | 0.639 | 0.847 | 0.634 | 0.553 | 0.800 | 0.507 | 0.546 | 0.827 | 0.540 | 0.634 | 0.846 | 0.607 |
| CE-Net [34] | 0.669 | 0.878 | 0.671 | 0.538 | 0.801 | 0.503 | 0.489 | 0.754 | 0.439 | 0.647 | 0.871 | 0.619 |
| CIA-Net [36] | 0.672 | 0.869 | 0.653 | 0.623 | 0.815 | 0.578 | — | — | — | — | — | — |
| Triple U-Net [35] | 0.678 | 0.837 | 0.608 | 0.622 | 0.834 | 0.601 | 0.574 | 0.839 | 0.566 | 0.711 | 0.856 | 0.659 |
| Hover-Net [31] | 0.670 | 0.831 | 0.675 | 0.619 | 0.825 | 0.599 | 0.574 | 0.848 | 0.538 | 0.705 | 0.856 | 0.661 |
| GCP-Net (proposed) | 0.684 | 0.88 | 0.688 | 0.651 | 0.830 | 0.601 | 0.586 | 0.835 | 0.563 | 0.719 | 0.892 | 0.671 |
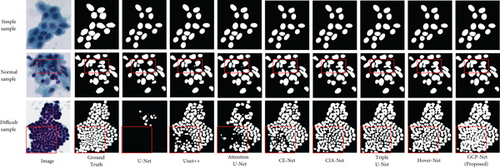
We also show three sample results in Figure 7 to visually compare our method with the other methods. The sample given in Figure 7 contains simple, normal, and difficult task. According to the results, the simple picture of the first row, each method obtained the segmentation results similar to ground truth. From the results of the second and third rows, we can see the difference in the processing results of each method, which shows that our method achieved the best segmentation results.
4.5.2. Results on MoNuSeg, CoNSeP, and CPM-17 Datasets
We evaluated our method by employing a completely independent comparison across the three most enormous known exhaustively labeled nucleus segmentation datasets, MoNuSeg, CoNSeP, and CPM-17, and utilized the metrics described in Section 4.1. The results are reported in Table 4, and we find that proposed method can successfully deal with unprocessed data in three public datasets. But it turns out that some methods perform poorly on unseen data, especially U-Net’s performance on all three datasets is worse than other competing methods. Triple U-Net and Hover-Net achieved competitive performance in all three generalization tests. In particular, Triple U-Net has proven to detect nuclear pixels successfully. It scores better than GCP-Net’s Dice on the MoNuSeg dataset and better than GCP-Net’s PQ score on the CoNSeP dataset. However, the overall segmentation result for GCP-Net is superior (as shown in Figure 8) because it can better analyze the image context information by introducing context-aware modules in the network’s feature extractor and decoder parts. Thus, it is better separating the cell nuclei.
In Figure 9 there is a box plot [60]. The box plot is a way to observe the overall shape of a data set. The central box shows the data between the rough quartiles, and a black line represents the average. “Whiskers” extends to the extremes of the data.

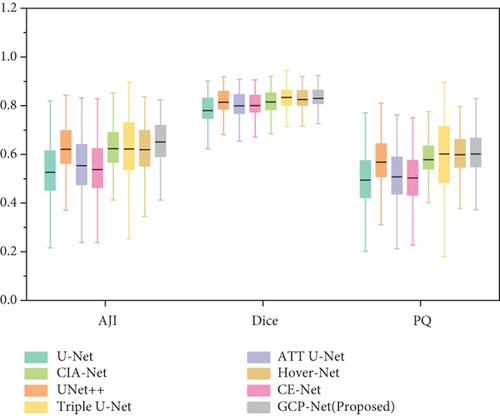
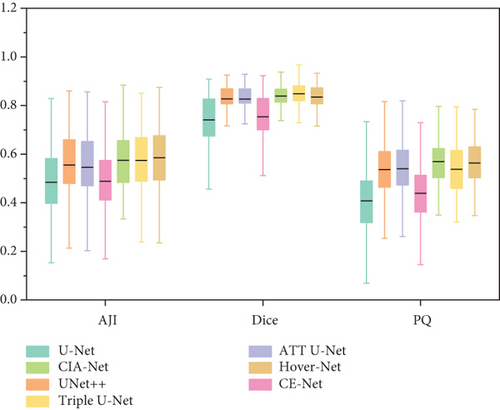
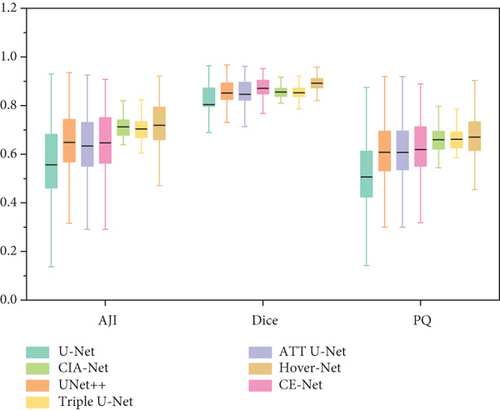
Box plot displays the variation of segmentation results in a statistical distribution. Figure 9 shows the performance of segmentation results of every image in the test set in different models on ClusteredCell, MoNuSeg, CoNSeP, and CPM-17 datasets, respectively. A large variation in performance between methods within each dataset is observed, especially in CoNSeP datasets, where there exists a large number of overlapping nuclei. It can be seen that proposed method outperforms the other methods, which validates the feasibility of applying our GCP-Net on different datasets.
5. Conclusions
Accurate segmentation of cell nuclei is an essential step in diagnosis and analysis. Segmentation of cluster cell nuclei in LBC testing has become a challenge in biology and medicine. In this paper, we purposefully propose a GCP-Net deep learning network to handle the challenging cervical cluster cell images. The proposed U-Net-based GCP-Net consists of a pretrained ResNet-34 model as encoder, a GCP module, and a modified decoder. The GCP module is the primary building block of the network to improve the quality of feature learning. It allows the GCP-Net to refine details of feature maps leveraging multiscale context gating and Global Context Attention for the spatial and texture dependencies. The decoder block includes that GCA-Residual Block helps build long-range dependencies and global context interaction in the decoder to refine the predicted masks. We used ablation experiments to discuss the effectiveness of the GCP module and the decoder block. We conducted extensive comparative experiments with seven existing models on our ClusteredCell dataset and three typical medical image datasets, respectively. The experimental results showed that the GCP-Net obtained promising results on three evaluation metrics AJI, Dice, and PQ, demonstrating the superiorities and generalizability of our GCP-Net for automatic medical image segmentation in comparison with some SOAT baselines. Although we obtained considerable accuracy in our experiments, this task can only be used as AI-assisted cytological screening during actual clinical diagnosis. The method helps with primary cytological screening or triage, and for challenging cases, physician confirmation is also required. Further research is necessary and significant. In the future, we will use contrastive learning methods to improve the performance of GCP-Net on more challenging biomedical images.
Conflicts of Interest
The authors declare that they have no conflicts of interest.
Acknowledgments
This work was supported in part by the Heilongjiang Provincial Key Laboratory of Complex Intelligent System and Integration and by the Natural Science Fund Project of Heilongjiang Province of China under Grant F201222.
Open Research
Data Availability
The dataset is being compiled for publication.


