Application of GPR Underground Pipeline Detection Technology in Urban Complex Geological Environments
Abstract
In the process of the continuous construction of underground pipelines, underground pipe network systems have become increasingly complex, which puts forward higher requirements for normal operation and maintenance. To address different kinds of complex conditions, this experiment in the present paper takes ground penetrating radar as the research basis and uses a self-correction and screening algorithm to innovatively detect underground pipelines. The results show that urban underground pipeline detection technology based on ground penetrating radar (GPR) can obtain a highly reliable number of pipelines and track predefined pipelines when detecting different numbers of verification pipelines. When detecting underground pipelines in different sections, the vertical and horizontal errors are no more than 0.199 m and 0.248 m, respectively, which means that the detection technology of urban underground pipelines based on GPR has high detection accuracy and can be performed on high-level detection tasks under various complex conditions. This research applies bottom detection radar to urban underground pipeline detection technology under complex conditions for the first time, innovatively uses the action mechanism of bottom detection radar, integrates its high precision and high efficiency into underground pipeline detection technology, and ensures the effectiveness of the detection work.
1. Introduction
The urban underground pipe network system is expanding and becoming increasingly complex, including underground pipelines in many fields, such as telecommunications, electric power, heat, water supply, and drainage. Because different units manage underground pipelines in different fields, the current information management system of urban underground pipelines is relatively disordered, exposing many problems, such as a lack of corresponding map information and incomplete line coordinate information [1]. In this case, it is urgent to reposition the urban underground pipeline and redraw the map, so optimizing the urban underground pipeline detection technology is the first priority. At present, the more common detection technologies are microgravity detection, tracing methods, electromagnetic induction methods, mechanical detection, etc. However, China has wide land coverage and high geological and geomorphic complexity [2–6], and such detection technologies have certain disadvantages, such as inaccurate positioning, low efficiency, and high cost, which make it difficult to successfully complete various detection tasks under complex conditions [7, 8]. The commonly used urban underground pipeline detection technology does not reasonably apply ground penetrating radar. When performing the detection task under complex terrain conditions, it cannot accurately detect the obstacles affecting the construction operation, such as buried lines, which makes it difficult to control the construction time and project quality.
As an effective detection technology, ground penetrating radar is widely used in various fields with its intelligent and efficient electromagnetic pulse reflection technology, which can provide a large amount of high-resolution data and high-precision information for research work [9]. Nevertheless, GPR will show different detection accuracies in different application positions and states. In view of this, this subject experiment will deeply analyze urban underground pipeline detection technology based on GPR to provide strong technical support for the operation and maintenance of urban underground pipelines.
2. Detection Technology and Algorithm Design Based on GPR
2.1. Technical Principle of GPR
GPR is an electromagnetic pulse reflection method similar to reflection seismology. It can be used to realize effective detection of underground material distribution [10]. In the simple time-domain form of GPR, an electromagnetic pulse will be transmitted to the ground, and part of the energy will be reflected. Generally, the magnetic permeability is approximately 4π ∗10-7 V·s/(A·m), and the dielectric constant and conductivity together determine the reflectivity of the rock boundary [11, 12]. In addition, in the GPR detection process, the antenna is usually placed flatly on the ground to meet the optimal grounding coupling state. Compared with setting the antenna in air, this method can significantly improve the characteristics of the antenna, and a high pulse rate can push the antenna forward to obtain a robust continuous detection effect. The principle of GPR is shown in Figure 1.
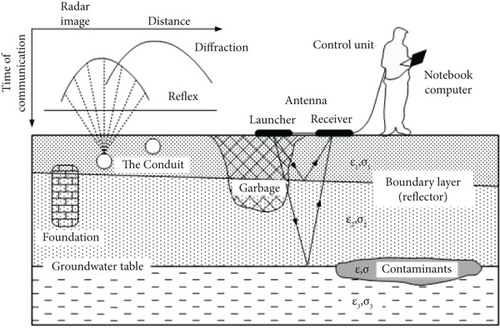
From Figure 1, it is shown that the detection technology based on GPR has strong noninvasive characteristics, which can provide the system with high-resolution data information and is able to summarize and analyze the above data. Finally, the radar image results with integrity and real time are displayed on the plotter. The maximum value of the wide pulse spectrum is often determined by the size of the target to be detected, and the dielectric coefficient is expressed as ε, usually with a value of approximately 9. The conductivity is expressed as σ [13].
According to Equations (2) and (3), the shape of the curve derivative can be drawn and compared with the predefined hyperbola so that the predefined hyperbola is expressed as y2/25 − x2/16 = 1, and the similarity of the two curves in the normalized cross-correlation value can be obtained [16, 17].
2.2. Layout of GPR
In the detection process, the GPR device usually has to move along a scanning line that intersects with the underground pipeline. When it detects the intersection of the underground pipeline and the scanning line, the detection signal will change [18]. The scanning lines of GPR need to be reasonably arranged to ensure the detection efficiency and data quality to obtain a better detection effect of underground pipeline [19]. Figure 2 shows two common layouts in practice, i.e., the parallel line and zigzag.
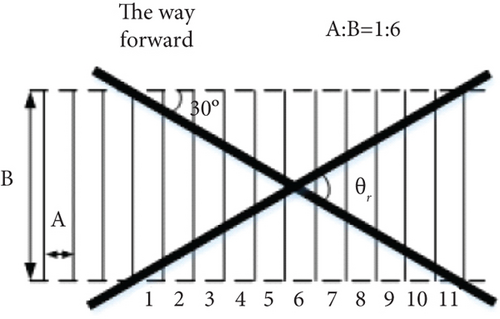
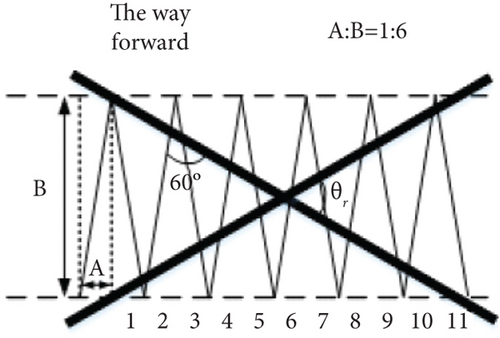
The angle between any underground pipeline and scanning line in Figure 2 is θbs. Only when θbs > 60° will the intersection be valid, and the signal there will change significantly. According to Figure 2, each pair of parallel dotted lines is spreading or parallel or Z-shaped scanning lines, and the cross column long strip is the underground pipeline.
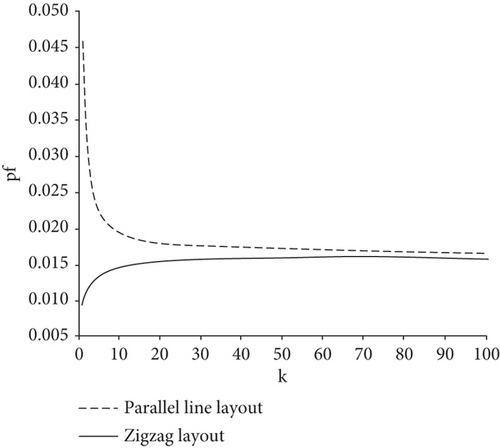
In Equation (9), pf represents the scanning path cost of any unit angle underground pipeline in the process of detection, R(n) represents the path length of any scanning cycle when the density D reaches the minimum value, and k ≤ n [20]. The curves of the two layouts under different k values can be obtained by combining the former formulas.
According to Figure 3, it can be seen that when the number of valid intersections and the B value of the two layouts is consistent, the scanning path of the Z-shaped layout is longer than that of the parallel layout.
2.3. Self-Correction and Screening Algorithm for Drawing Underground Pipelines
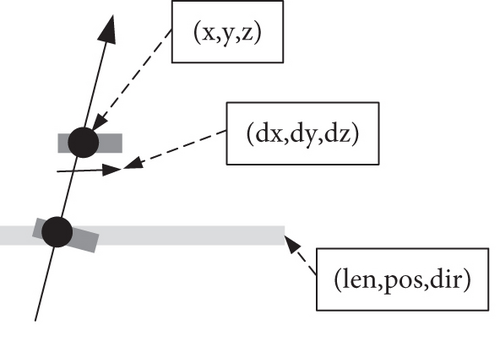
In Equation (10), r represents the radius length of the underground pipeline, (x, y, z) represents the three-dimensional coordinates of the alarm point, and (dx, dy, dz) represents the direction of the underground pipeline. The structure of the underground pipeline can be expressed as , where len is the length of the underground pipeline, is the center point of the underground pipeline, is the estimated direction of the underground pipeline, and DN is the number of detection vectors [23]. MVP and MDA represent the mean value of the position change from the detection vector to the fitting line and the mean value of its angle deviation, respectively, as shown in Figure 4.
A visual description of the self-correcting and filtering algorithm for underground pipeline drawing is shown in Figure 5.
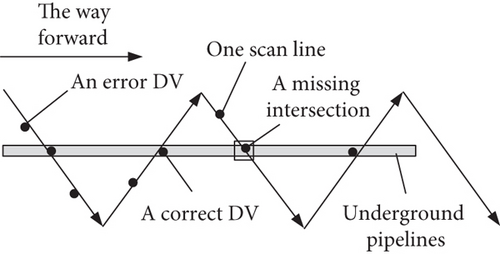
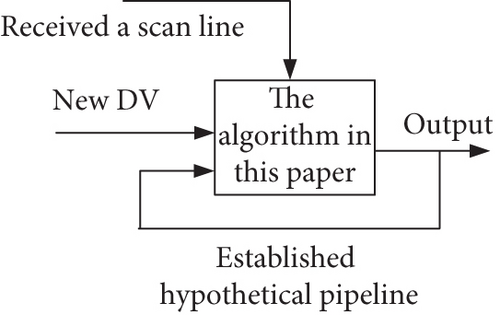
The drawing algorithm for the underground pipeline based on self-correction and filtering is mainly divided into three steps: modifying operation, creating pipeline, and upgrading the new pipeline [25]. The main purpose of the modification operation is to serve the existing highly trusted pipelines, provide some new space points, and then realize the effective optimization of these pipeline attribute estimations. The created pipelines are used to form low-trust pipelines with loose boundaries in batches. Because space points can create new pipelines under their own actions or can be combined with existing low-trust pipelines, there are often many conflicts in low-trust pipelines. Upgrading new pipelines is mainly aimed at creating low-trust pipelines. First, it is evaluated under different conditions, and then, it is upgraded, namely, a new high-trust pipeline is generated.
3. Application of GPR in Urban Underground Pipeline Detection
3.1. Detection Results with Different Numbers of Pipelines
To explore the application effect of GPR in urban underground pipeline detection, it is necessary to preset the scanning density of the zig-shaped layout and the length of its scanning line. Regarding the environmental and operational parameters, it is necessary to set the location, number of underground pipelines, and boundary of credibility. For example, the detection result with only one tested pipeline is shown in Figure 6.


The strip connection in Figure 6 refers to the predefined tested pipeline, the dotted line represents the scanning line in detection, and the thicker line segment is the detected alarm point. Figures 6(a)–6(h) show the results of eight detection points. These results are obtained using the following methods: when a section of the scan line is added, the self-modified and filtered drawing algorithm of the underground pipeline goes through a run, and an updated 3D image is generated. The results of the detection experiment are arranged according to the increase in λ, and the number of alarm points continues to increase. When λ is set as 0, 0.1, 0.2, and 0.3, the underground pipelines whose errors are accepted are 0, 0, 2, and 5, respectively. When reaches 0.3, the self-correcting and filtering algorithm can still search out a highly trusted pipeline to track the predefined pipeline and show good tracking ability. On this basis, the detection results of the predefined pipeline are shown in Figure 7.


Each line segment in Figure 7 is consistent with that in Figure 6. Figure 7 shows that when λ is 0, 0.1, 0.2, and 0.3, the number of underground pipelines with accepted errors is 0, 1, 3, and 3, respectively. Comparing the two detection results with different numbers of pipelines, it can be seen that under the premise that the accuracy of the underground pipeline selected by the algorithm in this paper is higher, if the value of boundary condition N0 is larger and the other conditions are consistent. In general, if the position error of the real space point satisfies N(0, σ), then the range of boundary condition P0 is [2σ, 3σ], and the value of σ is negatively related to the upper limit of the detection algorithm. Since the strengthening constraint applied after MVP is MDA, for A0, its value is much less than P0.
3.2. Detection Results of Underground Pipeline Position in Different Highway Sections
To explore the accuracy of urban underground pipeline detection based on GPR, a series of experiments were carried out in three different highway sections, i.e., sections α, β, and γ. In section α, four survey lines were set as α-1, α-2, α-3, and α-4 to detect with GPR, and the relevant geometric dimension information of underground pipelines in this section after offset processing was obtained, as shown in Table 1.
| Line number | α-1 | α-2 | α-3 | α-4 |
|---|---|---|---|---|
| The top of underground pipeline is at the horizontal position of the survey line (m) | 0.796 | 4.473 | 2.577 | 0.945 |
| The underground pipeline is located at the horizontal position of the survey line (m) | 0.419 to 0.842 | 4.019 to 4.968 | 2.037 to 3.135 | 4.165 to 5.519 |
| Buried depth of underground pipeline from ground (m) | 1.379 | 1.069 | 1.387 | 1.037 |
| Width of underground pipeline (m) | 0.842 | 0.949 | 1.098 | 0.968 |
According to Table 1, the top of the underground pipeline in the GPR image of line α-1 is located at 0.796 m depth of the horizontal position of the line, and the position of the underground pipeline is within the range of 0.419 m to 0.842 m of the horizontal position of the line. The burial depth and width of the underground pipeline are 1.379 m and 0.842 m, respectively. The relevant data of survey lines α-1, α-2, α-3, and α-4 are listed in Table 1. By comparing them with the actual positions of underground pipelines, it can be seen that the detection result error based on the electric sounding radar in the vertical direction is very small, within the range of 0.019 m to 0.199 m. In addition, the detection result error in the horizontal direction is even less than the former, with the detection error from 0.013 m to 0.139 m. This shows that the detection technology based on the electric sounding radar can show superior performance when detecting the α-section and meet accuracy and resolution requirements. The detection results of section β are shown in Table 2.
| Line number | β-1 | β-2 | β-3 | β-4 |
|---|---|---|---|---|
| The top of the underground pipeline is at the horizontal position of the survey line (m) | 3.554 | 1.796 | 3.493 | 0.963 |
| The underground pipeline is located at the horizontal position of the survey line (m) | 2.732 to 3.930 | 1.472 to 2.446 | 3.022 to 3.895 | 0.569 to 1.450 |
| Buried depth of underground pipeline from ground (m) | 0.909 | 1.204 | 1.258 | 1.646 |
| Underground pipeline width (m) | 1.199 | 1.075 | 0.874 | 0.882 |
- (1)
The detection results of line β-1 show that the top of the underground pipeline is 3.554 m in the horizontal position, and its position is within the range of 2.732 m to 3.930 m from the horizontal position of the line. Moreover, the burial depth and width of the underground pipeline are 0.909 m and 1.199 m, respectively
- (2)
According to line β-2, the top of the underground pipeline is located at 1.796 m of the horizontal position of the line, and its position is located between 1.472 m and 2.446 m. Moreover, its buried depth and width are 1.204 m and 1.075 m, respectively
- (3)
Measurement of line β-3 indicates that the top of the underground pipeline is far from the horizontal position of its own line, reaching a depth of 3.493 m. The distance of the underground pipeline from the horizontal position of the line is between 3.022 m and 3.895 m. Moreover, its buried depth and width are 1.258 m and 0.874 m, respectively
- (4)
According to survey line β-4, the top of the underground pipeline is the closest to the horizontal position of the line, which is only 0.963 m. The distance between the underground pipeline and the horizontal position of the survey line is the shortest, which is between 0.569 m and 1.450 m. Moreover, the buried depth and width of the underground pipeline are 1.646 m and 0.882 m, respectively
Then, by comparing and analyzing the actual data and the above detection results in section β, it is found that the horizontal error between the two values ranges from 0.043 m to 0.201 m, while the vertical error is slightly less than the former, with a range of 0.020 m to 0.154 m. Such small errors show the high accuracy of urban underground pipeline detection based on GPR. The detection results of section γ are shown in Figure 8.
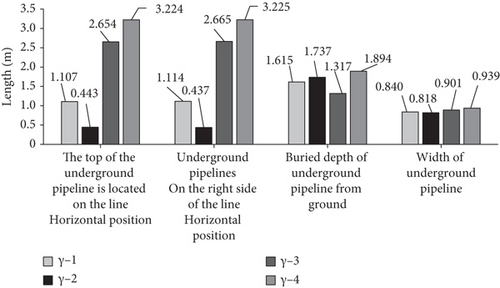
As shown in Figure 8, after offset processing, the detection result of line γ-1 shows that the top of the underground pipeline is 1.107 m away from the horizontal position of the line. The underground pipeline is located at 1.114 m of the horizontal position of line γ-1, and its buried depth and width are 1.615 m and 0.840 m, respectively. The detection results of line γ-2 show that the top of the underground pipeline is 0.443 m away from the horizontal position of the line, and the underground pipeline itself is 0.437 m away from the horizontal position of the line, with a buried depth of 1.737 m and width of 0.818 m. The detection results of line γ-3 show that the top of the underground pipeline is 2.654 m away from the horizontal position of the line. The underground pipeline itself is located at a depth of 2.665 m from the horizontal position of the line. The burial depth and width are 1.317 m and 0.901 m, respectively. The detection results of line γ-4 show that the top of the underground pipeline is 3.224 m away from the horizontal position of the line. The burial depth and width of the underground pipeline are 1.894 m and 0.939 m, respectively, which are 3.225 m away from the horizontal position of the γ-4 survey line. Comparing the detection results with the actual data of the γ sections, it is found that the horizontal and vertical error ranges of the two are 0.014 m and 0.248 m and 0.095 m and 0.163 m, respectively. These minor errors confirm that the detection technology based on GPR has high detection accuracy and resolution.
4. Conclusions
With the continuous acceleration of China’s urban modernization, earth shaking changes have taken place in the city. The normal operation of the city is closely related to the smoothness of underground pipelines. Urban underground pipelines cover many fields and contribute an important force to urban power operation, water supply, and drainage. To prevent the urban underground pipeline from aging, blocking, and other faults so that the urban underground pipeline can maintain its normal working state, regular maintenance is very important.
This subject experiment takes GPR as the research core and thoroughly analyzes the technical principle and layout design of GPR, as well as the underground pipeline drawing algorithm of self-correction and screening, and finally applies it to the detection technology of urban underground pipeline to compare and explore the detection effects under different conditions. The results show that under different numbers of verification pipelines, the Z-shaped layout can have a wider detection range and lower detection path cost. The detection results of underground pipeline positions in different sections also verify the detection performance of the detection technology α, Road section β, and Road section γ. In the three sections, the distance between the top of the underground pipeline and the horizontal position of the first survey line and the buried depth and width of the underground pipeline have small horizontal error and vertical error.
The previous underground pipeline detection technology can only perform the detection task in an environment with simple detection conditions and few obstacles, and the detection accuracy is low. It cannot ensure the effectiveness of the detection on the basis of expanding the detection range. Urban underground pipeline detection technology based on GPR can be well applied in different complex conditions and can show extremely superior detection performance, including high detection accuracy and high detection resolution.
Conflicts of Interest
The authors declare no conflicts of interest,
Authors’ Contributions
The manuscript has been approved by all authors for publication.
Acknowledgments
This research was supported by the National Natural Science Foundation of China (grant number 51678226), the Natural Science Foundation of Hunan Province (grant numbers 2021JJ50147 and 2021JJ30078), the Science and Technology Innovation Project of Yiyang City (grant numbers 2019YR02 and 2020YR02), and the Open Research Foundation of Hunan Provincial Key Laboratory of Key Technology on Hydropower Development (grant number PKLHD202005). The support is gratefully acknowledged.
Open Research
Data Availability
The data reported in this article are available from the corresponding author upon request.


