Molecular Dynamic Simulation of Crude Oil (SARA) Water Flooding Mechanisms under Different Driving Forces in Oleophilic Pore Channels
Abstract
This study investigates the variation of crude oil density distribution with water flooding time for different driving force conditions in the oleophilic pore channel. We used molecular dynamic simulations to analyze the dynamic processes of transport and attachment of crude oil molecules in the pore channel under different driving forces. Oil molecule density distribution pattern during water flooding is of great significance to explore the water flooding mechanism. We studied the oil-water and oil-wall interaction energy. The oil-water interaction energy increased slightly with the increase in the driving forces. The oil-wall interaction energy grew with the increase in the driving forces between 0.001 kcal/(mol·Å) and 0.003 kcal/(mol·Å). When the driving forces increased to 0.004 kcal/(mol·Å) and 0.005 kcal/(mol·Å), the oil-wall interaction energy increased with the increase in the driving forces. After 0.003 kcal/(mol·Å), the oil-wall interaction energy decreases to different degrees. Then, we conducted the RDF analysis to compare the changes of peak value on the RDF between the crude oil and the hydrogen atoms in the wall at distinct moments of time for the three driving forces. We can see that the peak is constant between 5 Å and 6 Å as the driving forces increase. We also analyzed the number density of the crude oil and found that the difference in the number density of the crude oil molecules attached to the two sides of the wall becomes more pronounced as the driving forces are accumulated. The plot of the center-of-mass velocity at different driving forces shows the decrease in center-of-mass velocity as the driving forces increase. We also provided graphs of oil density distribution and the velocity distribution at each moment. Those graphs clearly demonstrated that the side of the wall with more crude oil attached attracts oil droplets; then, the water gradually piled the crude oil up to form oil clusters. High-speed water molecules will strip the oil molecules in the middle of the pore.
1. Introduction
A large amount of remaining oil still exists in the formation after water flooding, and the oil film in micro- and nanometer pores is difficult to be fully used. Researchers used a few methods to study the micro remaining oil mechanism, such as CT, NMR, and core thin section. Researchers observed displacement behavior in pores by NMR scanning cores during water flooding and quantified the variation of remaining oil saturation [1]. Mohammadi performed a series of polymer injection processes on a five-point glass micromodel with different shale geometries. The application of glass micromodel experiments to the study of the effect of obstacles on oil recovery and flow patterns during EOR is revealed [2]. Yang et al. used CT imaging to shape the water drive process in cores of different permeability to analyze the distribution characteristics of the remaining oil [3]. Sun et al. carried out CT scanning analysis and electron microscope analysis on frozen thin sections of cores, so as to characterize the distribution of oil and water in cores [4]. Wettability changes and remaining oil distribution in calcite cores in reservoirs were characterized using CT and scanning electron microscopy techniques [5]. Li et al. studied microscopic remaining oil migration by CT scanning and believed that permeability, capillary number, and microscopic heterogeneity were three factors affecting microscopic remaining oil [6]. Dernaika et al. combined CT techniques, NMR, and core thin section methods to determine and analyze the water saturation of reservoir cores and the remaining oil within the ripple zone [7]. The residual oil saturation in oleophilic sandstones was determined, and the size distribution of the residual oil clusters was analyzed using X-ray microstratigraphy by Iglauer et al. [8]. Al-Shalabi et al. [9] investigated the effect of permeability differences on remaining oil saturation in stratified porous media without cross-flow using a stratified etched glass micromodel and a Berea sandstone core with large permeability differences for water flooding experiments. Iyi et al. [10] in 2021 analyzed the effect of different wettability walls on the oil recovery efficiency of water drive by Ansys-Fluent software and concluded that low IFT is sufficient to resist the capillary effect, but the oil adhesion to the wall due to the wettability effect cannot improve the recovery. Kamal et al. [11] did imbibition tests and core flooding experiments on the surfactant package with surface-modified SiO2 nanoparticles; they found out that the NPs can alter the wettability of the rock to a more water-water state, which is beneficial for EOR. Punase et al. [12] investigate the effect of temperature on wettability of the rock, and they provide an opinion that wettability is determined by a combination of factors. We can find the methods above; they have a common problem, the scale issue. Problems such as equipment and manual handling limit the physics experiments, which cause the physics experiments not to describe the nanoscale issues precisely. So we adopt molecular dynamic simulation as a computer simulation tool to assist us in solving this troublesome problem.
Molecular dynamic simulation as a reliable research method for fine characterization of microscopic phenomena has been gradually applied to the study of microscopic residual oil. Liu et al. analyzed the influence of sorption layers by simulating the repulsion process in a real kerogen structure [13]. Fan et al. [14] simulated the use of diagonal corner oil in viscoelastic polymers with different chain lengths by means of molecular dynamics. The adsorption behaviour of oil-water components in the presence of nonionic surfactants at different temperatures and salt concentrations was determined using dissipative particle dynamic (DPD) simulations by Goodarzi et al. [15]. Wu et al. [16] simulated the migration process of SARA heavy crude oil model on soil organics and quartz wall and found that soil organics in wall components would increase the adsorption effect of the wall on crude oil. Aminian et al. [17] added surfactants and nanoparticles to brine, crude oil, and calcium carbonate wall system for oil displacement simulation, so as to observe and analyze the influencing factors related to the occurrence of wetting inversion phenomenon. Salwani et al. performed dynamic simulations of the diffusion of carbon dioxide, water, sodium dodecyl sulphate, hexane, and silica nanoparticles in the system by means of molecular dynamic simulations and accurately characterized the changes in diffusivity of the components at different temperatures and the differences in interfacial tension between the components [18]. Elkahky et al. used molecular dynamic simulations in order to assess the density of different asphaltene structures in Australian oil fields and to predict their formation [19].
We can see it from previous researches that the pore surface membrane remaining oil is the primary remaining oil type after water flooding in a sandstone reservoir, and it has excellent utilization potential. However, at the nano-microlevel, it is not complete to explain its retention in the formation. Molecular dynamic simulation is a powerful means to study the nano-microphenomena in reservoirs. Therefore, in this paper, molecular dynamic simulations will explore in depth the density distribution law of oil molecules in the sandstone channel during water flooding, in order to improve the water flooding mechanism within the oleophilic pore channel.
2. Methodology
2.1. System Modeling
In order to fully restore the actual situation of the stratum, the wall formation used in this paper is quartz. The quartz wall component is α-SiO2 and cuts its crystal’s (0 0 1) face as a cut of the saturated methyl group [20].
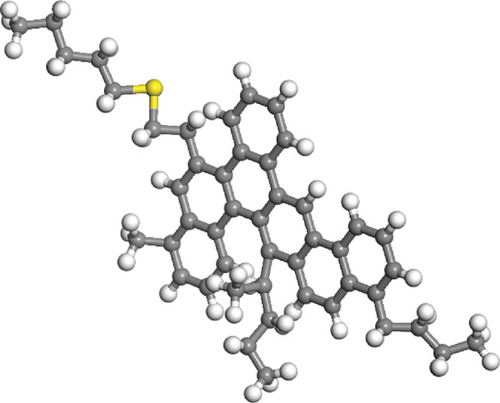
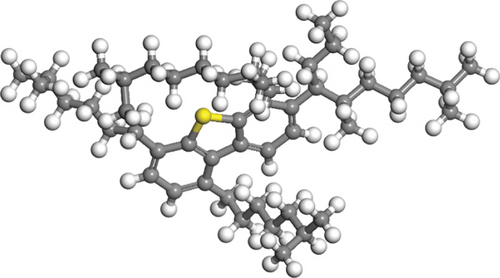
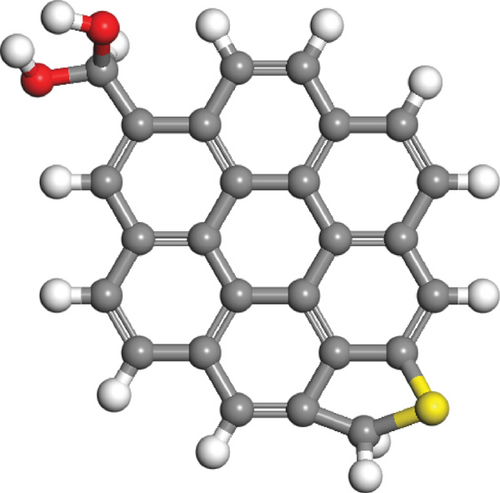
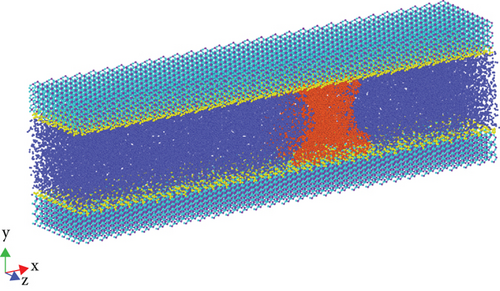
The molecular formula and components of simulated oil refer to the SARA crude oil model [21–23], as shown in Figure 1. The dimensions of the simulation box were 256 Å × 77 Å × 50 Å. The model has a total of 89044 atoms.

2.2. Simulation Details
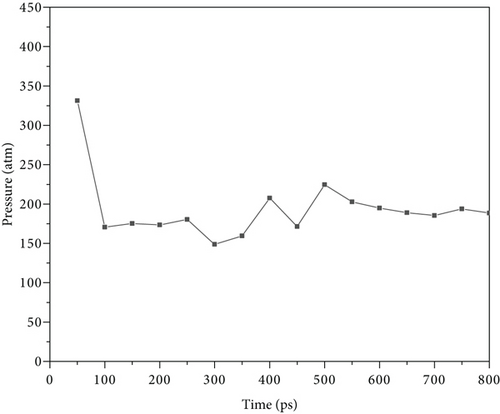
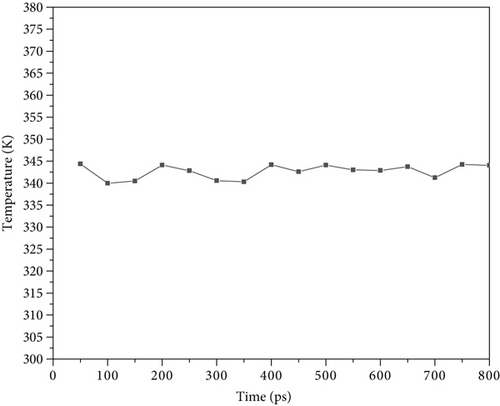
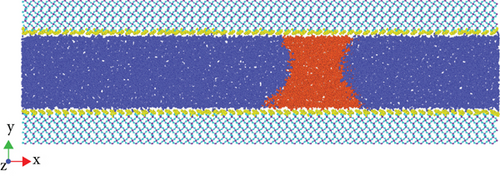
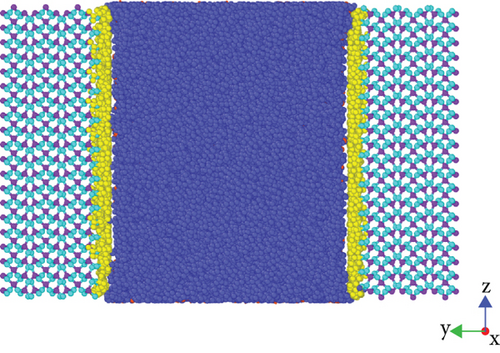
The molecular dynamic simulation software is LAMMPS (large-scale Atomic/Molecular Massively Parallel Simulator) [24, 25]. We chose the simulation unit as Real. Energy minimization and NVT relaxation were performed on the wall surface to reach 343.15 K and 200 atm, shown in Figures 2 and 3. We used the Berendsen thermostat for the oil and water [26]. The time step was set as 1 fs, temperature damping Tdamp = 100, and 800,000 steps were performed. The postrelaxation model is shown in Figure 4. Then, the driving forces of 0.001 kcal/(mol·Å), 0.002 kcal/(mol·Å), 0.003 kcal/(mol·Å), 0.004 kcal/(mol·Å), and 0.005 kcal/(mol·Å) were applied to simulate the Poiseuille flow, and the simulation step length was 1 million.
The main potential function parameter types are shown in Table 1.
| Potential function | Type |
|---|---|
| Pair style | lj/class2/coul/long [27] |
| Bond style | Class2 |
| Angle style | Class2 |
| Dihedral style | Class2 |
| Improper style | Class2 |
The formulas of bonded interactions are as follows:
The formulas of nonbonded interactions are as follows:
3. Results and Discussions
3.1. Water Flooding Process Simulation
Understanding the oil transport mechanism during water flooding is crucial for EOR. The images of the simulated process can clearly reflect the morphological changes of oil during the water flooding. The water in the following images has been hidden.
From Figure 5 (a.1) and (b.1), we can find out that there is no water flow channel, and oil droplets are still columnar and not dispersed. In Figure 5 (a.2) and (b.2), a large water flow channel appeared, and oil molecules gradually migrated to both sides of the wall. We could see that a large amount of remaining oil was attached to the wall. When the simulation time reaches 1000 ps, we can see that the flow channel has wholly separated the oil column in both Figure 5 (a.3) and (b.3). During water flooding, the oil molecules on the oil column continue to adhere to the two sides of the wall, resulting in the water flooding leading edge being gradually divided into two sides of the oil film attached to the wall.


As shown in Figure 6, when the simulation time is 200 ps, water channels have appeared in the pore, and some crude oil has been adsorbed near the wall surface. When the simulation duration is 600 ps, we can see it from Figure 6 (b.2) that the water flow channel continues to expand, and the crude oil continue to enrich the walls on both sides. There are still small volumes of crude oil in the middle of the channel, and from Figure 6 (a.2), we can see that some of the crude oil is relatively dispersed in the middle of the channel. However, when the simulation time reaches 1000 ps, there is no crude oil in the middle of the passage.


Figure 7 shows that there were still some concentrated massive oil droplets in the middle of the hole at 600 ps. Observing the figures at 1000 ps, the upper and lower walls have accumulated a substantial quantity of crude oil. However, some crude oil is still in the middle of the channel, which can be seen from the main view that their morphology is relatively sparse. Because of this driving force, a relatively distinct remaining oil block formed in the water flooding front. Despite this continuous displacement, the oil molecules in this part were attracted to the lower sidewall of the pore, resulting in a thick oil film.


3.2. Analysis of Interaction Energy
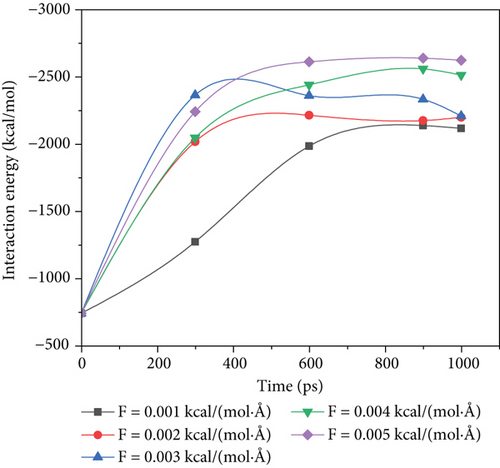
According to Figure 8(a), we can see at each driving force the final stable values starting from the initial -741.56 kcal/mol to -2117.77 kcal/mol, -2198.54 kcal/mol, -2209.59 kcal/mol, -2513.12 kcal/mol, and -2623.72 kcal/mol, respectively. The results show that when the driving force increases from 0.001 kcal/(mol·Å) to 0.002 kcal/(mol·Å) and 0.003 kcal/(mol·Å), the oil-water interaction energy after stabilization increases by 3.81% and 4.34%, indicating that with the increase in driving force within this driving force range, the contact part of the oil-water phase did not increase obviously. However, when the driving force increased to 0.004 kcal/(mol·Å) and 0.005 kcal/(mol·Å), the oil-water interaction energy increases by 14.33% and 23.89% after stabilization, indicating that the contact part of oil-water phase increases with the increase in driving force within this range.
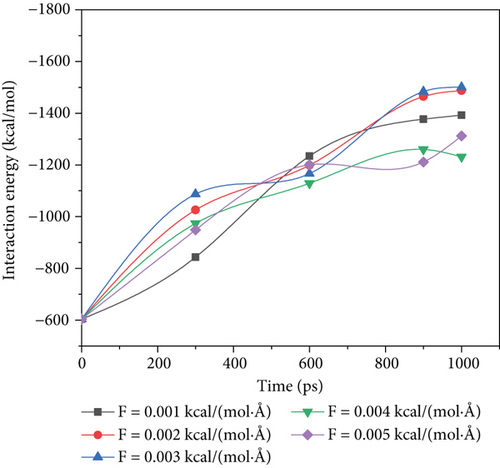
To study the variation of oil-wall interaction by different driving forces, we compared the oil-water interaction energy curves from 0.001 kcal/(mol·Å) to 0.005 kcal/(mol·Å) in this simulation, as shown in Figure 8(b).
According to Figure 8(b), the oil-wall interaction energy increases significantly with the increase in simulated time, indicating that the contact between the oil and walls gradually increases in the displacement stage. The ultimate values under each driving force were -1392.37 kcal/mol, -1487.67 kcal/mol, -1500.41 kcal/mol, -1231.18 kcal/mol, and -1311.93 kcal/mol, respectively. When the driving force increases from 0.001 kcal/(mol·Å) to 0.003 kcal/(mol·Å), the oil-wall interaction energy increases by 6.84% and 7.76%, respectively, indicating that the contact between oil wall phases increases slightly with the increase in driving force within this driving force range. However, when the driving force increased to 0.004 kcal/(mol·Å) and 0.005 kcal/(mol·Å), the final oil-wall interaction energy decreases by 19.34% and 5.78%, indicating that within this driving force range, the oil-wall contact part will decrease to a certain extent.
3.3. RDF Analysis
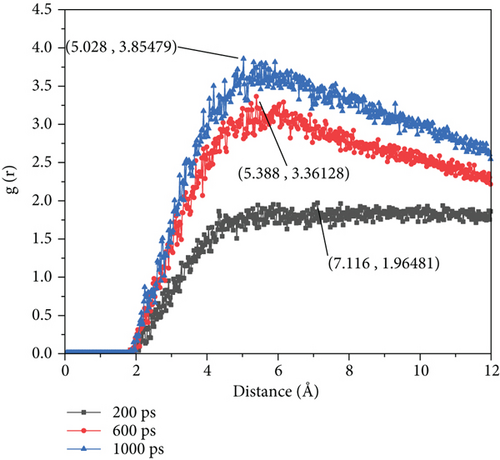
At 0.001 kcal/(mol·Å) driving force and 200 ps simulation time, crude oil distributed relatively uniformly with no wall enrichment. During 600 ps, the peak value of the RDF curve increases from 1.96 to 3.36, which is 71.43%. In contrast, when the simulation time reaches 1000 ps, the peak value at 600 ps to 1000 ps increases from 3.36 to 3.85, an increase of only 14.58%.
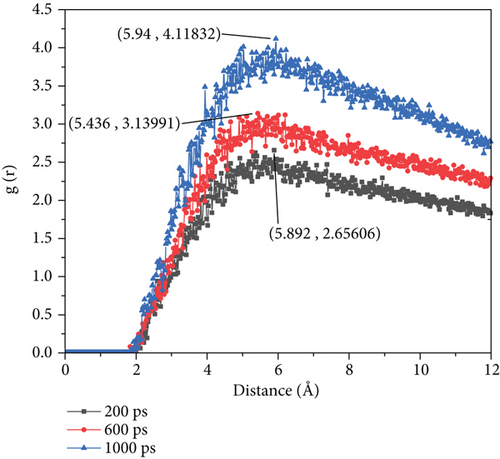
At 0.003 kcal/(mol·Å), we can find that the peak value of the peak of the RDF curve is 2.66 when the simulation time is 200 ps. Compared with the peak value of 200 ps at 0.001 kcal/(mol·Å) driving force, it increased by 35.71%. When the simulation time is 600 ps, the peak value of RDF is 3.14, which is 6.55% lower than that of the peak of RDF simultaneously etched at 0.001 kcal/(mol·Å) driving force. However, when the simulation time reaches 1000 ps, the peak of the RDF curve is 4.12, which is 7.01% higher than the peak of the RDF at the same time under 0.001 kcal/(mol·Å) driving forces.
For the radial distribution function of 0.005 kcal/(mol·Å) driving force, it can be found that the peak value of the peak on the RDF curve is 2.34 at 200 ps, which is 19.39% higher than that at 200 ps at 0.001 kcal/(mol·Å) driving force. The peak value on the RDF curve at 600 ps is 3.32, which is 1.19% lower than that of the peak of the RDF curve at 0.001 kcal/(mol·Å) driving force. By observing the peak at 1000 ps, we can see that the peak is 3.70, which is 3.90% lower than the peak of RDF at 0.001 kcal/(mol·Å) driving force.
The RDF graph shows that with increasing simulation time, the peak value of the RDF gradually increases. Despite different driving forces and simulation duration, the RDF peak remains unchanged between 5 Å and 6 Å.
However, by observing Figure 9, we can find that when the driving force is 0.001 kcal/(mol·Å), there is a 78.09% boost during 200 ps to 600 ps, which means that during this time, there is large transport of oil to the wall. When the driving force elevated, the boost had some decline. That means when the driving force elevated, the oil will not enrich to the wall rapidly.

3.4. Molecular Number Density Analysis of Crude Oil
Figure 10 shows that there is a variation of the oil density profile for different driving forces.
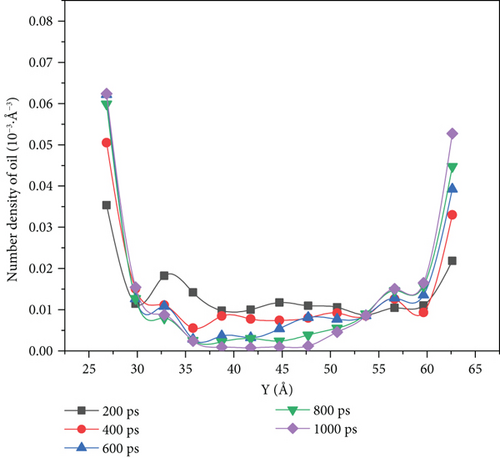
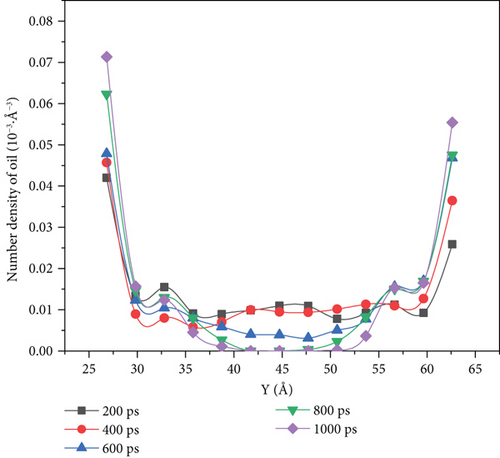
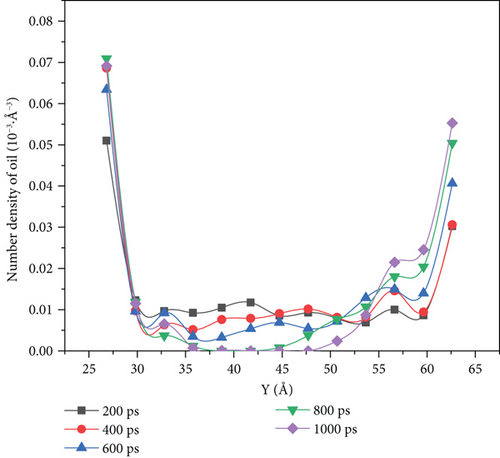
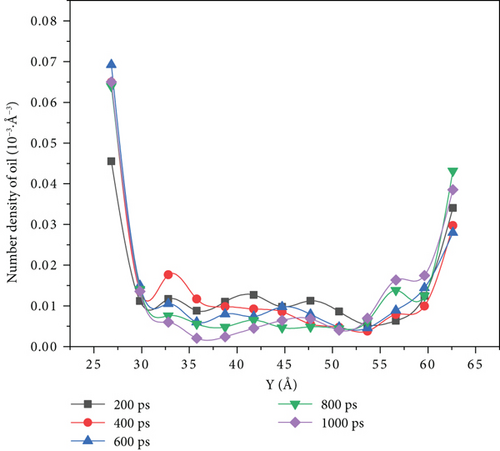
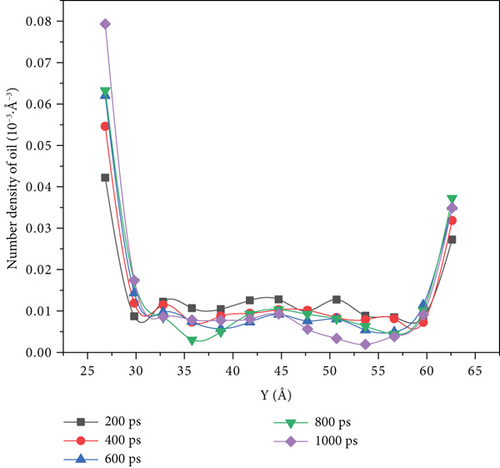
When the driving force is between 0.001 kcal/(mol·Å) and 0.003 kcal/(mol·Å), we can see it from the density distribution diagram at 1000 ps that there are no oil molecules left in the middle of the pore, and the oil molecules evenly distributed on both sides of the pore wall. However, when the driving force reaches 0.004 kcal/(mol·Å) and 0.005 kcal/(mol·Å), the density distribution diagram at the simulation time of 1000 ps shows that some crude oil was left in the middle of the pore. When the driving force was 0.005 kcal/(mol·Å), the number density of oil molecules on the upper wall increased from 0.032·10-3 Å-3 to 0.038·10-3 Å-3 with the increase in the simulation time, only increasing by 9.38%. The molecular number density of lower wall crude oil increased from 0.042·10-3 Å-3 to 0.079·10-3 Å-3, with an increase of 88.10%.
3.5. Velocity Analysis of Crude Oil
We use molecular dynamic simulation methods to simulate changes in the density distribution of oil molecules during water flooding and compared the velocity of the center-of-mass (COM) of the oil with time under different driving forces, as shown in Figure 11.
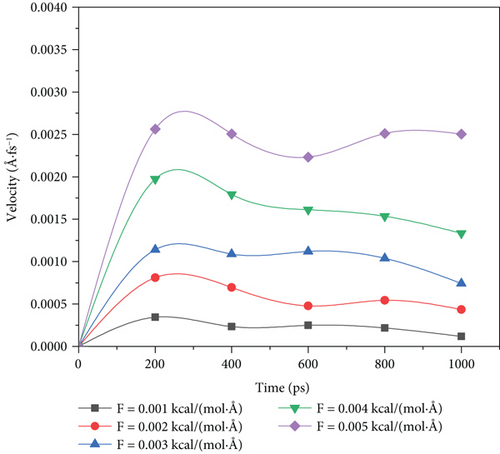
From 0.001 kcal/(mol·Å) to 0.004 kcal/(mol·Å) driving force, with the increase in simulation time, the COM velocity at 1000 ps will significantly decrease compared to its velocity peak at 200 ps. The decrease ranges are 65.80%, 46.53%, 34.87%, and 32.44%, respectively, and decrease occurs with the increase in driving force. However, when the driving force reaches 0.005 kcal/(mol·Å), the flow velocity loss of crude oil is only 2.30%.
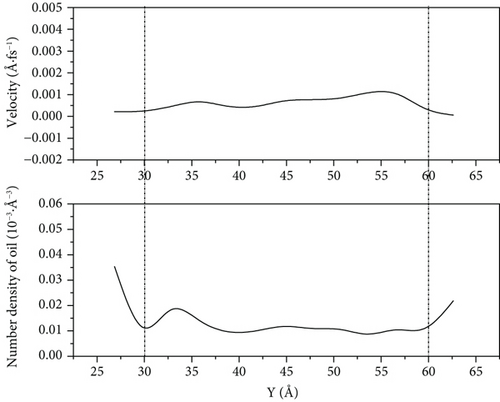
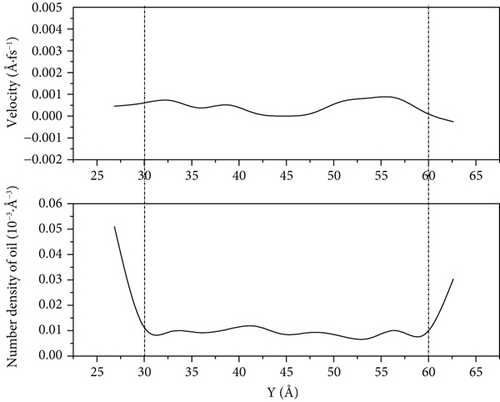
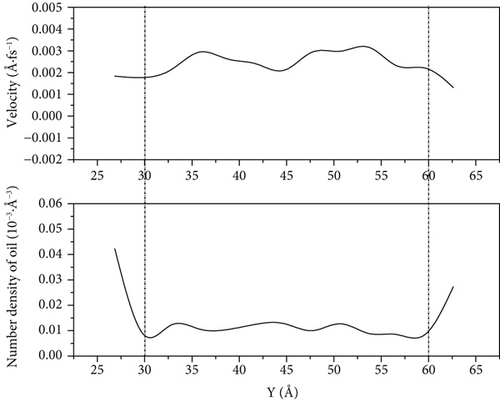
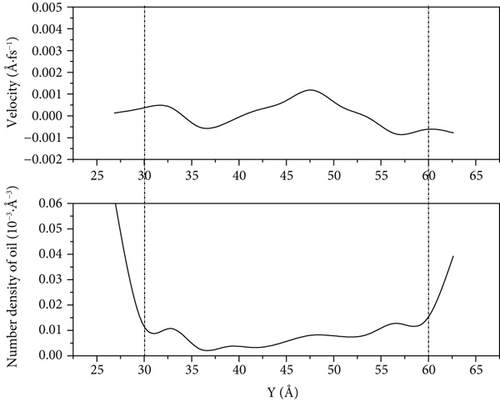
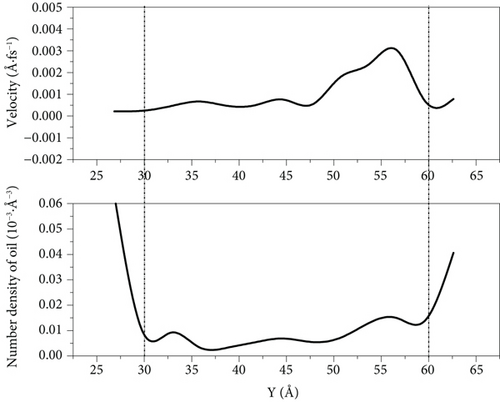
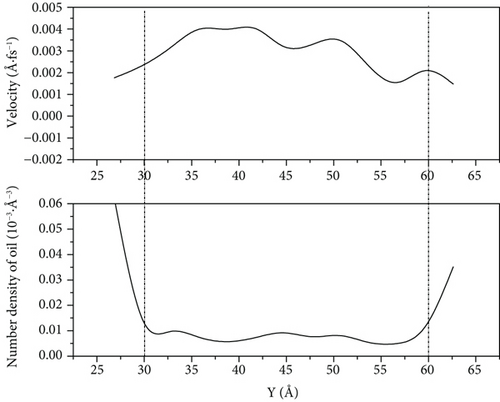
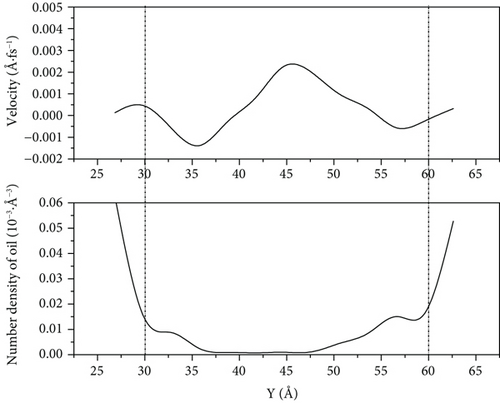
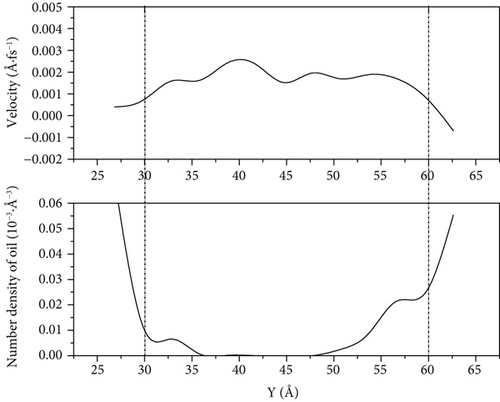
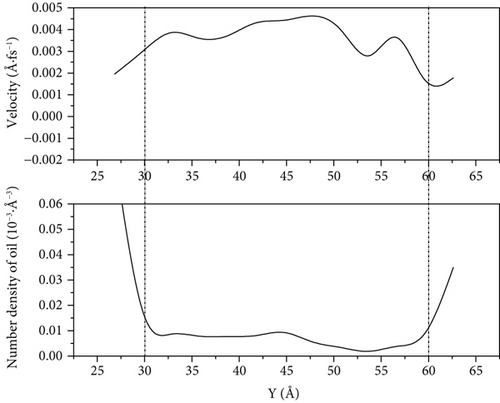
According to Figures 12–14, we can see that because of the high speed of water flooding, the fluctuation near the wall surface density distribution of crude oil results in larger number density on one side of the accumulation of oil molecules to reach high-speed flow channel part of the central channel; the part of the oil molecules can interact with the wall is weak, so it has a high flow velocity. However, because of the low percentage of the corresponding total number of oil molecules, this part has little influence on the overall COM flow velocity of oil molecules. We can see it from Figure 14(a) that when the driving force is 0.001 kcal/(mol·Å) and the simulation is 1000 ps, the flow velocity of remaining oil near the pore wall is close to zero. However, a few oil molecules in the middle of the pore still have a high flow velocity.
4. Conclusion
In this paper, we theoretically investigated the migration and adhesion mechanism of oil under different driving forces of water flooding in an oleophilic pore channel and drew the following conclusions.
Comparing the water flooding process with the driving force of 0.001 kcal/(mol·Å) to 0.005 kcal/(mol·Å), we can see from the RDF figures that the crude oil fraction keeps accumulating between 5 Å and 6 Å thickness near the wall during the water flooding.
When the driving force is 0.001 kcal/(mol·Å) and 0.003 kcal/(mol·Å), the crude oil finally distributed in a more scattered manner on both sides of the wall of the pore as the driving force increases. Its oil-water interaction energy and oil-wall interaction energy also increase. From Figure 10, we can see that the spatial distribution of the four components of SARA in the initial model cannot be completely symmetrical, resulting in the accumulation number of oil molecules on both sides of the wall being different. The difference of oil molecule number density between the two sides of the wall gradually expands with the increase in the driving force, and at 1000 ps, the oil molecule number density in the middle of the pore is 0. Figures 12–14 reflect that the oil molecule flow velocity between 5 Å and 6 Å thickness near the wall is nearly the same as 0 under this repulsion force condition, while this area corresponds to most of the crude oil.
Under 0.005 kcal/(mol·Å) driving force, the crude oil did not completely disperse near the wall of the pore at 1000 ps, which leads to a decrease in the contact between the oil molecules and the wall, and the oil-wall interaction energy reduced, compared with that at 0.001 kcal/(mol·Å). This means that the oil is less enriched at the wall. Figures 12–14 show that there are still oil clusters in the middle of the pore channel with high flow velocity.
Notably, we can see from Figure 11 that after 1000 ps of water flooding simulation, there is a decrease in the COM velocity ranging from 65.80% to 32.44% for the 0.001 kcal/(mol·Å) to 0.004 kcal/(mol·Å) driving force conditions, compared to 2.3% for 0.005 kcal/(mol·Å). This phenomenon is powerful evidence that with the driving force increased, the flow velocity loss during water flooding will reduce.
Conflicts of Interest
The authors declare that they have no conflicts of interest to report regarding the present study.
Authors’ Contributions
W. M. and R. M. were responsible for the investigation. W. M. and R. M. were responsible for the resources. W. M., R. M., and P. W. were responsible for the funding acquisition. W. M., R. M., and P. W. were responsible for the methodology. W. M., R. M., and P. W. were responsible for the data curation. Ma Wenguo and Wang Peng contributed equally to this work.
Acknowledgments
This work was supported by the National Science and Technology Major Projects of China for Oil and Gas (Project Nos. 2016ZX05010 and 2016ZX05058).
Open Research
Data Availability
All these data are available from Wenguo Ma (email: [email protected]; [email protected]) for researchers who meet the criteria for access to confidential data.


