Solid Lipid Nanoparticles Enhance Protective Effect of Rutin against STZ-Induced Neurotoxicity in PC12 Cells through Autophagy Suppression
Abstract
Rutin (Rut) has been identified as a neuroprotective compound with displayed beneficial effects in Alzheimer’s disease. However, low bioavailability and solubility are the major concerns pertaining to the use of Rut. Aberrant function of autophagy has been found as a well-established participant in the pathogenesis of neuronal degeneration. In the present study, Rut and Rut-loaded solid lipid nanoparticles (Rut-SLNs) were used to protect rat PC12 cells against streptozotocin- (STZ-) induced neurotoxicity. Rut-SLNs were fabricated by a solvent evaporation-ultrasonic method. Depending on the experimental patterns including pretreatment, cotreatment, and posttreatment, PC12 cells were exposed to STZ and desired doses of the SLNs, Rut, and Rut-SLNs. The viability of the cells, the mitochondrial membrane potential (MMP), and the expression of miR-21, miR-22, Akt, ATG5, Beclin1, and LC3 were evaluated by using MTT assay, rhodamine 123 fluorescent dye, and qRT-PCR, respectively. SLN and Rut-SLNs possess the smooth surface with an average size of 117.2 and 176.9 nm, respectively, with a negative zeta potential. The encapsulation efficiency and loading capacity of Rut in SLNs were 90.32% and 49.1%, respectively. The nanoformulation revealed a sustained drug release in vitro up to 72 h and followed Higuchi kinetics. Rut-SLNs displayed a neuroprotective effect by augmenting the viability of PC12 cells and increasing MMP. In addition, Rut-SLNs suppressed autophagy which was stimulated by STZ whereas, the free Rut demonstrated lower effect. Taken together, these results clearly indicated that Rut-SLNs could be a good candidate for the prevention of neurodegenerative diseases.
1. Introduction
Alzheimer’s disease (AD) is a progressive disorder and the most widespread form of neurodegeneration disease which is generally characterized by progressive cognitive deficit and memory loss [1]. Although, the pathogenesis of AD is entirely unknown, the neuronal atrophy, abnormal accumulation of senile plaques, oxidative stress, inflammation, and apoptosis have been clarified as the main markers of neural dysfunction [2–4]. There is also evidence indicating that aberrant regulation of autophagy is a key contributor to AD pathogenesis [5].
Autophagy is a highly regulated lysosomal degradative process that is participated in the removal of the damaged organelles and aberrant proteins and thereby recycling cellular components and providing homeostasis [6]. On the other hand, altered regulation of autophagy can act as a cell-death pathway. Therefore, autophagy can either maintain homeostasis or disrupt homeostasis when incorrectly activated [7]. It has been well-established that aberrant function of autophagy participates in the pathogenesis of neuronal degeneration and other neuronal injuries [8]. Cumulative evidence has demonstrated that targeting autophagy by nutraceutical agents can unravel a clue for the treatment of neurodegeneration disease [9].
Rut (also known as rutoside, quercetin-3-O-rutinoside, and sophorin) is a naturally occurring flavonoid with notable pharmacological activity and promising therapeutic potential [10]. This nutraceutical agent has gained widespread attention for its beneficial impact on chronic diseases including neurodegeneration diseases, cardiovascular diseases, cancer, and diabetes mellitus [11].
It has been documented that Rut possesses the ability to combat several models of neurodegeneration diseases through regulation of autophagy. Rut displays a neuroprotective effect against MPP+ -induced toxicity in SH-SY5Y cells as observed by suppressing abnormal activation of autophagy [12]. On the other hand, Cordeiro et al. [13] revealed that Rut plays a key role in counteracting Huntington’s disease via promoting autophagy and interfering with insulin/IGF1 (IIS) signaling pathway. Rut has also shown tremendous potential in the alleviation of cognitive deficit induced by intracerebroventricular (ICV) administration of streptozotocin (STZ) [14].
STZ is a glucosamine-nitrosourea agent which significantly abates neurogenesis in vitro and routinely applied to induce the experimental models of sporadic AD at ICV administration in vivo [15, 16]. Prevailing studies suggested that the beneficial effects of Rut in clinical trials have been extremely restricted due to its poor solubility, extensive first-pass metabolism, and low gastrointestinal absorption [17]. A promising way to overcome these conventional obstacles is incorporating this phytochemical in several nanostructured formulations.
SLNs are colloidal particles of submicron size (50-1000 nm) which composed of biocompatible and biodegradable solid lipids and possess the capacity to incorporate water-insoluble agents [18]. Owing to the multitude advantages of SLNs including low production cost, long-term stability, and high biodegradability accompanied with augmented oral delivery of lipophilic agents, the SLNs are generally considered as a suitable candidate for the delivery of several phytochemical compounds [19]. In this work, we explored the efficacy of Rut-SLNs against STZ-induced neurotoxicity in PC12 cells through modulation of autophagy.
2. Materials and Methods
2.1. Materials
Tripalmitin glycerol (TPG), stearic acid, dioctyl sulfosuccinate sodium salt (AOT), and dimethyl sulfoxide (DMSO) were purchased from Merck Co. (Darmstadt, Germany). Rat pheochromocytoma-derived cell line (PC12) cells were obtained from the Pasteur Institute of Iran (Tehran, Iran). The cell culture medium (RPMI1640), fetal bovine serum (FBS), and penicillin-streptomycin were purchased from Gibco BRL (Life Technologies, Paisley, Scotland). The culture plates were purchased from Nunc Brand products, Roskilde, Denmark. Rutin, MTT [3-(4,5-dimethyl thiazol-2,5-diphenyl tetrazolium bromide] and STZ were purchased from Sigma Chem.Co. (Darmstadt, Germany).
2.2. Preparation of Solid Lipid Nanoparticles
Rut-SLNs were fabricated by solvent evaporation-ultrasonic method [20]. Stearic acid and TPG were selected as the solid lipids, and the selected surfactant was AOT. In brief, Rut (5 mg) and a specified amount of stearic acid (4 mg), TPG (4 mg), and AOT were dissolved in 1 mL of ethanol. Later, the oil phase was dispersed in the 30 mL distilled water using a probe sonicator, for 5 min. After that, the organic solvent was evaporated by stirring for 30 min at a speed of 800 rpm. Blank SLNs were prepared without the addition of Rut.
2.3. Characterization of Solid Lipid Nanoparticles
The hydrodynamic size and polydispersity index (PDI) of nanoparticles were performed by dynamic light scattering (DLS) method using a nanosizer instrument (Malvern, England). The zeta potentials of nanostructured formulations were also measured by the same instrument. The scanning electron microscopy (SEM) (MIRA3TESCAN-XMU microscope, Germany) was used for the determination of precise size measurement as well as Rut-SLNs morphological characteristics. Intermolecular interactions and surface chemistry characterization of nanoparticles were performed by Fourier transform infrared spectroscopy (FTIR), using an infrared spectrometer Shimadzu IR2000 (Japan) in the range of 400–4000 cm −1.
2.4. Determination of the Encapsulation Efficiency (EE) and Drug Loading (DL)
2.5. In Vitro Release Study
The drug release behavior of the nanodelivery system was performed at 100 rpm and 37 ± 1°C in 50 ml phosphate buffer saline (PBS) and ethanol (65 : 35) as dialysis medium applying a dialysis bag method. The exact amount of freeze-dried Rut- SLNs (5 mg) was poured inside a dialysis bag (cut-off 10 kDa). The samplings of release medium were performed at different time intervals up to 72 hr. After each withdrawal, the removed solution (1 mL) was replaced with the same content of fresh medium to maintain sink condition. The amount of Rut in the solution was performed by UV-Vis spectrophotometry. All operations were carried out in triplicate.
2.6. Cell Culture
PC12 cells were cultured in the RPMI 1640 medium supplemented with 10% FBS, 100 μg/ml of streptomycin, and 100 U of penicillin/streptomycin and maintained at 37°C in the presence of humidified atmosphere with 5% CO2. Treatments were usually carried out 24 hr after seeding the cells. Rut and Rut-SLNs were dissolved in DMSO and diluted with PBS to achieve the desired concentrations. STZ stock solution and NH4Cl (autophagy inhibitor) were freshly prepared in PBS.
2.7. Cell Viability Assays
To evaluate the effect of SLNs, Rut, and Rut -SLNs on the viability of PC12 cells, the cells were seeded in 96-well plates and incubated for 24 h, and then, different concentrations (2-512 μg/ml) of SLNs, Rut, and Rut-SLNs and STZ (1-200 mM) were added for 24, 48, and 72 h. After that, 10 μl of MTT solution (5 mg/ml) was added to each well and incubated for 3 h. Then, 200 μl DMSO was added to each well to dissolve formazan crystal. The absorbance was measured using a microplate reader at 570 nm. Depending on the experimental patterns including pretreatment, cotreatment, and posttreatment, PC12 cells were seeded for 24 h and treated with STZ (15 mM) and optimal doses of the SLNs, Rut, and Rut-SLNs. In the pretreatment method, cells were treated with drugs for 3 hr; then, STZ was added. In the posttreatment experiment, first cytotoxicity induced by STZ and after 3 hr drugs were subjected. In the cotreatment evaluation, cells were simultaneously treated with drugs and STZ. Following the 24hr incubation, the viability of Rut and its nanoformulation were evaluated by MTT assay. The untreated cells were considered as the control.
2.8. Morphological Studies
Morphological changes of PC12 cells before and after the treatment with STZ, NH4Cl, and Rut and Rut-SLNs either individually or in combination were evaluated using an invert microscope under 20x magnification.
2.9. Detection and Quantification of Acidic Vesicular Organelles (AVO)
2.10. RNA Isolation, Quantitative Real-Time PCR, and Stem-Loop RT-PCR
Real-time PCR was used to evaluate the expression of the autophagy-related genes (ATG5, becline, LC3-I, LC3-II, and Akt) and some miRNAs involved in autophagy (miR-21 and miR-22). Total RNA was extracted from PC12 cells using RNA extraction solution (TRIzol) according to the manufacturer’s instructions (Invitrogen, Carlsbard, California, USA). This was followed by cDNA synthesis. Isolated RNA was reverse transcribed using the Prime Script T™ RT kit (Takara BioInc., Otsu, Japan). Briefly, the reaction volume was provided by adding 1 μl of random hexamer primer, 10 μl of 5× reverse transcription (RT) buffer, 1 μl of oligo-d (T), and 2 μg of total RNA and attained to a final volume of 20 μl by adding RNase-free water. RT-qPCR was carried out using a light cycler instrument (Applied biosystem, Singapore) with SYBR Premix Ex Taq technology (Takara BioInc., Otsu, Japan) kit. In addition, the levels of miR-22 and miR-21 were assessed by using SYBR Green-based stem-loop RT-PCR analysis. The fold change of relative expression of genes was calculated using the 2−ΔΔCt method and values were normalized to the housekeeping genes, β-actin, and U6-snRNA. The primer sequences used in this study are shown in supplementary Table 1.
2.11. Measurement of Mitochondrial Membrane Potential
It has been suggested that mitochondrial dysfunction participates in the induction of apoptosis. In this study, rhodamine 123 fluorescent dye was used to determine MMP [24]. PC12 cells were seeded in 12-well tissue culture plates and incubated for 24 h. After that, cells were treated with NH4Cl (10 mM) and pretreated with desired dose of Rut and Rut-SLNs 3 hr before exposure to 15 mM of STZ, either individually or in combination, for 24 h. After that, cells were incubated with 10 μL rhodamine 123 (20 μM) for 40 min at 37°C and afterward were washed with PBS. Later, cells were lysed with 600 μL Triton® X-1 and the amount of their fluorescence was measured at an excitation wavelength of 488 nm and an emission wavelength of 520 nm using a fluorescence microplate reader.
2.12. Statistical Analysis
The data was presented as mean ± standard deviation (SD) of three independent experiments. The one-way analysis of variance (ANOVA) was used for analysis of data. The p < 0.05 was considered statistically significant difference.
3. Results
3.1. SLN characterization
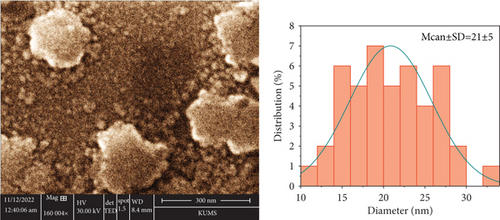
The DLS measurements illustrated that the hydrodynamic diameter of the blank and Rut- SLNs was 117.2 and 176.9 nm, respectively (Table 1). The differences between the size of the blank SLNs and Rut-SLNs could be ascribed to the presence of the drug. The actual particle size of the fabricated SLNs was evaluated by SEM analysis and its results are represented in Figure 1. The figure indicated that Rut-SLNs were spherical shapes, within the average nanosize of 21 ± 5 nm. The low particle size of nanoformulation can facilitate a higher bioavailability of Rut to the cells [25]. The particle size determined by SEM imaging was smaller than hydrodynamic particle size assessed by DLS because of dry state of the SEM measurements. Zeta potential is known as an important factor for colloidal stability. This parameter participates in retaining the dispersed nanoparticles separate, thereby boosting the formulation stability [26]. The zeta potential values of SLNs and Rut-SLNs were -29.3 and -29.7 mV, respectively. The negative charge of SLNs is ascribed to the negative nature of lipids. No remarkable differences were observed in this value between free Rut and Rut-SLNs, indicating that Rut incorporation did not affect the colloidal stability of prepared nanoformulation. Another important factor that guarantees the physical stability of colloidal drug formulations is the homogeneity in their particle size which is confirmed by measuring their PDI. As demonstrated, the heterogeneous nanosystems undergo Ostwald ripening phenomenon and subsequent instability of the formulation [27]. Also, it has been well-established that low PDI value indicates the narrow size distribution which describes the performance of nanostructured formulations in drug release and cellular uptake [28]. SLNs and Rut-SLNs revealed the PDI values 0.21 and 0.28, respectively, representing a homogeneous distribution and uniformity of nanoformulations. EE and DL of Rut-SLNs were 90.32% and 49.1%, respectively (Table 1).
| Formulations | Size (nm) | Zeta potential (mV) | PDI | EE (%) | DL (%) |
|---|---|---|---|---|---|
| SLNs | 117.2 | -29.3 | 0.21 | — | — |
| Rut-SLNs | 176.9 | -29.7 | 0.28 | 90.32 | 49.1 |
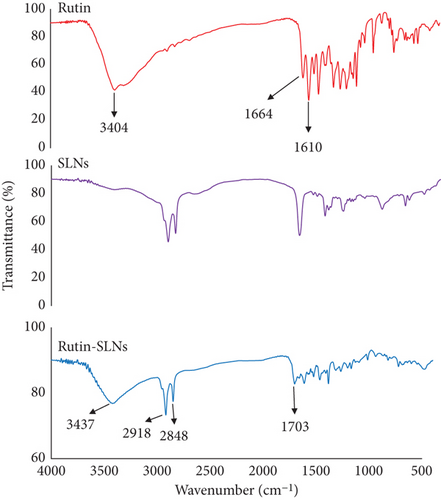
Intermolecular interactions and surface chemistry characterization of nanoparticles were performed by FTIR. As observed in Figure 2, the major peaks of lipids in the Rut-SLNs structure were illustrated at 1703, 2850, and 2918 cm−1 which are related to carbonyl stretch of stearic acid, CH3, and CH2 stretch vibration, respectively [29, 30]. The FTIR spectrum of the Rut incorporated in SLNs displayed a significant change from that of free Rut. The characteristic peaks at 3404 cm−1, 1664 cm−1, and 1610 cm−1were, respectively, attributed to the free OH stretch, C=O stretching conjugated ketone of Rut, and C=C α,β unsaturated ketone stretch [31]. These peaks are weakened and shifted and even disappeared in the FTIR spectra of Rut-SLNs. The observed shift at Rut characteristic peaks may be attributed to probable interaction between SLNs and Rut. Broadening of the phenolic (–OH) band of Rut at 3404 cm−1 is a sign of H-bonding [32]. The characteristic peak of Rut at 1664 cm−1 has been disappeared in Rut-SLNs and can be attributed to the covering of that functional group with lipids of SLNs [33].
3.2. In Vitro Release Study
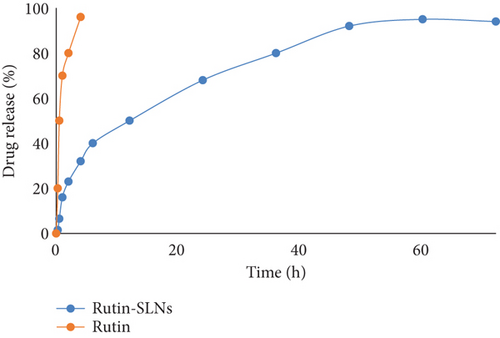
The cumulative release of Rut from Rut-SLNs was evaluated and its diagram is represented in Figure 3. The result revealed a biphasic behavior with an initial burst release within 2 hr, followed by a sustained release pattern up to 72 hr. This initial burst release could be ascribed to the rapid dissolution of Rut molecules that are incorporated in the shell of SLNs [34]. This was followed by a slow and controlled release of the drug up to 94% over the period of 72 hr which demonstrates that Rut could be released in a slow and sustained manner from SLNs. The prolonged release indicates homogeneous entrapment of the Rut throughout the SLNs. Among the various release models, the Higuchi release kinetic gave the highest regression coefficient (R2 = 0.9729) for Rut-SLNs model (Table 2).
| Zero-order model | First-order model | Higuchi model | Korsmayer–Peppas model | Hixon model | |
|---|---|---|---|---|---|
| R2 | 0.9216 | 0.9541 | 0.9729 | 0.8337 | 0.9441 |
3.3. Cytoprotective Effect of Rut and Rut-SLNs on PC12 Cells
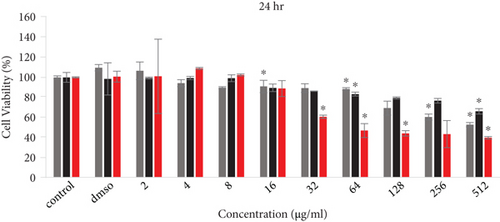
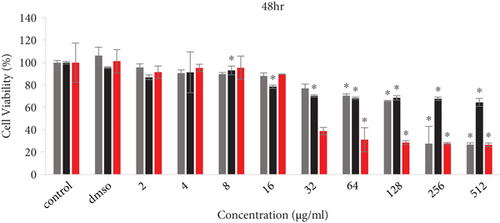
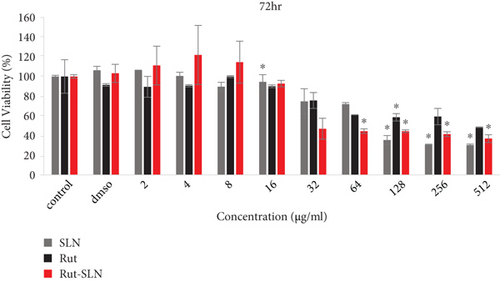
The cell viability results by MTT assay are shown in Figure 4. PC12 cells were exposed to several concentrations (2-512 μg/ml) of free Rut, blank SLNs, and Rut-SLNs (1-256 μg/ml of Rut) for 24, 48, and 72 hr. The viability of PC12 cells reduced from 99.31 to 66.03, 86.93 to 64.48, and 89.50 to 48.455%, respectively, with the increase in doses of Rut after 24, 48, and 72 hr (Figures 4(a), 4(b), and 4(c)). In fact, Rut showed no toxicity in the concentration range 2-32 μg/mL at 24, 48, and 72 h. In addition, incubation of PC12 cells by enhancing the concentrations of Rut-SLNs resulted in a decrease in cell viability from 101.45 to 39.80, 91.50 to 27.12, and 111.13 to 36.89%, respectively, after 24-, 48-, and 72-hr incubation (Figures 4(a), 4(b), and 4(c)). No toxicity was observed in the concentration range 2–16 μg/mL of Rut-SLNs (1-8 μg/mL of Rut) after 24, 48, and 72 hr. Blank SLNs had no effect on the cell viability up to 64 μg/ml after 24 hr indicating that the blank SLN is biocompatible and can be used in intracellular applications. We assessed the cytotoxicity effect of STZ on PC12 cells by exposing PC12 cell line to increasing STZ concentrations (1-200 mM) for 24, 48, and 72 hr to determine a half maximum growth inhibition (IC50) (supplementary Figure 1).
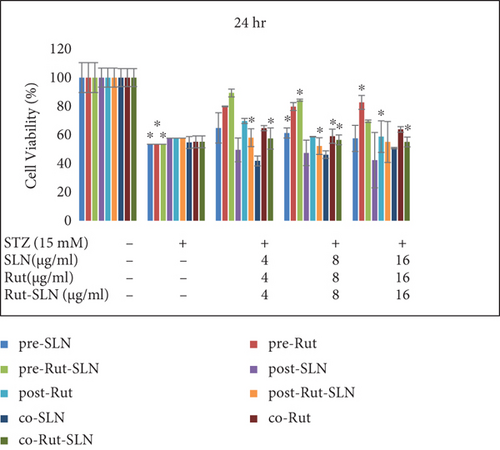
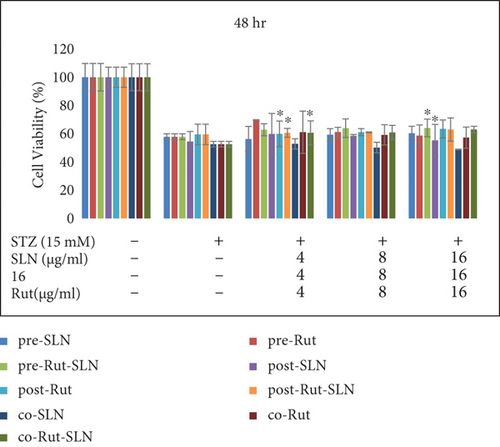
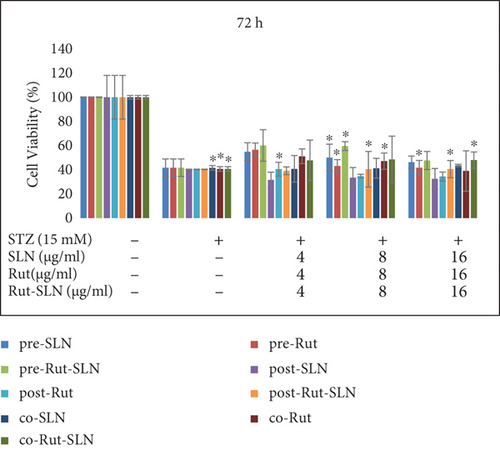
PC12 cells were then treated with an IC50 of STZ (15 mM) in combination with different concentrations (4, 8, and 16 μg/ml) of Rut (free Rut and Rut-SLNs) and empty SLNs as pr-treatment, cotreatment, and posttreatment for 24, 48, and 72 hr. Pretreatment with Rut at 4, 8, and 16 μg/ml resulted in the reduction of STZ-induced neurotoxicity, recovering the viability of the cells to 79.84, 79.7, and 81%, respectively, after 24 hr. Furthermore, Rut-SLNs at 4 and 16 μg/ml prevented the STZ-induced neurotoxicity in PC-12 cells and at 8 μg/ml significantly reinforced the viability of PC 12 cells and selected for further evaluation (Figure 5(a)); however, posttreatment and cotreatment with Rut and Rut-SLNs revealed lower effect to alleviate the STZ-induced neurotoxicity compared to pretreatment (Figure 5(a)). Blank SLNs did not display any significant effect against STZ-induced neurotoxicity, so they were not included in further studies. The viability of PC 12 cells was much increased after 24 hr compared to 48 and 72 hr (Figures 5(a), 5(b), and 5(c)). Microscopic evaluations also clearly indicated the morphological changes and decreased number of cells in STZ-treated cell, which were restored in the pretreatment of PC-12 cells with Rut and Rut-SLNs (supplementary Figure 2).
3.4. Effect of Rut and Rut-SLNs on Autophagy in PC12 Cells
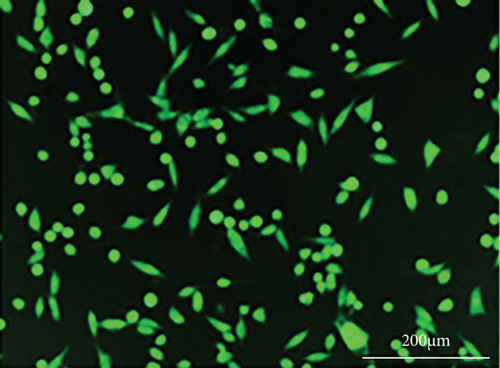
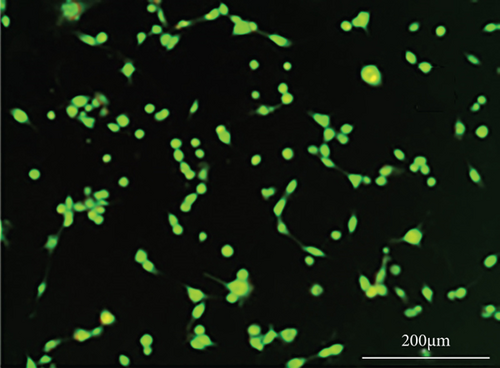
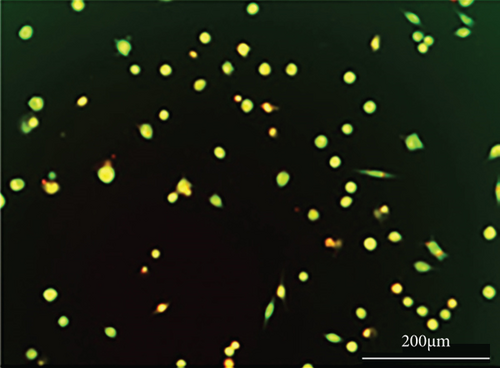
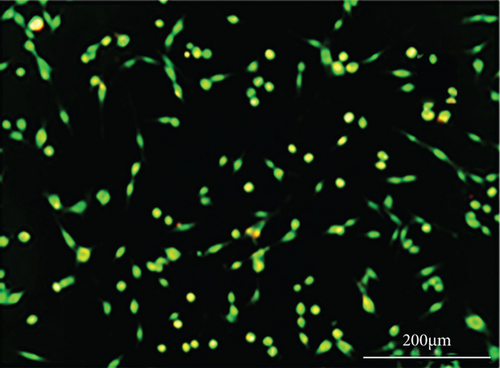
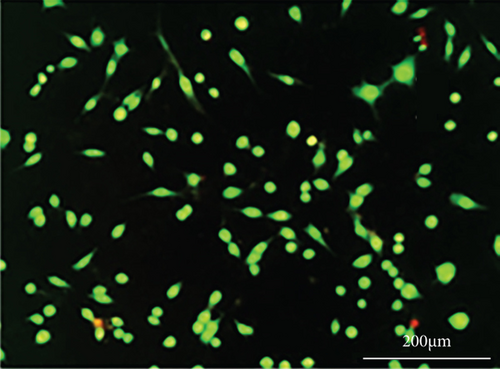
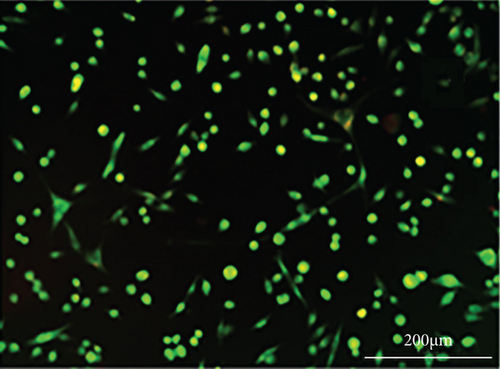
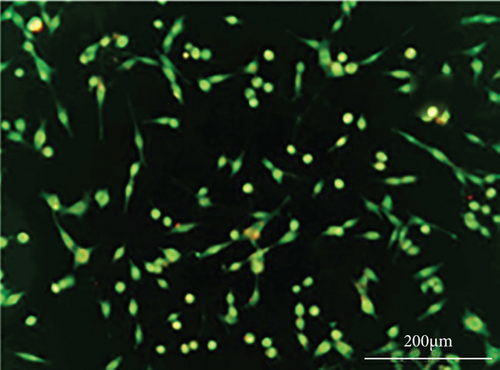
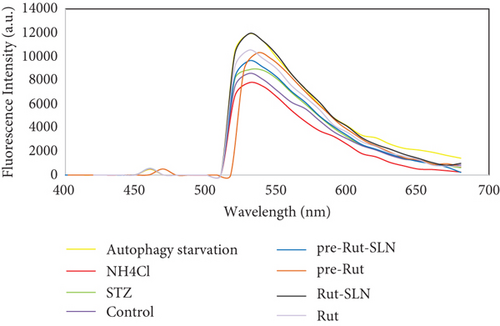
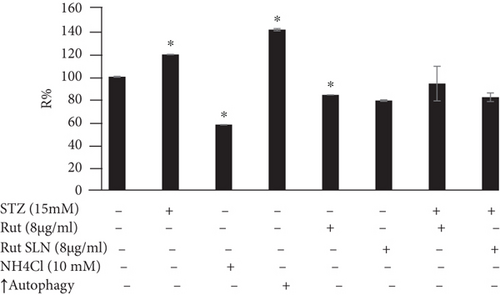
As shown in Figure 6, PC-12 cells treated with NH4Cl (autophagy inhibitor) and autophagy starvation (autophagy induction) displayed a decreased and an increased number of red acidic vacuoles, respectively (Figures 6(b) and 6(c)). PC-12 cells treated with STZ-induced autophagy corroborated by enhancing the number of red acidic vacuoles (Figure 6(d)). However, pretreatment of PC-12 cells with Rut and Rut-SLNs prevented the increase in red acidic vacuoles induced by STZ (Figures 6(f) and 6(h)). Also, Rut and Rut-SLNs individually decreased the number of red acidic vacuoles (Figures 6(e) and 6(g)). In this context, the fluorescence emission spectrum of acridine orange was performed (Figure 7(a)) and the percent of red emission intensity (R%) was calculated according to fluorescence intensity at 655 and 530 nm (I655 and I530). As observed in Figure 7(b), autophagy starvation and STZ stimulated a remarkable increase in the red emission component (p < 0.05), whereas the red emission component was significantly decreased in NH4Cl-treated cells (p < 0.05). Both Rut and Rut-SLNs could reduce the red emission component (84 and 79%, respectively) compared to STZ (119%). Furthermore, pretreatment with Rut and Rut-SLNs suppressed enhanced percent of red emission component induced by STZ (94 and 82%, respectively). Therefore, Rut-SLNs were more effective in autophagy blockage compared to free Rut.

3.5. Analysis of Autophagy-Related Factors Expression
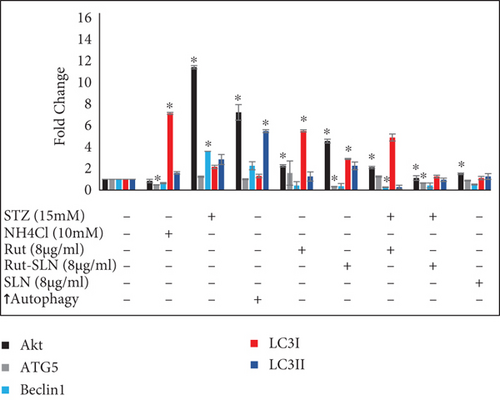
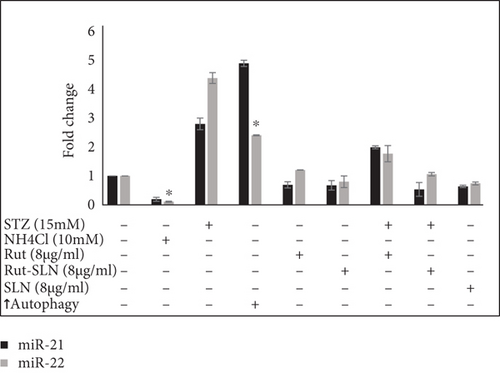
Expression of some miRNAs and autophagy-related genes were evaluated using RT-PCR. As shown in Figure 8(a), the levels of autophagy markers were augmented in the autophagy induction group. However, NH4Cl mitigated the levels of autophagy markers including ATG5, Beclin1, LC3-II, LC3-I, and Akt. On the other hand, the results of RT-PCR revealed that STZ significantly stimulated neurotoxicity in PC-12 cells by elevating the expression of autophagy factors including Akt, ATG5, Beclin1, LC3-II, LC3-I, and mRNA to about 11.42-, 1.76-, 3.6-, 2.84-, and 2.15-fold compared with the untreated control group. Interestingly, 8 μg/ml of Rut and 8 μg/ml of Rut-SLNs (4 μg/ml of Rut) individually downregulated Akt, ATG5, Beclin1, and LC3-II and upregulated LC3-I, compared with the STZ group. The pretreatment of PC-12 cells with Rut decreased the elevated level of Akt, ATG5, Beclin1, and LC3-II to about 2.1-, 1.25-, 0.26-, and 0.27-fold, respectively, as well as increased the expression of LC3-I to 4.88-fold compared with the untreated control group. In addition, in the pretreated Rut-SLNs group, the expression of Akt, ATG5, Beclin1, and LC3-II reduced to 1.12, 0.65, 0.42, and 0.95 and the expression of LC3-I augmented to 1.26-fold compared with the untreated control group. Altogether, both 8 μg/ml of Rut and 8 μg/ml of Rut-SLNs (4 μg/ml of Rut) could prevent STZ-induced upregulation of autophagy and the Rut-SLNs were more effective. It can be ascribed to the enhanced drug delivery potential of the SLNs. Increasing evidence has shown that altered levels of microRNA-modulated autophagy play a pivotal role in the progression of neurodegeneration diseases [35]. As shown in Figure 8(b), STZ augmented the level of miR-21 and miR-22 to about 2.8- and 4.38-fold compared with the untreated control group. The expression of miR-21 and miR-22 was mitigated following Rut and Rut-SLN treatment. Additionally, Rut suppressed the enhanced levels of miR-21 and miR-22 (1.9- and 1.7-fold related to control, respectively). Besides, pretreatment with Rut-SLNs could reduce the level of miR-21 and miR-22 (0.53-and 1.06-fold related to control, respectively). However, both Rut and Rut-SLN inhibited the elevated level of miR-21 and miR-22 but Rut-SLNs showed better effectiveness. As an autophagy inhibitor, NH4Cl downregulated miR-21 and miR-22 level. On the other hand, in the autophagy starvation group, miR-21 and miR-22 were significantly upregulated.
3.6. Measurement of Mitochondrial Membrane Potential
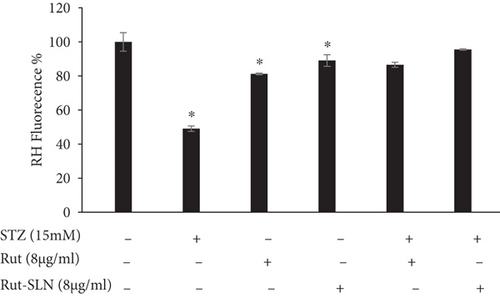
Depolarization of MMP during cell apoptosis contributes to the rhodamine 123 loss from the mitochondria and consequently attenuates the intracellular fluorescence intensity. The reduction in MMP is considered as a key indicator of mitochondria-associated apoptotic cell death [36]. It was observed that STZ-induced MMP decline as evidenced by mitigated fluorescence intensity (49/08%) compared to the control. However, Rut and Rut-SLNs individually reinforced the MMP reduction stimulated by STZ. Furthermore, pretreatment with Rut and Rut-SLNs restored the MMP loss (86.58% for 8 μg/ml of Rut; 95.53 for 8 μg/ml Rut-SLNs (4 μg/ml of Rut) (Figure 9). Therefore, pretreatment with Rut-SLNs was more effective in enhancing MMP compared to free Rut.
4. Discussion
The aim of the present research was to enhance the delivery of Rut to the PC-12 cells and to compare the neuroprotective activities of the dietary Rut with those of Rut-SLNs following STZ exposure in PC-12 cells. To this end, we have evaluated the cell survival, MMP, and the levels of autophagy markers and some miRNAs involved in autophagy. We observed that the STZ-induced neurotoxicity corroborated by increasing autophagy markers and mitigating MMP was prevented by dietary Rut and/or Rut-SLN treatment.
Rut has been identified as a potential neuroprotective agent during the past few years, but its poor absorption, low bioavailability, and solubility are the major concerns for the use of Rut. To solve these problems, we incorporated Rut in SLNs. The incorporation of Rut led to a slight enhance in the size and PDI of the Rut-SLNs which was consistent with other studies [20, 37]. In the present experiment, pretreatment of PC-12 cells with either Rut or Rut-SLN alleviated neurotoxicity induced by STZ but Rut-SLN indicated a stronger efficacy. This is may be due to low particle size of Rut-SLN, which can facilitate accessibility and permeability through the membrane lipid bilayer.
Despite several advantages of SLNs including low production cost, long-term stability, high biodegradability accompanied with improved oral delivery of lipophilic compounds, the initial burst release makes the SLNs undesirable for oral delivery of biopharmaceutical agents. Similarly, in our study, Rut-SLNs demonstrated an initial burst release within 2 h, followed by a sustained release pattern. This initial burst release could be attributed to the rapid dissolution of Rut that are incorporated in the shell of SLNs. To overcome this drawback, the surface modification of the SLNs has been developed.
It has been well-established that the loss of MMP is associated with the release of various apoptotic factors from mitochondria which contributes to the activation of caspase 9 and caspase 3 and activation of apoptotic cell death [38]. In the current study, upon exposure of PC-12 cells to STZ, a loss of MMP occurred. However, pretreatment with Rut and Rut-SLN reinforced the loss of MMP, suggesting the potential of Rut and Rut-SLN in the prevention of neurotoxicity of STZ in PC-12 cells. This finding is in line with other studies demonstrated that the neuroprotection and antiapoptotic effects of several natural-derived phytochemicals are mediated by amplifying MMP [39, 40]. Our data also demonstrated that excessive autophagy participates in the progression of neurotoxicity. It should be mentioned that the effect of Rut on the autophagy function is controversial. Park et al. [41] revealed that Rut enhanced autophagy of cancer cells, while others have shown that Rut contributes to combating neurodegeneration by repressing the autophagy process via mechanisms such as preventing 1-methyl-4-phenylpyridinium-induced autophagy [12] and polyQ-mediated neuronal death [42]. Additionally, Rut could successfully alleviate doxorubicin-induced cardiotoxicity as well as gentamicin-induced nephrotoxicity through inhibiting excessive autophagy and apoptosis [43, 44]. Increasing evidence has shown that aberrant activation of autophagy is a key contributor to the cell death [45]. Under normal conditions, autophagy basically acts at low levels but is highly stimulated by various cellular stimuli such as nutrient starvation, low cellular energy levels, growth factor deprivation, and the accumulation of abnormal proteins and damaged organelles [46]. The role of autophagy in neurodegeneration is a debated concept because of its double-edged sword. Autophagy plays a cell-protective role and maintains homeostasis; however, aberrant regulation of autophagy can accelerate cell death through excessive degradation of cellular constituents [47]. It has been reported that the expression of some markers including Beclin1, LC3, and ATG is related to the formation of autophagic structures and extension of autophagy membranes. Beclin1 is considered as a typical regulator of autophagy, and it represses the autophagy function when it becomes inactive or dysfunctional [48]. As an autophagosome marker, conversion of LC3 from the soluble form (LC3-I) to the autophagosome-associated form (LC3-II) contributes to autophagosome formation [49]. PI3K/Akt/mammalian target of rapamycin (mTOR) pathway is considered as a key regulator of autophagy that regulates various autophagy markers [50]. Sun et al. [51] reported that neurological deficits induced by the ischemic/reperfusion injury were closely related to the enhanced autophagy as observed by an increase in levels of LC3-II and Beclin-1. In this experiment, both Rut and Rut-SLN pretreatment successfully repressed the enhanced level of Akt, Beclin-1, Atg5, and the ratio of LC3-II/LC3-I induced by STZ, which indicates that Rut and Rut-SLNs administration can abate the increase in autophagy-related proteins induced by STZ to alleviate the STZ-induced neurotoxicity. It has been proved that a variety of miRNAs participate in the different stages of autophagy process by acting on different targets [52]. Increasing evidence revealed the possible correlation between miRNAs such as miR-21 and miR-22 and autophagy in different diseases. For instance, it has been reported that upregulation of miR-21 could abolish autophagy and promote the proliferation, migration, and invasion of mesenchymal transition of bladder cancer T24 cells [53]. Another study indicated that miR-21-5p-overexpressing HT-22 neurons exhibited a neuroprotective effect in traumatic brain injury in vitro through inhibiting autophagy [52]. On the contrary, miR-21 contributed to the progression of chronic obstructive pulmonary disease by promoting autophagy [54]. It has been reported that miR-22 mitigated apoptosis and boosted autophagy of human ovarian cancer cells through the suppression of the Notch signaling pathway, proposing a potential role of miR-22 in ovarian cancer treatment [55]. In this research, we found that pretreatment with Rut and Rut-SLNs exerted a neuroprotective effect through diminishing the increased miR-21 and miR-22 expression in the STZ group, suggesting that Rut and Rut-SLNs inhibited excessive neuronal autophagy by modulating the miR-21 and miR-22.
5. Conclusions
We revealed that both Rut (8 μg/ml) and Rut-SLNs (4 μg/ml of Rut) could successfully suppress neurotoxicity induced by STZ in PC-12 cells. Our study suggested that the mechanism of neuroprotective activity of Rut and its nanoformulation against STZ-induced neurotoxicity might be attributed to autophagy blockage. Also, both Rut and Rut-SLNs offered the potential to prevent STZ-induced mitochondrial membrane collapse in PC-12 cells and thereby hindering apoptosis. Further preclinical and clinical investigations are necessary to confirm the efficacy of Rut and its nanoformulation therapy in patients with neurodegeneration. Additionally, future investigations should be focused on engineered methods to design surface-modified nanostructures of the SLNs to access optimized drug delivery systems.
Conflicts of Interest
The authors declare that there is no conflict of interest regarding the publication of this paper.
Authors’ Contributions
M.H.F., E.A., and Z.N. contributed to the conceptualization; Z.N. and S.S. contributed to the methodology; Z.N., S.M., and F.A. contributed to the investigation; Z.N. contributed to writing the original draft; Z.N., S.S., M.H.F., G.B., and S.M. contributed to writing, reviewing, and editing the paper; M.H.F. contributed to the supervision. All authors have read and agreed to the published version of the manuscript. The authors Zeinab Nouri and Soraya Sajadimajd have contributed equally to this work.
Acknowledgments
This research was funded by Kermanshah University of Medical Sciences, grant number 990090. The authors appreciate the financial support of this investigation by Kermanshah University of Medical Sciences, Kermanshah, Iran.
Open Research
Data Availability
The data used to support the findings of this study are included within the article.


