Low-Cost High-Sensitive Plastic Optical Fiber-Based Sensor for Detection of CO(NH2)2 Urea
Abstract
In this research, a urea level sensor based on plastic optical fiber was made using the macro bending method and two kinds of configurations. The sensor is made with a gamma and band configuration with a variety of cladding, no cladding, and imperfection and immersed in the urine sample which has different urea. This is aimed at determining the optimal sensor as a urea level sensor. The object measured was a urine sample with different urea concentrations ranging from 336.1 mg/dL to 1384.3 mg/dL, with the same volume for each concentration in the container or sample holder. The light from LED is transmitted through a plastic optical fiber, received by the phototransistor, then amplified by the differential amplifier, and converted by the microcontroller to voltage as the final results on the computer. Changes in urea levels result in changes in the refractive index around the sensor. The results showed that the more imperfection given to the plastic optical fiber sensor with gamma and band configuration, the better the range, sensitivity, and resolution. The best measurements were obtained in the band configuration with PANI-ZnO coating using six imperfections with the range value of 0.514 volts, the sensitivity value of 0.367 mvolt/mg dL-1, and the resolution value of 2.724 mg/dL. The sensor is suitable for urea levels in medical, agricultural, or industrial applications with the advantages of high sensitivity, low cost, and ease of operation.
1. Introduction
End-stage chronic kidney disease carries an enormous burden of cardiovascular morbidity and mortality [1, 2]. There are four types of diabetes. Type 2 diabetes is currently the leading cause of end-stage renal disease and also a major contributor to cardiovascular disease [3, 4]. Furthermore, renal function tests have an important role in the diagnosis of early-stage renal function [5]. Urea is the main end product of nitrogen metabolism in humans, which is excreted from the body primarily by the kidneys through blood, urine, and saliva. Increased levels of urea in the blood, also referred to as azotemia or uremia, are generally caused by progressive loss of kidney function [5, 6].
Urea is toxic so that it can harm the body if it accumulates in the body, so the increase in urea in the blood can indicate that there is a kidney problem. The determination of urea was important for the quality control of ingredients that are available, to prevent the use of unauthorized nitrogen sources. According to the Association of Official Agricultural Chemists (AOAC) International, the spectrophotometric method is the official method for urea detection and analysis in ingredients. However, this reagent is usually in solution form, and spectrophotometric equipment is not suitable for on-site detection or field use. The weakness of this method is that it required a large number of samples and cannot widely be used because the operation of this tool requires special expertise. Therefore, a faster and more accurate analytical method is needed to detect and analyze the urea level. In that, a sensor is needed that can detect urea levels in urine, saliva, or blood. One of the sensors that have sensitivity to a liquid is an optical fiber that can be used to monitor kidney function for medical applications with a non-invasive-based approach. Plastic optical fiber (POF) has many advantages such as having resistance to corrosion, insensitivity to electromagnetic waves, bending, more sensitivity to several chemical and biology agents, low cost, easy fabrication, and being not easy to heat and not easily broken compared to Glass Optical Fiber (GOF). POF is less widely used as a transmission medium over long distances because POF has a large attenuation. POF has been developed as sensors because it is easy to change the configuration and treat, while GOF are too fragile and their small size makes them difficult to treat. Optical fiber testing as a sensor has been widely used in the medical, environmental, agricultural, and industrial fields [6–10].
In several studies, optical fiber sensors have been widely used to detect urea levels. Research on the absorption of evanescent waves with modification of optical fiber with the spectroscopic method using supporting tools that are very expensive and difficult to fabricate was conducted [11]. Subsequent research on the fabrication and characterization of urea sensors based on straight configuration plasmon resonance optical fibers coated with silver, silicon, and enzymes in this study requires a relatively long process and time to increase sensor sensitivity [12]. There are also other studies with cladding modification based on the evanescent wave absorption (EWA) technique [13] and detecting urea with nonenzyme urea samples, as well as enzymes utilizing surface plasmon resonance (SPR) on multimode optical fibers [14]. Some studies that are reported are still relatively expensive, and the process of increasing the sensitivity takes a long time to measure. There is no reported reference for urea detection by using POF with micro bending. Hence, in this research, the detection of urea levels based on POF as a sensing medium was performed by the macro bending method and the imperfection on the sensor. The sensor has been made of 2 types of configurations, namely, gamma and band configuration with cladding, no cladding, and imperfection. The sensor then determined the value of range, sensitivity, and resolution to get sensor characteristics. This sensor has the advantages of being easy to operate, easy fabrication, real-time measurement, and being able to be connected to a computer.
2. Principle and Experimental Setup
In this study, the sensor is made of POF, Light-Emitting Diode (LED), and phototransistor as the main components. The POF used is a multimode step index type and made of polymethyl methacrylate (PMMA) with a V number of 3.31 × 10³, a diameter of jacket 2.2 mm, a cladding of 1 mm, and a core of 0.98 mm. The POF has a core refractive index of 1.492, cladding of 1.402, and numerical aperture of 0.5. The light source used is an infrared LED-type IF-E91A that transmits light at a wavelength of 950 nm. The phototransistor IF-D92 as a detector detects the light that travels along with the optical fiber and converts light into electrical quantities in the form of voltages.
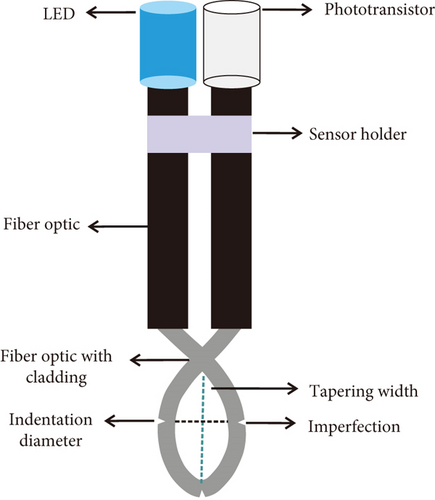
The working principle of urea content based on plastic optical fibers utilizes changes in light intensity due to changes in power losses in optical fibers. The POF sensor that has been made is immersed in the urine sample. The two ends of an optical fiber are connected to a LED and a phototransistor. The voltage from the power supply will turn on the LED. The LED converts an electrical signal into a light signal. The light from LED is transmitted through a POF and received by the phototransistor. The phototransistor acts as a receiver and converts the output signal in the form of light into voltage. The output voltage is amplified by the differential amplifier. But the output voltage signal is still in the form of analog signal, so it is converted into a digital signal by the Arduino Uno microcontroller. The measurement results are displayed on the computer in the form of output voltage. Changes in urea levels result from the changes in the refractive index around the sensor. The higher the urea level, the higher the refractive index of urea. The scheme of the urea content sensor based on plastic optical fiber using gamma and band configuration with cladding, no cladding, and imperfection as shown in Figure 1.
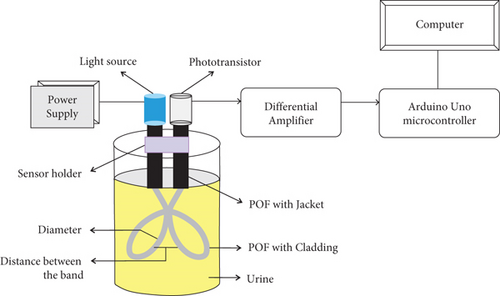
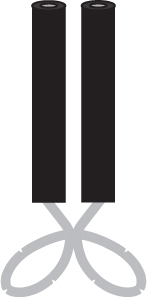
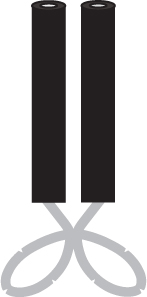
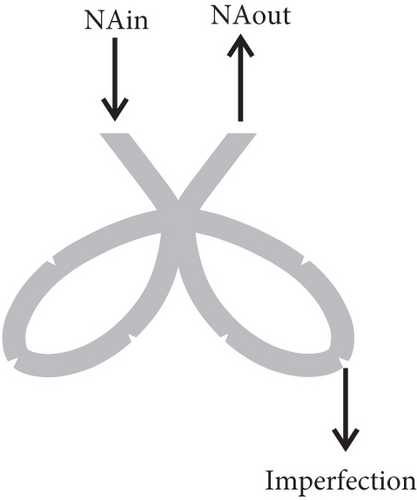
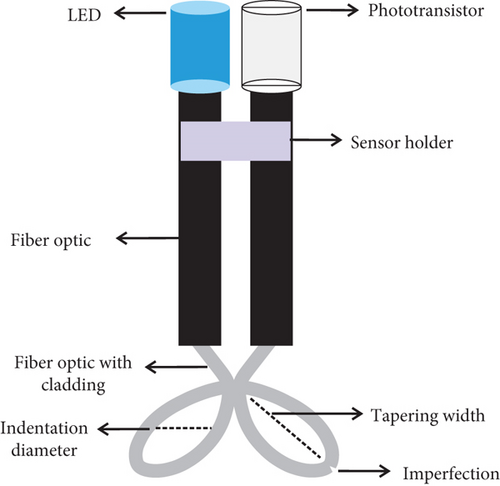
The object measured was a urine sample with different urea concentrations ranging from 336.1 mg/dL to 1384.3 mg/dL, with the same volume for each concentration in the container or sample holder. The POF sensor used is immersed in the urine sample which has a different urea level than the cladding, no-cladding, and imperfection variations. This is aimed at determining the optimal sensor as a urea level sensor. The urea content sensor is made of POF’s materials of various configurations as shown in Figure 2.


where P(θ) is the power of the mode θ at the entrance to the bending, α is the attenuation coefficient of power losses, and l is the distance around the bends.
where n1 is a core refractive index, k is the propagation constant (for k = 2π/λ, λ is the wavelength of the light), and θc is the critical angle of the fiber, while a is the radius of the core and R is the bend radius measured to the axis of the optical fiber.
Sensor testing is done with a variety of imperfection and configurations shown in Figure 2. The length of the POF used is 20 cm for each sensor. For gamma configuration, the sensor strip length is 5 cm, the indentation diameter is 0.3 cm, and the tapering width is 0.5 cm. The imperfection of the sensor is made along with the POF with and without cladding by equalizing the distance between the imperfection, the cutting width, and the depth imperfection which is 0.1 mm on each sensor. For band configuration, the sensor strip length is 7 cm, the diameter is 0.4 cm, and the width, the depth, and the distance between the imperfections were set the same as the gamma configuration on each sensor. Furthermore, the imperfection of the sensor for gamma configuration uses 1, 2, and 3 imperfections with cladding and without cladding. Likewise, for the band configuration, the sensor also with cladding and without cladding starts from 1 to 6 imperfections.
The sensor without cladding is made by removing the cladding from the core of the optical fiber using acetone solution on cotton and then rubbing and the rubbing the POF. The cladding stripping is replaced with another material; in this case, applying optical fiber for detection urea. In addition, sensor tests have been carried out with various diameters and coatings using a polyaniline-zinc oxide (PANI-ZnO). For variations in diameter consisting of 0.3 cm to 1.1 cm with an increment of 0.2 cm using the gamma configuration. For coating with the PANI-ZnO, it has been prepared using the same urea sample as before, without cladding, band configuration, and imperfection variations consisting of 2, 4, and 6 imperfections. The PANI-ZnO was used as a coating to replace the cladding. As the initial stage of the coating process, 0.2 M ZnO was stirred with 0.02 M aniline for 30 minutes with constant stirring (400 rpm). In order for the mixture to be homogeneous, 1 M HCl was dropped into the aniline-ZnO. Furthermore, 0.05 M FeCl3 was added to aniline-ZnO with constant stirring for 1 hour followed by the addition of 10% PVA for gelling; then, it was allowed to stand for 5 minutes before the optical fiber was immersed. Optical fiber coating was carried out by immersing the optical fiber in PANI-ZnO for 20 minutes and then drying. Measurements are made after the coating dries on the optical fiber.
The optical fiber without cladding causes the transmitted light to interact directly with the urea sample. The losses that occur in optical fiber can be caused by several things, one of which is the loss due to indentation. An indentation with a radius greater than the radius of the core is called macro bending. This method uses a gamma and band configuration that has a larger radius of indentation than the core radius, so it is classified as macro bending. The macro bending causes the light to experience a loss due to the change in angle of incidence in the boundary plane between the core and the cladding. In this case, the mode that should have been guided will be released into the cladding area. If the cladding is replaced with certain materials such as urine samples, its properties change. When given the treatment, more interactions occur between the light and the cladding substitute material. This is related to the application of Snellius’s law which states that if the light from the dense medium to the less dense medium will move away from the main axis, then the light will be forwarded out of the core to the urine sample and no longer reflected along with the core so that the light intensity received by the photodetector will decrease.
3. Results and Discussions
The experimental setup has been done and obtains the urea level sensor with a variety of configurations, imperfection, and urea levels. The urea level sensor based on POF is made using gamma and band configuration. The testing process was carried out for each sensor immersed in the urine sample. The urine sample fluid used was tested at Wahidin Sudirohusodo Hospital in Makassar, South Sulawesi, with as many as eight samples by measuring urea levels using the ABX Pentra 400 device to obtain urea concentrations as the samples with a varied range from 336.1 mg/dL to 1384.3 mg/dL. According to standard ISO 22241-1:2019, the refractive index urea range is 1.3814 to 1.3843.
The change in urea concentration causes changes in the refractive index of the sample; if the concentration of urea is higher, the refractive index value of the sample solution becomes higher. Changes in the refractive index that occur cause changes in optical power which are detected by optical detectors, which will be amplified by the differential amplifier and converted from analog into a digital signal in output voltage form that is read on the computer. The relationship between the urea concentration and the output voltage read will be used as a reference for sensor characterization. For each measurement, results are read on the computer as output voltage in volt units. The measurement results of the urea level sensor based on POF with the gamma configuration are shown in Figure 3.
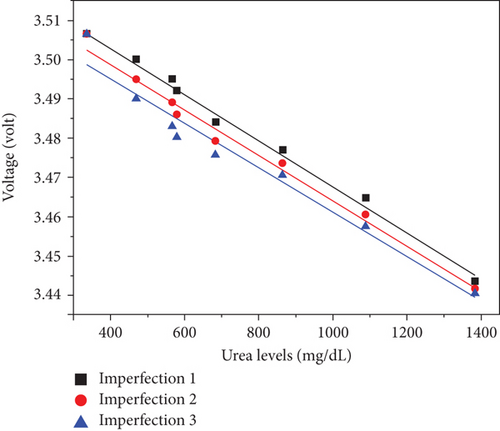
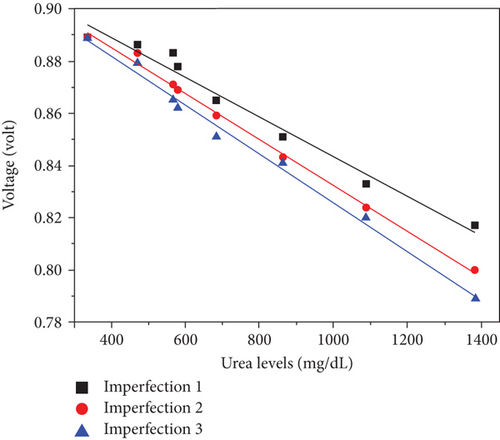
The graph in Figure 3 shows the graph of the urea levels of the sensor to output voltage using gamma configuration with cladding (Figure 3(a)) and without cladding (Figure 3(b)). In Figure 3, each sensor is given a different treatment, namely, given an imperfection of 1, 2, and 3. Each sensor is differentiated based on the quantity of imperfections given, ranging from 1 to 3. 1, 2, and 3 imperfections are represented by black, red, and blue sign, respectively. Each sensor produces different responses. It can be seen that change in urea level will cause changes in the intensity of light along POF received by the phototransistor. The higher urea level will impact the higher refractive index of the urea sample. Increasing refractive index, giving imperfection, and removing cladding on optical fiber sensors result in greater power losses in the optical fiber and impacted the output voltage which becomes smaller. The measurement results obtained illustrate that the sensor without cladding has a steeper graphic than the sensor with cladding.
where ∆ is the range of the sensor. Range is the maximum output voltage minus the minimum output voltage.
where Kmax is the maximum urea level and Kmin is the minimum urea level.
Characterization of the urea level sensor is determined by using equations (6), (7), and (8) with gamma configuration and variety of imperfection as shown in Table 1. Furthermore, the sensitivity value of the sensor is in mvolt/mg dL-1 units, and the resolution is in mg/dL units.
| Characterization | With cladding | Without cladding | ||||
|---|---|---|---|---|---|---|
| 1 | 2 | 3 | 1 | 2 | 3 | |
| Range (volt) | 0.063 | 0.065 | 0.066 | 0.072 | 0.088 | 0.100 |
| Sensitivity (mvolt/mg dL-1) | 0.060 | 0.062 | 0.063 | 0.069 | 0.085 | 0.095 |
| Resolution (mg/dL) | 16.585 | 16.126 | 15.881 | 14.558 | 11.777 | 10.482 |
Based on Table 1, it can be seen that the best result obtained has the highest value of range and sensitivity; meanwhile, it is low in resolution value. Sensors made with or without cladding are given imperfection in the amount quantity of 1 to 3. Then, they are immersed in different levels of urea. Each different treatment will produce a different range, sensitivity, and resolution value for each sensor and measurement. The best result is observed at the sensor without cladding in an amount of 3 imperfections. The results obtain a range value of 0.100 volt, a sensitivity value of 0.095 mvolt/mgdL-1, and a resolution value of 10.482 mg/dL.
The result of the sensor continued using band configuration as shown in Figure 4. Furthermore, in Figure 4, the sensor shows variety of imperfection and urea’s level, with cladding and without cladding.

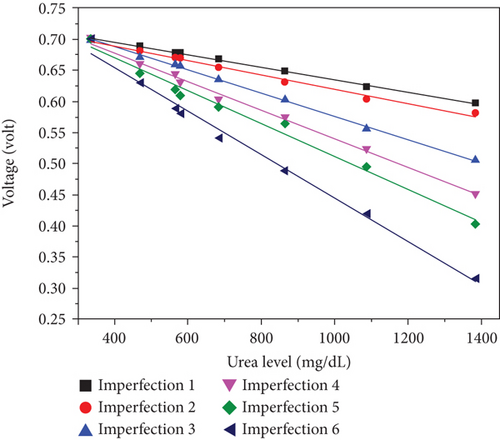
The graph in Figure 4 shows the output voltage of the urea level sensor using band configuration with cladding (Figure 4(a)) and without cladding (Figure 4(b)). Each sensor differentiated based on the quantity of imperfections given, ranging from 1 to 6. 1 to 6 imperfections are represented by black, red, blue, purple, green, and blue navy sign, respectively, as shown in Figure 4. Each sensor produces different responses. The number of imperfections is indicated by several colours shown on the graph either with cladding or without cladding. It can be seen that the addition of imperfection and increasing urea’s level will cause changes in the refractive index and the intensity of light along POF. Increase in refractive index on optical fiber sensors results in greater power losses in optical fiber, and the output voltage becomes smaller. The characteristics of the urea level sensor based on POF using band configuration with a varying number of imperfections and cladding and without cladding are shown in Tables 2 and 3.
| Characterization | Number of imperfection variety | |||||
|---|---|---|---|---|---|---|
| 1 | 2 | 3 | 4 | 5 | 6 | |
| Range (volt) | 0.063 | 0.065 | 0.072 | 0.073 | 0.075 | 0.088 |
| Sensitivity (mvolt/mg dL-1) | 0.060 | 0.062 | 0.068 | 0.069 | 0.071 | 0.084 |
| Resolution (mg/dL) | 16.638 | 16.126 | 14.558 | 14.358 | 13.976 | 11.911 |
| Characterization | Number of imperfection variety | |||||
|---|---|---|---|---|---|---|
| 1 | 2 | 3 | 4 | 5 | 6 | |
| Range (volt) | 0.102 | 0.118 | 0.194 | 0.248 | 0.297 | 0.384 |
| Sensitivity (mvolt/mg dL-1) | 0.097 | 0.113 | 0.185 | 0.237 | 0.283 | 0.366 |
| Resolution (mg/dL) | 10.276 | 8.883 | 5.403 | 4.227 | 3.529 | 2.730 |
In addition, sensor testing has also been carried out with various diameters and the use of PANI-ZnO as a coating to replace the cladding. For a variety of diameters, the sensor was prepared with a diameter of 0.3 cm to 1.1 cm and an increment of 0.2 cm using gamma configuration and cladding. In this experiment, the sensor was not immersed in the sample but just interact with the air. The results of sensor testing are shown in Figure 5.
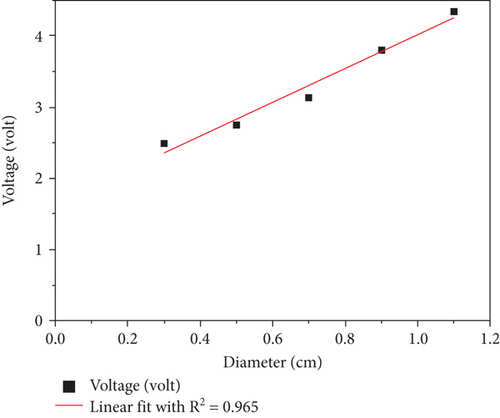
Figure 5 shows that the smaller the diameter of the sensor, the lower the output voltage that can be read on the computer. The result shows a linearity value of R2 = 0.965. The variation in diameter is carried out to prove the effect of changing the curve of the sensor on the output voltage. The smaller diameter of the sensor causes changes in light intensity received by the phototransistor and increases the power loss so that the output voltage will decrease. The last research was conducted using PANI-ZnO as a coating.
The PANI-ZnO as the coating replaces the POF cladding to detect urea level. The properties of pure PANI can be changed by using metal oxide (FeCl3), so that it can increase sensitivity, selectivity, and stability of the sensor. According to the research by Botewad et al., they studied the sensitivity of the optical fiber sensors by using the PANI-ZnO as the coating showing a linear response to urea solution and then compared the selectivity of the sensor to L-arginine, L-alanine, glucose, ascorbic acid, and thiourea. The results showed the less significant response compared to urea [20]. The measurement results of the urea level sensor based on POF with PANI-ZnO coating are shown in Figure 6.
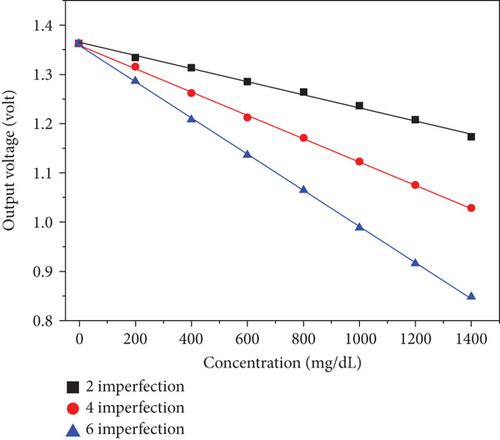
Figure 6 shows the change in output voltage due to changes in urea concentration. The type of sensor used is a band configuration with variations of 2, 4, and 6 imperfections which have been coated with PANI-ZnO. The result shows that PANI-ZnO can be used as a coating to detect urea which is indicated by the change in the output voltage due to an increase in urea concentration. The variation of imperfections given to each sensor affects the output voltage, and the best sensitivity is obtained at 6 imperfections.
The data obtained from the test results are used to analyze the characterization of the urea level sensor with cladding and without cladding, which is determined using equations (6), (7), and (8) as can be seen in Tables 2 and 3. The concentration of urea causes the refractive index of the solution to increase so that the output voltage decreases [5]. Table 1 shows the results of the calculation of the range, sensitivity, and resolution values on the urea level sensor with cladding and without cladding using gamma configuration. The more curves and imperfection are given, the higher and also the better the resolution of the range and sensitivity. Likewise, Tables 2 and 3 show that the addition of imperfection affects the value of the range, sensitivity, and sensor resolution. The more imperfection on the sensor, the higher the range, the greater the sensitivity, and the smaller the resolution. Table 4 shows that the addition of PANI-ZnO coating with a variety of imperfections gave a good response to detect urea levels. The sensor with PANI-ZnO coating on 6 imperfections shows the best value with the range value of 0.514 volt, the sensitivity value of 0.367 mvolt/mg dL-1, and the resolution value of 2.724 mg/dL. This study is under the research conducted by Arifin et al. in 2014; the addition of sensor imperfection will affect the characterization of the sensor; the more imperfection is given, the better the value of the range, sensitivity, and resolution [8]. In the previous research by Bhatia and Gupta in 2012 and Botewad et al. in 2018 to increase the sensitivity of the sensor, it requires a long process using a straight configuration optical fiber [11, 12]. Besides, Vikas et al. in 2020 show that the increase in urea concentration from the range 50-800 mM will affect the refractive index of the solution from the range 1.332 to 1.338. This indicates that the higher the urea concentration, the higher the refractive index of the sample solution will be [14]. Vikas et al.’s research is appropriate for our research. The higher urea level will impact the higher refractive index of the urea sample. Increasing refractive index, giving imperfection, and removing cladding on optical fiber sensors result in in greater power losses in optical fiber and impact the output voltage which becomes smaller and affect the characteristics of each sensor. In this study, the higher the sensitivity and the lower the resolution, the better the characteristics of the sensor. POF is suitable for increasing the sensitivity of the urea level sensor with the advantages such as high sensitivity, easy fabrication, low cost, and simple measurement process.
| Characterization | Number of imperfection variety | ||
|---|---|---|---|
| 2 | 4 | 6 | |
| Range (volt) | 0.189 | 0.334 | 0.514 |
| Sensitivity (mvolt/mg dL-1) | 0.135 | 0.239 | 0.367 |
| Resolution (mg/dL) | 7.383 | 4.190 | 2.724 |
4. Conclusion
Sensors have been made to measure urea level using POF. The results show that when urea levels increase, the output voltage decreases. The change in output voltage is inversely proportional to the level of urea levels. The more imperfection was given to the sensor, the better the sensor characterization value. The best sensor characteristic results of the urea level sensor based on POF showed the sensor with PANI-ZnO coating on 6 imperfections, without cladding using band configuration. The best result obtained the range values of 0.514 volt, the sensitivity of 0.367 mvolt/mg dL-1, and the resolution value of 2.724 mg/dL. The sensor is suitable for urea levels in medical, agricultural, or industrial application with the advantages such as high sensitivity, low cost, and ease of operation.
Conflicts of Interest
The authors declare that they have no conflicts of interest.
Acknowledgments
This research was supported by “PD-UNHAS 2020” Contract No. 1516/UN-4.22/PT.01.03/2020.
Open Research
Data Availability
The [XLS] data used to support the findings of this study are available from the corresponding author upon request.


