Phase Transformation, Microstructures, and Mechanical Properties of α + β Two-Phase Titanium Alloy Deposited Metal by Surfacing Welding
Abstract
The effect of cooling rate on phase transformation, microstructures, and mechanical properties of TC4 titanium alloy deposited metal by laser surfacing welding with filler wire was investigated by in situ observation with a high-temperature laser confocal microscope, XRD, SEM, and through microhardness test. The results showed that primary α phase began to appear at grain boundaries when the deposited metal was heated to 890.5°C, and microstructures were all composed of coarse β columnar grains after the temperature was raised to 1 190.2°C; with the increase of cooling rate during the cooling process, temperature for starting new phase transformation decreased from 943.7°C to 811.1°C, and temperature for ending the transformation increased gradually from 708.0°C to 736.2°C; when cooled to room temperature at a rate of 1°C/s, microstructures consisted of α phase; at a rate of 15°C/s, acicular α′ martensite appeared in the microstructures; at 100°C/s, the microstructures were completely comprised by acicular α′ martensite; when the cooling rate was low, V element would be slightly precipitated from αgb into the matrix; when cooling turned faster, V element had no time to enter the matrix by diffusion, so it became uniformly distributed; as the cooling rate getting faster, lamellar microstructures became thinner gradually, and microhardness of the deposited metal was improved in a gradual manner.
1. Introduction
α + β two-phase titanium alloys present good comprehensive properties by having the same thermal stability with α titanium alloys and good corrosion resistance and machinability like β titanium alloys [1, 2]. They are the most widely used titanium alloys in current application, among which TC4 alloy is the most representative. There are typically four types of microstructures for TC4 titanium alloy, namely basket-like, equiaxed, duplex, and Widmanstatten microstructures [3, 4]. Different microstructures have their own advantages in property. Weld microstructures of TC4 titanium alloy after welding are mostly composed of coarse columnar microstructure, acicular microstructure, basket-like microstructure, or Widmanstatten microstructure. Equiaxed or duplex microstructures can be rarely seen in the weld if filler wire is not used to provide supplemented beneficial elements or heat treatment is not adopted [5, 6].
The mechanism of phase transformation of two-phase titanium alloys is closely related to the redistribution of two-phase elements [7]. Semiatin et al. [8] probed into the microstructure evolution of Ti6242Si alloy during cooling at different rates after solid solution and found that Mo could control the growth of primary α phase. Wang et al. [9] conducted welding thermal simulation experiments on TC4 titanium alloy and discovered that as cooling became faster, the content of α phase decreased gradually, and α′ martensite tended to be smaller and distributed vertically and horizontally. Zhang et al. [10] studied microstructures and mechanical properties of TC16 alloy obtained at different cooling rates and revealed that the yield strength of TC16 titanium alloy gradually decreased with the increase of cooling rate, which had little effect on elongation and reduction of area.
Postweld cooling rate has a direct impact on the distribution of strengthening elements of two-phase titanium alloys, the microscopic features of various phase structural units in the weld metal, the phase transformation mode of high temperature β phase, and the microstructures and mechanical properties at room temperature. In this paper, in situ observation was conducted using a high-temperature laser confocal microscope to characterize grain growth characteristics and microstructure phase transformation of TC4 titanium alloy deposited metal under different cooling rates after solid solution in the two-phase region; EDS was used to show the distribution of Al, V, and Ti elements; XRD and microhardness tester were adopted to test phase distribution and mechanical properties of the deposited metal. The present study aims to deepen the understanding of the distribution of strengthening elements of two-phase titanium alloys in welding thermal cycle, reveal the relationship of thermal cycle, grain growth characteristics, phase transformation, microstructure and mechanical property, and finally provide basic theoretical support for the coordinated regulation of microstructure and mechanical property of two-phase titanium alloy weld metal.
2. Experimental Method
A TC4 titanium alloy plate with a dimension of 200 mm × 100 mm × 20 mm was used as the test plate. Deposited metal was obtained by using laser surfacing welding with filler wire. The filler metal was TC4 titanium alloy solid stranded wire with an outer diameter of 1.6 mm. Chemical composition off the filler wire is shown in Table 1. The test plate was polished and later acid-pickled before welding. The pickling solution was composed of 5%HF + 30%HNO3 + H2O and used to remove oil and oxides on the surface. After soaking for 30 minutes, the plate was rinsed with water to have the acid washed out and then dried for use. The welding heat source was YLS-6000 fiber laser of IPG. Welding parameters are shown in Table 2. Interlayer temperature was controlled within 120°C. In the welding process, both the front and back of the weld used Ar as the shielding gas, with a gas flow of 35 L/min. Specimens were selected from the deposited metal after laser surfacing welding with filler wire. The sampling location is shown in Figure 1.
| Plate number | Al | V | Fe | C | N | H | O | Ti |
|---|---|---|---|---|---|---|---|---|
| TC4 welding wire | 6.10 | 4.17 | 0.11 | 0.008 | 0.010 | 0.002 | 0.15 | Allowance |
| Laser Power P (W) | Welding speed V1 (m·min−1) | Wire feed speed V2 (m·min−1) | Focal length ƒ (mm) | Defocus quantity Δf (mm) |
|---|---|---|---|---|
| 4000 | 0.42 | 3.5 | 425 | +20 |
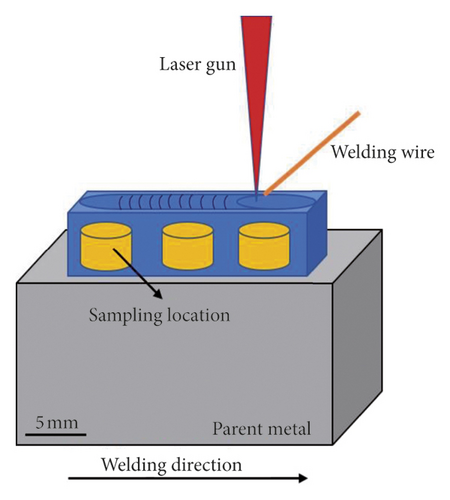
After laser welding with filler wire was completed, 3 discs of Φ 6.0 × 3.0 mm were processed at the sampling location in Figure 1. Both the up and down sides of the discs were ground and polished. Then, the discs were immersed in the HF-HNO3-H2O solution, rinsed with alcohol, and blew dry. An ultrahigh-temperature laser confocal microscope was used for the in situ observation of grain growth and phase transformation of TC4 titanium alloy deposited metal by laser surfacing welding with filler wire; D/MAX-rB X-ray diffractometer was applied to confirm deposited metal phases; EVO 18 scanning electron microscope (SEM) equipped with EDS and OLYMPUS CKX53 optical metallographic microscope (OM) were employed to test and observe strengthening element distribution and microstructure of the samples; HV-1000 micro-Vickers hardness tester was utilized to measure the microhardness of the deposited metal specimens after the previous in situ observation.
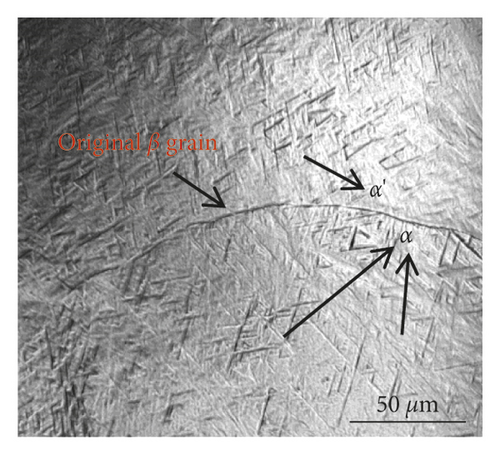
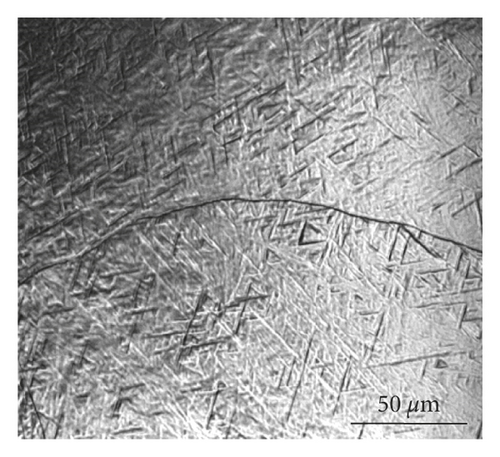
Figure 2 displays the microstructures of the deposited metal specimens of TC4 titanium alloy laser surfacing welding with filler stranded wire. It can be seen that the microstructures are made up of slight basket-like α phase, massive αm phase, acicular α′ martensite, and a very small amount of residual β phase. According to the literature [11], when the heating temperature of TC4 titanium alloy was over 998°C, it existed as bcc-β single phase. There was Burgers orientation relationship between hcp-α and bcc-β phases. Due to the symmetry of crystals, this orientation relationship determined that α phase variants with 12 crystal orientations could be formed in a β grain. Therefore, when bcc-β phase was cooled to room temperature at different cooling rates, it could be transformed to various types of α phase morphology, which determined and correlated with the properties. To further explore the transformation characteristics and patterns of titanium alloy deposited metal by laser surfacing welding with filler wire, thermal cycle process adopted in this experiment raised the temperature to 1000°C at a heating rate of 20°C/s, then heated to 1200°C at 2°C/s, and kept the temperature for 500 s to ensure complete transformation to β phase and then cooled to room temperature at a rate of 1°C/s, 15°C/s, and 100°C/s, respectively.

3. Experimental Result and Discussion
3.1. Observation of Microstructure Evolution during the Heating Process
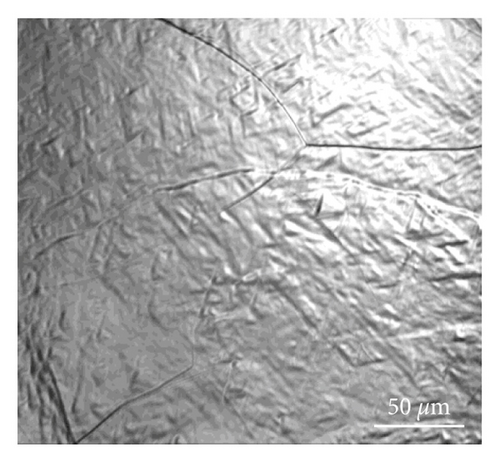
Figure 3 shows the in situ observation image of grain microstructure morphology of TC4 titanium alloy deposited metal specimens by laser surfacing welding with filler wire. When the temperature was raised to 890.5°C, primary α phase began to appear at grain boundaries. As temperature reached 992.8°C, primary phase grew rapidly, and the microstructures of deposited metal by surfacing welding were composed of straight acicular α′ phase that stopped growing at grain boundaries, basket-like α phase, and original β phase boundaries. When the temperature was as high as 1190.2°C, the deposited metal was completely transformed to coarse β phase with very obvious phase boundaries. The literature [12] concluded that during the heating process of titanium alloy, its volume change in α ⟶ β transformation was small, the stress was low, and the self-diffusion coefficient of bcc-β phase was high, so the entire heating transformation process was short, lasting only 50 s. From the study of the whole heating process, it could be found that β phase grew up in the way of phase boundary movement. The growth of β phase can be considered as its continuing epitaxial extension from β phase boundaries rather than the formation of β new phase microstructure through nucleation. In this experiment, we discovered that the transformation temperature of β phase was around 992°C.

3.2. Observation of Microstructure Evolution during the Cooling Process
Figure 4 is the in situ observation of microstructure morphology at characteristic temperature points at the cooling rates of 1°C/s, 15°C/s, and 100°C/s, respectively, during the cooling process after the deposited metal by surfacing welding was kept at 1200°C for 500 s. Figures 4(a), 4(d), and 4(g) are in situ photographs of microstructures taken when the 500s heat preservation was over and before cooling was about to start. Coarse β phase boundaries are clear and obvious. Figure 4(b) is the in situ photograph of microstructure morphology at the moment when the primary phase appeared at β-phase grain boundaries when the temperature was lowered to 943.7°C at a cooling rate of 1°C/s. Primary α phase preferentially nucleated at β-phase grain boundaries, forming continuous αgb (grain boundary). Figure 4(e) shows the in situ photograph of microstructure taken when the Widmanstatten structure began to appear at β-phase grain boundaries as the temperature dropped to 834.6°C at a rate of 15°C/s. The Widmanstatten structure grew rapidly from the β-phase grain boundaries in a lamellar colony form. Figure 4(h) is the microstructure image taken when α′ martensite appeared at 811.1°C under a rate of 100°C/s. Acicular α′ martensite was produced through shear transformation. This process was a solid-state phase transformation controlled by interface migration. The driving force for nucleation was significantly raised due to the further increase of the degree of undercooling. Nucleation occurred not only at the grain boundaries but also at the inner lamella of the grains. From the aforementioned characteristic temperature points, we can tell that the starting temperature point for the formation of new phase gradually decrease as the increase of the cooling rate.
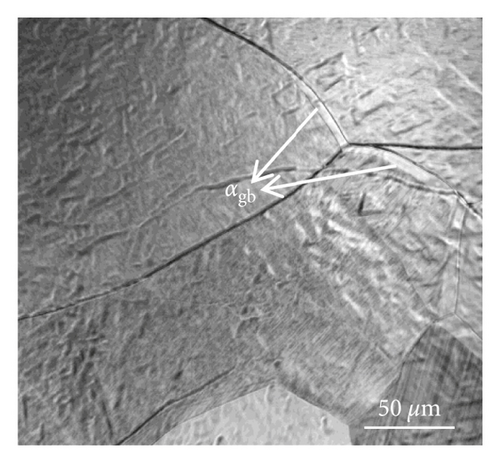
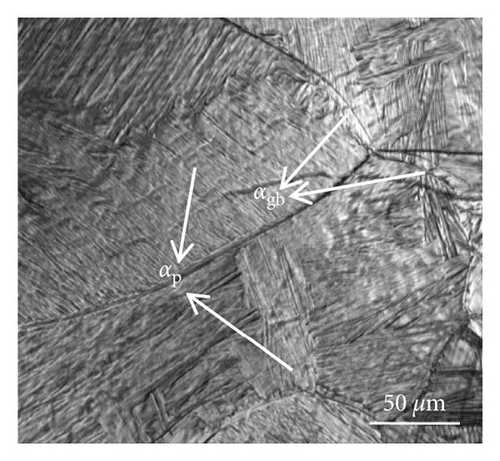
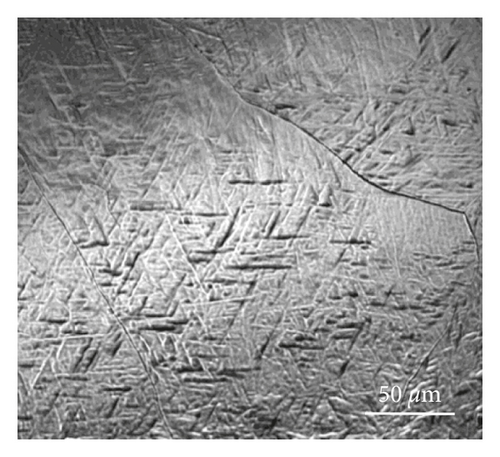
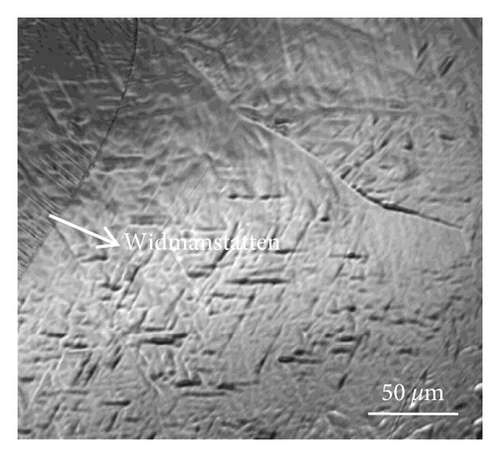

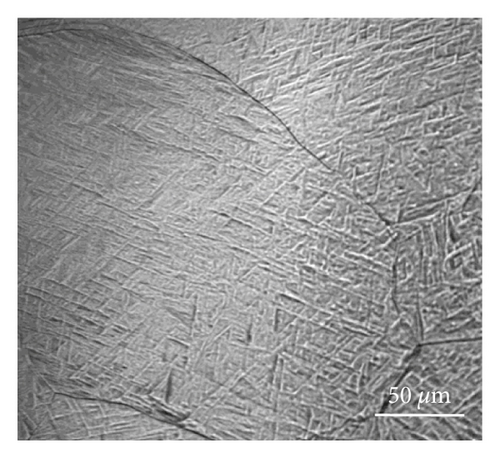
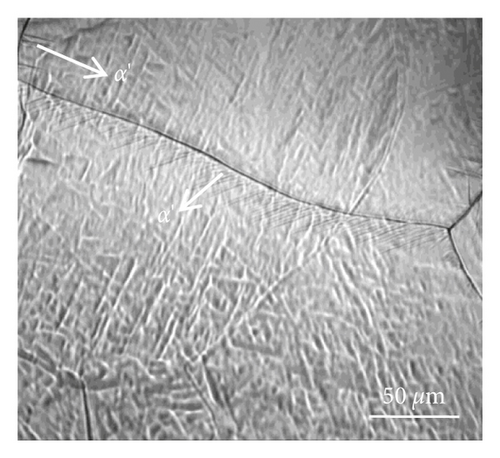
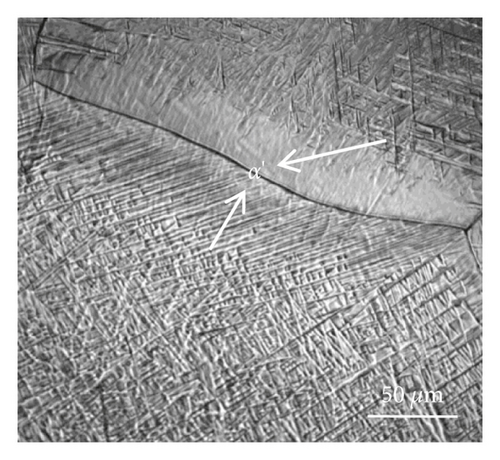
Figures 4(c), 4(f), and 4(i) are in situ photographs of microstructures at characteristic temperature points at the time of the completion of phase transformation. When the temperature was lowered to 708°C at a cooling rate of 1°C/s, microstructures of the specimens were composed of primary lamellar α phase colony αp with an aspect ratio close to 50 and a small amount of grain boundaries αgb. When cooled to 712.5°C at 15°C/s, the specimen microstructures were constituted by acicular α′ martensite colony with an aspect ratio of about 5, intragranular α phase, Widmanstatten structure, and grain boundary αgb. When the cooling rate was increased to 100°C/s, the degree of undercooling for nucleation further became larger, thus promoting the growth of the thermodynamics driving force for nucleation and resulting in the general fragmentation of original phase boundaries, which conforms to the coherent shear transformation mode. The precipitated phases were composed of fine acicular α′ martensite parallel to each other. Meanwhile, some fine secondary acicular α′ phases were interspersed between primary α′ phases. The temperature for the termination of transformation was 736.2°C. In the cooling process, it was also found that beside the nucleation of new phases at grain boundaries, some new phases also grew on primary α′ phases, making them nucleation sites, enlarging the heterogeneous nucleation rates, and improving the growth rate of the new phases. It could be also noticed from Figure 4 that the grain size of β phase was not affected by its different residence time at high temperature under various cooling rates.
3.3. Morphology of Microstructures
Figure 5 shows metallographic microstructures of three specimens which were cooled to room temperature at different rates under both low magnification and high magnification. It can be found that with the increase of the cooling rate, lamellar microstructures became gradually refined and grain boundaries show a tendency of fine and compact distribution. The microstructures of specimen obtained at 1°C/s were constituent by discontinuous grain boundaries αgb and abundant parallel coarse colony αp. Instead of nucleating inside α-phase grains, they nucleated at grain boundaries and grew into the grains bit by bit. At 15°C/s, specimen microstructures consisted of continuous grain boundary αgb, a little Widmanstatten structure and α′ martensite, and intragranular stripe-like α phase. Nucleation occurred at both grain boundaries and inside the grains, with grains growing almost simultaneously and a small amount of basket-like lamellar microstructures formed. From the literature [13], it can be noticed that the interaction between the intragranular stripe-like α phase and the grain boundary α phase might affect the spheroidization of the latter. The grain boundary α phase and the adjacent β phase satisfied a strict Burgers orientation relationship, which was stable and difficult to break [14]. When meeting grain boundary α phases, intragranular stripe-like α phases continued to grow laterally. Therefore, they needed to continuously dissolute intragranular stripe-like α phases with uncertain crystal orientation at the other side. As the ends of the two kinds of intragranular stripe-like α phases got contacted, they stopped growing. This is the reason for an uneven surface of grain boundary αgb. At 100°C/s, the microstructures of the specimens were comprised by short acicular α′ martensite and basket-like α′ martensite with a large aspect ratio. An intersection of a great number of acicular α′ martensite could be observed. In the rapid cooling process, there was only a very small amount of residual β phases, which distributed at the boundaries of primary α′ martensite. The continuous cooling process generated abundant secondary acicular α′ martensite. The rapid cooling rate and the only residual β phase combinedly further restrain the growth of secondary α′ martensite. Therefore, α′ martensite obtained at 100°C/s was fine.
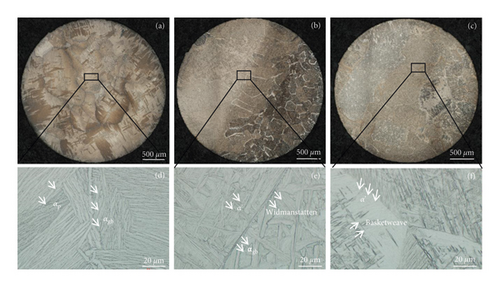
From the observation of microstructures in Figures 5(d), 5(e), and 5(f), it can be found that the residual β-grain boundaries are with two morphologies, discontinuous and continuous, respectively. As shown in Figure 5(a), there are discontinuous residual β-grain boundaries, which are interruptedly composed of grain boundary αgb. By analysis, it is believed that the discontinuous grain boundaries were formed because the microstructures were obtained through the diffusion and phase transformation of high-temperature β phase at a relatively lower cooling rate. The degree of undercooling was low, and the grain nucleus could only form at grain boundaries and grew to grain boundary αgb. The growth was slow, and grain nucleus could not distribute in chain along the grain boundaries. The microstructures shown in Figures 5(e) and 5(f) were obtained by the rapid cooling of high temperature β phase. The degree of undercooling was high, so there was enough nucleation driving force to promote the nucleation of primary phases and their growth into continuous grain boundaries.
3.4. SEM Morphology and EDS Analysis
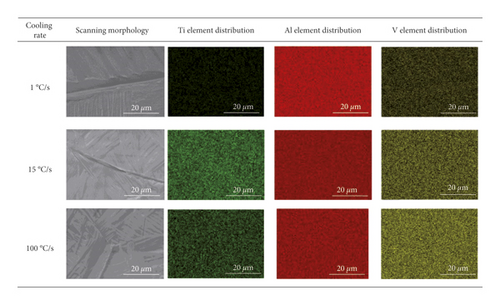
Figure 6 presents SEM morphology and EDS analysis result of deposited metal specimens under different cooling rates. It can be seen that the thickness of the lamella gradually decreases with the increase of the cooling rate. The long acicular phase structure got destroyed more and more seriously and will not stop until to the extent that martensite growth direction was interrupted and small and irregular acicular α′ martensite was formed. Under the condition of continuous cooling, as the degree of undercooling got higher, the diffusion capacity of β-phase stabilizer V atoms became weakened, so migration over a large distance was not easy to occur and a new phase with small lamella spacing was formed; additionally, the migration of new phase was further hindered due to the relatively high dislocation density and twinning. Analysis of element mapping demonstrated that Ti and Al elements were uniformly distributed at different cooling rates. At over 15°C/s, V element was evenly distributed. At 1°C/s, V element was visible and slightly coincided with the lath shape. This explains why in the β⟶α stage, the changes of cooling rate could not cause the redistribution of Ti and Al elements. However, when the cooling rate was low, V element would be slightly precipitated from αgb into the matrix; when cooling turned faster, V element had no time to enter the matrix by diffusion, so it became uniformly distributed.
3.5. Microhardness and XRD Test
Hardness is an important index of mechanical property to evaluate the properties of titanium alloy welded joint. Sufficient hardness can ensure the high strength and good wear resistance of titanium alloy welded joints in service, thereby increasing the service life of titanium alloy welded component. Figure 7 is the HV0.5 of the room temperature microstructure of TC4 titanium alloy deposited metal specimen obtained by laser surfacing welding with filler wire under different cooling rates. It is visible that microhardness increases linearly with the increase of cooling rate. As cooling became faster, temperature for starting phase transformation decreased, resulting in the raise of the degree of undercooling and reduction of phase spacing (as shown in Figure 6). The increase of the area of the grain boundaries would improve the ability to hinder dislocation glide [15]. Meanwhile, acicular α′ martensite has denser dislocation and twinning than α phase [16], which helps to produce more grain boundaries. Due to all mentioned afore, the faster the cooling rate, the more acicular α′ martensite obtained and the higher the hardness of deposited metal specimens.

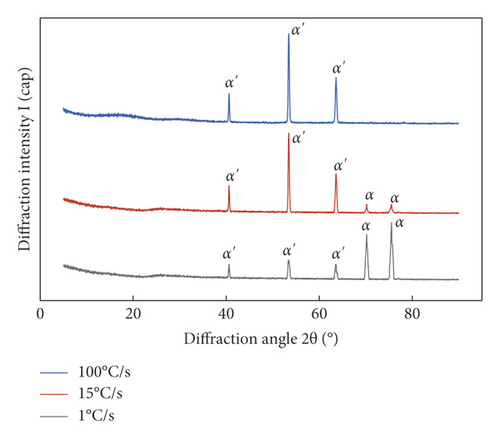
The XRD analysis results of deposited metal specimens obtained at different cooling rates are shown in Figure 8. With the same HCP lattice structure, α′ and α have basically the same diffraction spectrum but with slightly different lattice constants. The lattice constant ratio of α phase is c/a = 1.5867 and that of α′ martensite is c/a = 1.5956. The diffraction patterns of the deposited metal specimens obtained at different cooling rates are distinguished significantly. As the cooling rate increased, resistance to the reorganization of β-phase lattice reduced [17]. It could be easily transformed to α′ martensite with HCP structure. Therefore, as the cooling rate increased, the diffraction peaks of α′ became stronger and α diffraction peaks reduced.
4. Conclusion
- (1)
When heating to 890.5°C, primary α phase appeared at grain boundaries; when temperature was raised to 1190.2°C, microstructures were composed of coarse β-columnar grains. β phase produced new β-grain microstructures by the way of grain boundary movement instead of nucleation.
- (2)
When cooled to 943.7°C, 834.6°C, and 811.1°C at a rate of 1°C/s, 15°C/s, and 100°C/s, respectively, microstructures of new phase appeared. When temperature was lowered to 708°C, 712.5°C, and 736.2°C, the new phases completed transformation. As the cooling rate increased, temperature at which the new phase began to appear gradually decreased. The higher the temperature for the completion of new phase transformation, the narrower the temperature range of phase transformation.
- (3)
At a cooling rate of 1°C/s, microstructures consisted of αgb and αp; at 15°C/s, microstructures consisted of continuous grain boundary αgb, a little Widmanstatten structure and α′ martensite, and intragranular stripe-like α phase; at 100°C/s, the microstructures were comprised by short acicular α′ martensite and basket-like α′ martensite.
- (4)
As the cooling rate increased, lamella spacing of the new phase gradually narrowed and phase boundary area and microhardness increased; weld microstructures were completely composed of HCP structure.
Conflicts of Interest
The authors declare that they have no conflicts of interest.
Acknowledgments
This study was supported by the National Key Research and Development Plan of China (2021YFB3401100), Heilongjiang Head Goose Action Plan-advanced Welding Technology Innovation Team of Energy Equipment (201916120), and Open Project of the State Key Laboratory of New Brazing Materials and Technology (SKLABFMT202005).
Open Research
Data Availability
The data used to support the findings of this study are available from the corresponding author upon request.


