Pavement Crack Extraction Method from Mobile Laser Scanning Point Cloud
Abstract
The automatic detection of cracks in the road surface is of great significance for maintaining the road surface to ensure the safety of moving vehicles. The Hokuyo UTM 30 LX 2D laser scanner in this study is used to observe the road surface containing two cracks and distress areas. As a result, dense point clouds are created. The road surface is automatically extracted from the point clouds based on the geometry of the two curb lines. The normal vector of the points is calculated based on the principal component analysis method. Points belonging to cracks and zones of distress are extracted from the intensity gradient and the inclination angle between the two normal vectors of the neighboring points and then converted to binary images. The crack edges are extracted based on the Sobel operator. Although salt-and-pepper spots due to crack points extraction using intensity gradient affect the definition of crack edges, especially small cracks, large cracks and distress areas are extracted clearly. Research results show that reflectance intensity and elevation variation combination lead to the efficiency of crack extraction and distress area.
1. Introduction
Pavement crack might damage vehicles and increase traffic accidents. Pavement crack detection is essential for maintenance. If cracks start to be generated by various physical factors, they may be extended to severe damage by the vehicle’s wheels. Therefore, cracks need to be recognized and repaired at an early stage. Pavement cracking implies an essential index for maintaining roads by the government, an indicator of damage, and significantly affects the durability of construction. The road will be degraded, and the cracks on the road surface will appear along with the time. If these cracks are not timely detected, they will expand and affect driving conditions, safety, and the strength of the pavement structure. The crack is classified into transverse, longitudinal, and alligator cracks [1]. Most of the studies have focused on only one or two distress types. The detection of cracks is essential for performing pavement rehabilitation and maintenance. Currently, large-scale efforts to identify pavement cracks manually are of low efficiency but high cost and exposure to vehicle traffic. This technique is labor-consuming but has low accuracy on a large scale. It is necessary to find out crack by another quick and effective method.
Image processing has been used as an effective method for indirect inspection. Based on this method, automated road surface monitoring systems have been developed. Thanks to automated monitoring solutions, the pavement is maintained by reducing costs and increasing efficiency. The monitoring system can be created with many sensors acquiring the image and video data as the input data for crack extraction [2–4]. From collected images, cracks can be detected by applying various image processing methods often affected by light, shadows, and noise; therefore, the actual image processing of complex road cracks makes a technical challenge for crack detection. Automated pavement crack detection based on image analysis includes image processing, machine learning, and deep learning approaches [5–8]. In the case of image processing, methods are mainly based on texture analysis, including image thresholding or edge detection techniques. The typical approach is based on grayscale threshold segmentation because of the low grayscale value of pavement cracks. The background and crack regions are separated from the image based on a threshold value of pixel greyscale. The other image analyzing methods are based on image edge detection, such as applying the Sobel edge detector [9] and the CrackTree algorithm [10]. Moreover, there are various methods that have been used for extracting pavement crack images, such as morphology methods [11]; wavelet transforms [12]; and principal component analysis [13]. In addition, many machine learning-based algorithms have become famous for detecting cracks from images, including Support Vector Machine [14, 15] and Convolutional Neural Networks (CNN) [16–19].
The two-dimensional (2D) crack detection method is generally limited by visualizing the terrain and road damage, affecting crack evaluation. Exploring the processes for detection and quantification in 3 dimensions (3D) is better. A 3D point cloud can be created from photos or scanning data. Laser scanning is an effective solution for collecting 3D point cloud data quickly. UAV-based images have been captured to generate 3D point clouds and orthoimages of road surfaces. Then, the cracks are obtained directly on the generated DSM by setting the threshold [20]. However, this method will not work for small or shallow cracks.
In recent years, mobile laser scanning (MLS) systems have been applied for surveying roads and pavement with fast and high precision. Many types of research have been investigated to extract pavement cracks from point clouds collected by MLS. Road surfaces can be manually extracted from the available data set for preparing data. The automated road surface extraction can be done based on the third component of the normal vector [20] or identify the buffer zone of the trajectory line [21]. For further analysis of cracks, the 3D point cloud can be projected to 2D images and applied for crack extraction [22]. Another method is to extract the crack directly from the point cloud using the intensity-threshold segmentation method based on the low intensity of the damage. However, in real situations, the point cloud might also contain uneven intensity cracks, road markings, stains, and sensor noise. The intensity data highly depends on the scanning range from the laser sensor to the target, the laser beam’s incidence angle, and the target’s material properties. As a result of divergent points, both sides’ point intensities were low and high at the center. In such a situation, intensity threshold does not give effective results. It leads to the disadvantage of using an intensity threshold to identify crack candidates.
On the other hand, elevation changes can be checked to get the information on the crack. A novel algorithm has been developed, combining intensity and elevation data to extract crack edges [23]. However, some cracks are too shallow to be detected by MLS data. Moreover, most data collection systems are complex and expensive and must be installed on special inspection vehicles. Therefore, the pavement inspection of the laser scanning system is limited.
Because of the importance of detecting cracks on pavements and the advantages of the laser scanner method, this study aims to detect pavement cracks using a low-cost 2D laser scanner. The chosen laser scanner is Hokuyo 30LX, a low-cost and lightweight laser scanner. This study proposed the method for automatedly extracting cracks and their affected areas from the point cloud generated from the raw file by combining the intensity and elevation data to solve the problem of detecting cracks.
2. Data Acquisition
2.1. System Description
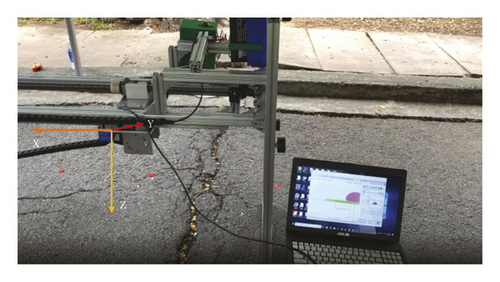
In this study, the Hokuyo UTM 30LX laser scanner is chosen to develop the mobile laser scanning system (Figure 1). The laser scanner selected is a low-cost, compact, small, and lightweight device used for many outdoor applications (Table 1). The scanner is assembled into a particular frame. The chosen laser scanner is mounted on a frame approximately 50 cm above the ground surface at the installation height, resulting in a small scanning footprint (approximate 1 mm × 5 mm). The laser scanner can move along the slide rail under the motor power to capture the road surface image at a 25 msec/scan rate. The velocity controller can control the moving speed of the scanner. The system is a test for a future vehicle-mounted system. During data acquisition, the scanner moves along the rail to simulate the future system’s movement on the road. The 2D scanners’ scan rays always belong to a fixed scanning plane. The scanning plane can be set perpendicular or at an oblique angle to the horizontal plane. This feature is entirely different from terrestrial laser scanners (TLS). Specifically, the position of a point received by TLS is determined through 3 components of the spherical coordinates system, including observed distance, horizontal sweep angle φ, and azimuth θ. However, for 2D scanners, the azimuth value is permanently fixed at 0.
| Model no. | UTM-30LX |
|---|---|
| Power source | 12VDC ± 10% |
| Light source | Semiconductor laser diode (λ = 905 nm) |
| Detection range | 0.1 to 30 m (max 60 m) |
| Accuracy | 0.1 to 10 m: ±30 mm, 10 to 30 m: ±50 mm |
| Angular resolution | 0.25° (360°/1,440 steps) |
| Field of view | 270° |
| Scan time | 25 msec/scan |
| Weight | Approx. 370 g (with cable attachment) |
2.2. Data Collection
Most major pavement defects that can be detected from images are potholes. These damage areas are characterized by forming a significant depression on the pavement surface. These types of damage can be easily identified by establishing a local surface in that area and performing elevation matching. However, in this study, we focus on small cracks that are long and are the initial damage stage before potholes are formed. The road surface will be raised at that time to create bumpy areas compared to the original road surface. Moreover, these elevation differences are not so significant as in the case of potholes that they are difficult to detect through processing the point cloud generated from the image.
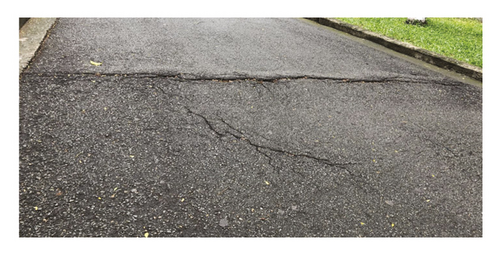
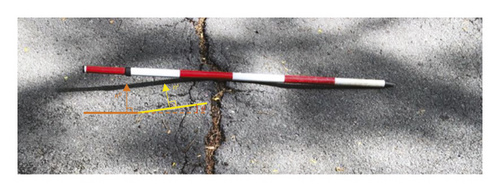
The study area was chosen for convenient data collection at the Ho Chi Minh City University of Technology-VNUHCM. The experiment was performed in two different regions. The first area contained a big crack with the lifted-up road surface, and the second included a small gap with a flat surface (Figure 2). The developed system collected the test dataset. The scanner measured the surface with 180 degrees field of view at 50 cm above the road surface and oriented perpendicular to the moving direction. From this observed distance, with a small scanning footprint (approximate 1 mm × 5 mm), the 2D scanning plane was perpendicular to the horizontal plane. The scanner was connected to the laptop. For starting a scan, the motor speed was established at 50 mm/s, and the angular resolution was 0.25 degrees (Figure 1). Observed data were collected by using the UrgBenri Plus program. As a result, the raw data with ∗.ubh file format was saved to the computer. The experiment showed a point cloud in the spacing between adjacent scan lines of approximately 1.25 mm and between adjoining laser points of 2.2 mm in the road. As a result of divergent points, both sides’ point intensities were low and high at the center. It leads to the disadvantage of using an intensity threshold to identify crack candidates. In addition, the road surface was lifted because of the tree root. This situation indicated the challenge of extracting cracks based on the altitude changes in the background. Moreover, the large crack could not be fully observed because of data acquisition at a low height of 50 cm. The large crack was scanned twice at two locations to ensure sufficient data extraction information.
3. Methodology and Results
3.1. Point Cloud Generation
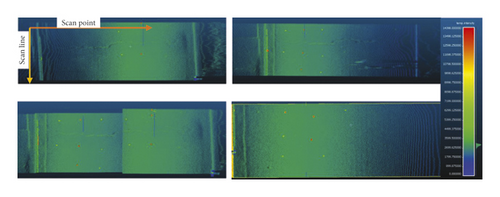
In this way, the scan points do not overlap, and the position of the scan points can be determined through the row and column values where the row is the number of the scan line, and the column is the number of the scan point. Then, two point clouds are combined to make the whole image of the large crack with dense density (Figure 4). In general, point clouds are created with a very dense density. Each experimental data sample has over 1 million scan points. The distance between the scanning points is 2.2 mm in the direction of the scanner movement and 1.25 mm in the direction perpendicular to them. The density of generated point cloud is approximately 275,000 points per square meter. The high reflectance value implies the location of reflectance markers. The intensity data highly depends on the scanning range from the laser sensor to the target. As a result of divergent points, both sides’ point intensities were low and high at the center.
3.2. Road Surface Points’ Extraction


3.3. Point Cloud Noise Removal
Many objects appear inside the data collection area during the data collection process, so the noise points appear within the limited range of the road surface. The noisy issues must be eliminated to ensure the correct crack detection process. Based on the characteristics of the road surface as a flat horizontal surface, noisy points above the road surface can be aggregated into any character that matches an oblique angle to the horizontal plane. The normal vector analysis method is proposed to eliminate the noise points. The normal vector of all points is determined through principal component analysis of a group of adjacent points to the considered point for future analysis. The smallest eigenvalue is the normal vector of the target point. It is necessary to estimate the local plane represented by the target point and its neighbors. The k-nearest points are identified for each point in the cloud. In this study, the normal vector is computed from 7 points and is oriented using the Minimum Spanning Tree method. This method attempts to reorient all the normal vectors of a cloud. It starts from a random point and then propagates the normal orientation from one neighbor point to another. If the points on the road surface belong to the flat or near horizontal plane, the normal vector is approximately parallel to the z-axis. When the normal vector is analyzed into components in 3 directions, the Nz perpendicular to the horizontal plane will prevail if a point belongs to the road surface. Therefore, the excluded noise points are those whose Nz-component of the normal vector is less than the threshold value. In this case, the threshold value is determined at 0.75 to ensure the predominance of Nz over the other two components (Figure 6).
3.4. Crack Candidates’ Extraction
As mentioned in many other studies, the scan points located in the crack have a different contrast value than the rest. This contrast can be caused by the difference in height and angle of incidence of the scan ray. In most studies, the reflected intensity values at the crack are usually smaller than those in the remaining areas. However, in this study, the opposite is true. Cloud data acquired by the Hokuyo UTM 30LX scanner results in a higher reflectance intensity at the cracks than in other areas. Several reflective stickers are arranged to create noise areas with high reflectance values during data acquisition to ensure the correctness of the proposed solution. In addition, the reflected intensity value decreases gradually due to the influence of the inclined scanning angle in the far area compared to the frontal scanning position. Therefore, the author proposes to use both reflected intensity and the height of scan points to determine the points belonging to the crack.

3.5. Distress Area Extraction
3.6. Crack Edge Detection
4. Discussion
In this study, the Hokuyo UTM 30LX laser scanner is used to collect the information on the pavement surface to detect the crack. Two cracks are observed with the scanner. The large and long crack with 4.0 cm width creates a lift-up distress area, and the small crack has 1.0 cm width. As a result of data acquisition at a low height of 50 cm, the large crack could not be fully observed. It is scanned twice at two locations to obtain the whole crack image. The environment around the chosen pavement is complicated because of the crowded people. As a result, a dense density of point clouds generated according to equation (1) contains noisy points. The scan points do not overlap. From the resulting point cloud generation, the image of pavement is visualized.
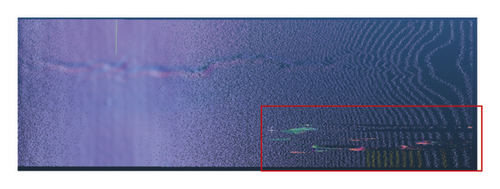
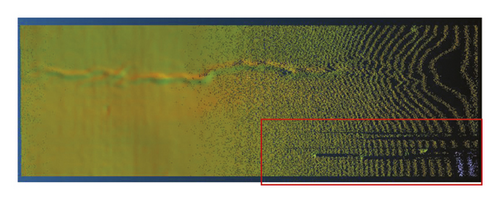
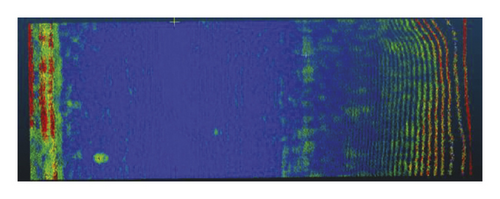
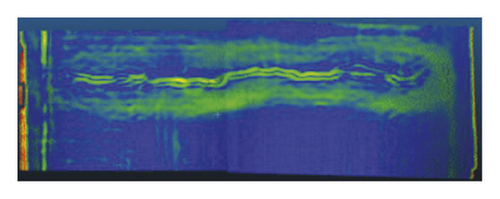
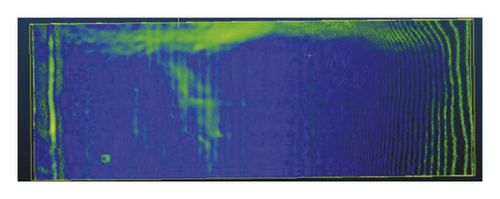
The 3D visualization of the crack from the point cloud is quite evident based on the reflectance value of laser pulses (Figure 4). Large cracks are clearly shown. The intensity decreases with the increase of the scanning angle. The intensity at the center is more significant than that on both sides. The intensity at the crack site and the reflective panels is much higher than the rest of the area (Figures 4(a) and 4(b)). In the case of a large crack, the depth of the crack can be measured. For smaller and shallower cracks, the crack location can only be determined visually through a contrast of intensity. In general, point clouds are created with a very dense density. Each experimental data sample has over 1 million scan points. The scanning point clouds also contain a lot of roadside noise information and traces of pedestrians. Due to the influence of inclination angle in the farther area, the density of points gradually thins out (Figure 4(a) and 4(b)). Two point clouds of the large crack are combined to ensure the point’s density for data analysis (Figure 4(c)).
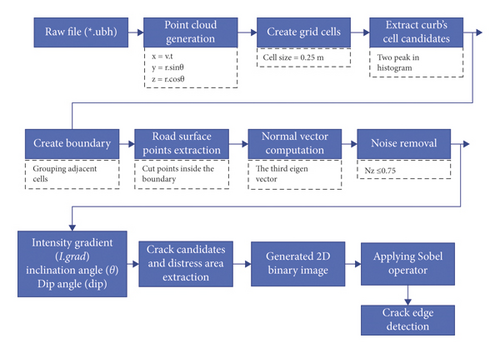
The target road surface is divided into many cells with 0.25 m in both sizes for data processing. The elevation histogram of each cell is defined with a bin size of 2 mm. The peak of the histogram is identified (see equation (2)). Cells with more than one peak are classified as noisy cells. Noise cells will include road cells with noisy points, outlier, and curb cells (Figure 5(b)). Among the noisy cells, bimodal histogram cells are defined as curb cells used to determine the road surface’s boundary (Figure 5(c)). According to the results of pavement extraction from the available data scan, the data processing speed and the results depend on the size of the grid cells. The curb cell cannot be identified if the subdivision is too tiny because the histogram will not match bimodal histograms. Several noisy cells with two peak distribution histograms will be misclassified into the curb cell. Because of the continuous curb line, these misclassified cells will be eliminated when the curb line is generated. The road surface is extracted based on the curb line (Figure 5(d)).
The principal component analysis method is applied to determine the normal vector of the scan points. A neighborhood detection algorithm selects 6 points near the considered point. A plane is created from a set of 7 points; the normal vector is defined as the smallest eigenvalue vector calculated from the set of points. As mentioned above, the normal vector is analyzed into three main components in the three directions x, y, and z. Based on the declared characteristics of the coordinate system of the cloud, the z-direction is determined to be the direction perpendicular to the road surface. The Nz-component of the road point will be more significant than that of the noise points not on the road. Therefore, to ensure the exclusion of noise points, points with Nz values less than 0.75 will be classified as noise points and discarded. This way, the noise points have been filtered almost entirely (Figure 6), and the data is ready for further analysis.
The crack points might be separated based on the gradient of normalized intensity and z-value. However, in this study, the value of z variation is not enough to identify the crack due to the shallow crack. Due to the high density of points, the elevation variation is continuous, but the elevation difference is negligible (Figure 10). Therefore, the results of calculating the elevation gradient show no efficiency. As a result, the elevation variation results do not indicate crack locations or distress zones in this case.


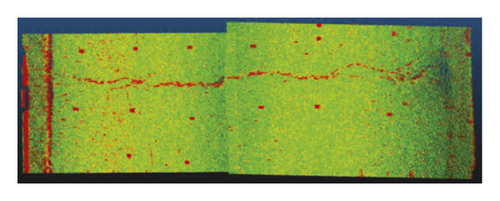
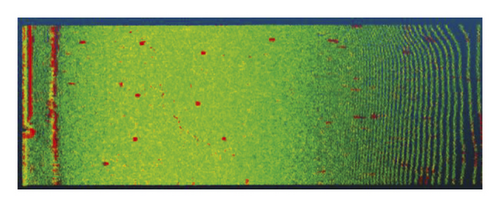
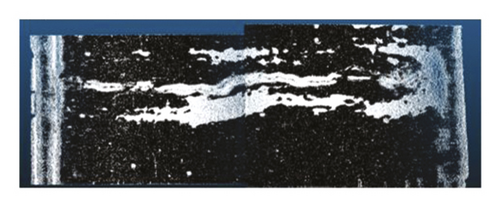
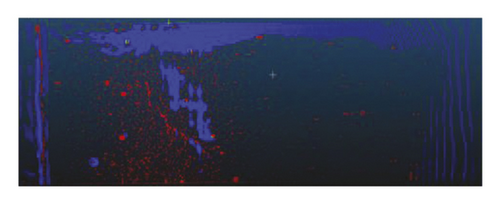
For the intensity gradient method, the results are better for both cracks. After computing the intensity gradient, a threshold value is applied to extract crack points. The position and shape of the cracks have been determined and separated from the point cloud. In this way, points inside cracks with higher intensity than the background are extracted (Figure 7(a) and 7(b)). However, crack points close to the road surface with low intensity cannot be recognized. Moreover, many salt-and-pepper spots are also detected. It leads to the difficulty of generating a crack skeleton.
In the next option, elevation data is used to determine the point belonging to the crack edge. When a crack forms, it creates an inclined surface relative to the neighbor plane of the pavement. For this, the inclination angle is computed from the normal direction of the considered point to its neighbor (see equation (5)). Then, the crack edge point is extracted (Figure 7(c)). Only points located at the boundary of the suddenly changing elevation can be identified this way. Specifically, we cannot detect cracks through the inclined angle value for small cracks due to the continuous changing of elevation of the surface (Figure 7(d)).
The crack distress area, which implies the lift-up area surrounding the crack, can be extracted based on the geometrical characteristics of the road surface. Dip angle can be used to identify the crack points. By applying (6), the dip angle is computed. A threshold value is determined to extract the crack points (Figures 9(a) and 9(b)). Finally, the crack points are the combined points extracted from the intensity gradient and dip angle (Figures 9(c) and 9(d)).
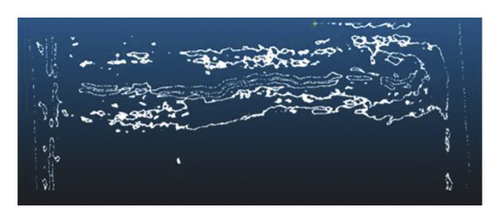
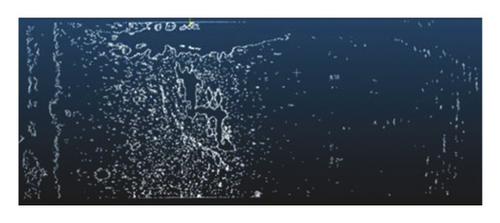
After extracting the crack point candidates, the crack skeleton will be extracted. For this, a binary image is generated with crack points having a value of 1. Then, the Sobel operator with a 3 × 3 kernel is applied to extract the boundary points of the crack and extracted area. Connecting boundary points create the crack boundary (Figures 9(a) and 9(b)). The value of intensity depends on many factors. From the results of point extraction of the crack and the distress area, it can be seen that, for prominent distress locations, forming regions with elevation variation, the interpretation of the dip angle will give better results. The reflectance intensity value depends on too many factors, such as scanning angle and external conditions, leading to the misclassification of points. It leads to salt-and-pepper spots and difficulty removing the noise points to create the crack skeleton. In addition, the reflected intensity value sometimes cannot detect the elevation variable regions, as with small cracks. On the dense point cloud, only a small, long crack is noticed. But in fact, next to the crack, there is an area protruding, causing a high amplitude even though the surface crack has not been created. The road surface is not smooth. There are many pits, so it is inevitable to classify salt-and-pepper points due to the intensity of the reflection. The research shows that combining the reflected intensity and elevation values by calculating inclination angles will improve the target of crack and damaged area extraction. In addition, we can predict the area of destruction in the future, which cannot be detected by just looking at photos or video recordings.
In the case of the small crack, the elevation change cannot be applied because of the shadow crack. The crack can only be extracted using the intensity gradient. As a result, crack points with low intensity cannot be extracted. Moreover, in sparse density areas, there are many misclassified points. The input point cloud requires a dense and continuous point cloud to get good results. By checking the dip angle, the distress area can be extracted.
As a result, the crack edge and the boundary of the distress area are extracted after applying the Sobel operator. Based on the results, at the large crack location, the crack shape is also clearly shown with two edges and a centerline representing the bottom position of the crack. However, there is too much disturbance for small cracks due to the salt-and-pepper spots. The boundary of the distress area is visible, but the location of the small crack is indistinguishable. The results show that it is possible to extract the crack image seen on the point cloud due to the intensity difference. Through the elevation difference value, the distress area is also determined. It confirms the effectiveness of combining intensity and elevation values.
5. Conclusion
This study uses a laser scanner Hokuyo UTM 30 LX to observe the road surface. Although the study area is small, it has all the characteristics of a complex crack. The experimental region consists of 2 cracks: one large obvious crack and one smaller crack with no observed crack depth. Around the crack, many distress areas are raised higher than the ground. As a result, a dense point cloud is generated. The crack shape can be visualized by displaying the laser pulse’s reflectance value. Specifically, the large crack is made up of two neighboring point clouds. The crack image is evident due to the high reflectivity at the location inside the crack. However, the distress regions are not discernible from the reflection intensity. Therefore, calculating the inclined and dip angles will help detect the area with the variation in elevation, specifically, elevated regions due to the influence of tree roots. Because of the optical nature of laser scanning, both 2D and 3D laser scanners cannot measure any surface that is out of the scanner’s line of sight. This means that hidden or internal geometry not visible to the scanner cannot be measured. Scans are taken from many angles to ensure a complete model, but complex geometry may still be a problem, as it commonly occurs with holes or threads. However, the initial cost of using a 3D laser scanner can be quite expensive. On average, industrial 3D laser scanners cost anywhere from tens to several hundred thousand US dollars. The used scanners that cost several thousand US dollars are many times cheaper than TLS scanners. In this study, a scanning range of 30 m is far enough for mobile device-mounted applications to observe road surfaces. The resulting scan point density is thick and sufficient for further analysis. The results show that the road surface is automatically separated through the continuous characteristic of the curb. The noise points are extracted based on the geometrical features of the road surface. Specifically, the Nz-component of the normal vector is used to remove noise points above the road surface. Based on reflectance change at the crack, crack points are separated based on the intensity gradient. Then, points close to the crack edge with weak reflectivity are extracted based on the value of the inclination angles. The surface raised or lowered than the horizontal surface is detected through the value of the dip angle. The resulting crack points are used to generate binary images. The crack edge and distress region edge are extracted using the Sobel operator from this binary image. Finally, the crack edges are extracted. The study results show the effectiveness of combining elevation and strength data to extract crack information. However, the use of intensity will encounter salt-and-pepper spots. These areas significantly affect the generation of crack edges. Therefore, it is necessary to have a method to filter out salt-and-pepper spots more effectively shortly.
Conflicts of Interest
The authors declare that they have no conflicts of interest regarding the publication of this paper.
Acknowledgments
This study was funded by Vietnam National University-Ho Chi Minh City University of Technology (Grant no. To-KTXD-2020-05).
Open Research
Data Availability
Data are available from the corresponding author upon request.


