Analysis of Ecological Environment Evaluation and Coupled and Coordinated Development of Smart Cities Based on Multisource Data
Abstract
In order to further enhance the ecological environment construction of smart cities and promote its deep integration with advanced technologies, such as the new generation of artificial intelligence and big data, this study constructs a data fusion framework for the ecological environment of smart cities driven by multisource data and constructs an ecological environment evaluation index system of smart cities in Guangzhou from 2010 to 2018. The ecological environment status of smart cities in Guangzhou is analyzed by principal component analysis, and finally the, correlation influence degree of each principal component content on the ecological environment index of smart cities is analyzed. The results show that environmental excellence (K1), environmental restoration response (K2), and environmental pollution pressure (K3) are the main components of the ecological environment in Guangzhou smart city. The environmental excellence and environmental restoration response level are relatively high, and the environmental pressure system is relatively low, in which the greenland coverage rate increases from 41.3% to 44.0%, and the urban sewage treatment rate and the decontamination rate of urban refuse increase year by year, from 73.1% to 94.6% and from 72.1% to 99.9%, respectively. The results of principal component correlation analysis show that there are interactive influences among environmental excellence (K1), environmental restoration response (K2), and environmental pollution pressure (K3). The ecological environment index of smart cities increases with the improvement of environmental excellence and environmental restoration response capacity, but gradually decreases with the increase of environmental pollution pressure. Generally speaking, improving environmental excellence and environmental restoration response will be the key to improve the ecological environment construction capacity of smart cities in the future.
1. Introduction
Nology to all walks of life in the city, so as to realize the deep integration of urban informatization, industrialization, ecologicalization, and urbanization, improves the quality of urbanization, realizes fine and dynamic management, and improves the effectiveness of urban management and the quality of life of citizens [1, 2]. Up to now, smart city is no longer an independent informatization and digitization but the embodiment of a series of integrated services and operation capabilities of finance, science and technology, data, ecological environment, and other applications [3, 4]. The 2018 China Network Security and informatization Work Conference pointed out that it is necessary to vigorously promote the in-depth integration of artificial intelligence, big data, digitization, informatization, and urban development to provide a strong technical guarantee for the construction of smart cities. Taking the “1 + N + 1” comprehensive solutions of smart city as an example, 1 represents the smart city cloud, which is the digital base of the city; N represents the smart city cloud as the support, through the cross-border and fusion application of cloud data, to create solutions for N industries, including urban greening, environmental pollution control, transportation, medical health, AI education, and other different scenarios, and finally forms a smart city brain by integration [5].
The construction of ecological civilization is an essential link in the development process of smart city [6, 7]. In recent years, the contradiction between the rapid economic development and the construction of ecological environment has become increasingly obvious. As a densely populated area, the city is facing the problems of weakening environmental greening, ecological environment pollution, and scarcity of natural resources in the development process [8, 9]. The 19th National Congress of China clearly pointed out in the construction of smart cities and ecological civilization that in the future, the integration of ecological environment and smart city should be accelerated based on the concepts of green, low-carbon, convenient, efficient, and rapid response; under the support of new generation of information technology, the green smart city should be built to play the basic role of environmental informatization in China’s environmental management innovation [10, 11]. Therefore, improving the ecological environment construction of smart city and promoting its deep integration with the new generation of artificial intelligence, big data, and other advanced technologies will be the development trend of smart and ecological city in the future [12]. Guangzhou, as a national pilot smart city, is also the core of Guangdong’s smart city cluster, and its construction and development model can be used as a construction sample for Guangdong and even the whole country. However, the existing studies still focus on the evaluation of information technology and technological innovation, while ignoring the importance of ecological environment construction.
Based on this, this study takes the first batch of smart cities, Guangzhou as the research object, according to the opinions and suggestions on the development of “smart city” and “ecological civilization” in the new urbanization construction, constructs a data fusion framework for the ecological environment of smart cities driven by multisource data, constructs the Guangzhou smart city ecological environment evaluation index system from 2010 to 2018, and uses the principal component analysis method to analyze the ecological environment status of smart cities in Guangzhou. Finally, by constructing response surface model, this paper analyzes the correlation influence degree of each principal component content on the ecological environment index of smart cities, thus revealing the current development trend of ecological environment construction of smart cities in Guangzhou.
2. Materials and Methods
2.1. Construction of Environment Evaluation Index System
The ecological environment evaluation system of smart city is a systematic analysis of comprehensive factors such as natural ecological environment, environmental governance, and environmental carrying capacity. Based on this, this paper focuses on the ecological environment evaluation of smart cities and focuses on the evaluation of the ecological environment of smart cities, with emphasis on the three main factors of environmental state, environmental response, and environmental pressure corresponding to the ecological environment construction, while following the principles of systematic, complete, quantifiable, and traceable data to determine the ecological environment evaluation indicators. This study selects nine indexes, such as greenland coverage rate, forest coverage rate, water supply popularizing rate, decontamination rate of urban refuse, urban sewage treatment rate, comprehensive utilization rate of industrial solid waste, industrial waste gas discharge, industrial wastewater discharge, and industrial solid waste discharge to construct an ecological environment evaluation index system of smart city, as shown in Table 1.
| System layer | Index layer | Unit | Index code |
|---|---|---|---|
| Environment evaluation index system of smart city | Decontamination rate of urban refuse | % | X1 |
| Forest coverage rate | % | X2 | |
| Greenland coverage rate | % | X1 | |
| Water supply popularizing rate | % | X4 | |
| Urban sewage treatment rate | % | X5 | |
| Industrial waste gas discharge | 100 million cu.m | X6 | |
| Utilization rate of industrial solid waste | % | X7 | |
| Industrial wastewater discharge | 100 million tons | X8 | |
| Industrial solid waste discharge | 10000 tons | X9 |
2.2. Selection of Evaluation Methods and Data Sources
This study uses the principal component analysis to carry out statistical analysis. Under the condition of minimum loss of information, multiple indexes are transformed into fewer comprehensive evaluation indexes (i.e., principal components), in which each principal component is a linear combination of the original index variables, and the correlation between the principal components is unknown [13, 14]. Based on this, this study selects Guangzhou City in the Pearl River Delta region as the research object and uses the principal component analysis method to evaluate the environmental index system.
2.2.1. Selection of Dimensionless Method
Among them, Pij is the data result after standardization processing; Qij is the original data of the calendar year in the jth index research period, and is the average data in the jth index research period; and Sj is the standard deviation of the jth index.
2.2.2. Construction of Principal Component Factor Score Function
Among them, Km is the score function of principal component factor; P1, P2 ⋯ Pn are the standardized evaluation indexes of ecological environment; and Am1, Am2 ⋯ Amn are the factor coefficients of the mth principal component.
2.2.3. Determination of Comprehensive Evaluation Index
Among them, Ki is the comprehensive evaluation index of the ith ecological environment evaluation index in smart city, Fm is the variance contribution rate of the mth principal component, and Kim is the score function of the mth principal component factor in the ith year.
2.2.4. Data Sources and Analysis
The index data of this study are all from the Guangdong Statistical Yearbook from 2010 to 2018, and the principal component analysis method of SPSS20.0 is used for data processing and analysis.
2.3. Correlation Analysis of Environment Evaluation Indexes
In order to further consider the correlation effect of the principal components of ecological environment in Guangzhou smart city, this study uses the principal components as response variables, and the ecological environment index of smart city as dependent variable to build a response surface model, using Deign Expert 10.0 Software to design Box-Beheken response surface test and analyze the results. The results of variance analysis obtained are shown in the following Table 2. The binary multiple regression equation for the Smart City Ecosystem Index is as follows: R = 78.06 + 7.28A + 6.34B − 2.24C − 1.11AB − 0.61 AC − 2.23 BC − 0.79A2 + 1.05B2 − 0.48C2, F = 8.95, which shows that the response surface model constructed in this study has P < 0.01, indicating that the model has significant differences and can be used for the correlation analysis on influencing factors of ecological environment index of smart cities in Guangzhou.
| Source | Sum of squares | df | Mean square | F value | P value |
|---|---|---|---|---|---|
| Model | 819.66 | 9 | 91.07 | 8.95 | 0.0043 |
| A-environmental excellence rate | 424.28 | 1 | 424.28 | 41.68 | 0.0003 |
| B-environmental remediation capability | 321.31 | 1 | 321.31 | 31.57 | 0.0008 |
| C-environmental pollution pressure | 39.96 | 1 | 39.96 | 3.93 | 0.088 |
| AB | 4.91 | 1 | 4.91 | 0.48 | 0.5099 |
| AC | 1.5 | 1 | 1.5 | 0.15 | 0.7124 |
| BC | 19.85 | 1 | 19.85 | 1.95 | 0.2053 |
| A2 | 2.61 | 1 | 2.61 | 0.26 | 0.628 |
| B2 | 4.66 | 1 | 4.66 | 0.46 | 0.5203 |
| C2 | 0.98 | 1 | 0.98 | 0.096 | 0.7652 |
| Residual | 71.25 | 7 | 10.18 | ||
| Lack of fit | 70.37 | 3 | 23.46 | 107.42 | 0.0003 |
| Pure error | 0.87 | 4 | 0.22 | ||
| Cor total | 890.91 | 16 |
- Note: ∗indicates significant difference, P < 0.05; ∗∗indicates extremely significant.
3. Results and Discussion
3.1. Empirical Analysis on the Principal Components of Ecological Environment Construction in Guangzhou Smart City
3.1.1. Extraction and Structural Analysis of Principal Components
SPSS20.0 is used to conduct factor analysis on the standardized coefficient matrix, and three principal components which can fully reflect the ecological environment of Guangzhou City are selected under the condition of eigenvalue > 1. The cumulative variance rates are 63.53%, 78.33%, and 91.02%, respectively. Further analysis is carried out on the structure of each principal component. Table 3 shows the analysis results of the ecological environment component matrix and principal component scores in Guangzhou. It can be seen that among the components of the first principal component, forest coverage (X2), water supply popularizing rate (X3), and greenland coverage rate in built-up area (X4) account for the largest proportion. Therefore, the first principal component of Guangzhou ecological environment is set as variable K1, representing environmental excellence. Similarly, the second and third principal components of Guangzhou’s ecological environment are set as variables K2 and K3, respectively. Among the elements of K2, the proportion of decontamination rate of urban refuse (X1), urban sewage treatment rate (X5), and comprehensive utilization rate of industrial waste (X7) is the largest, so the proposed variable K2 is the environmental restoration response; among the elements of K3, the proportion of industrial waste gas discharge (X6), industrial wastewater discharge (X8), and industrial solid waste discharge (X9) is the largest, so the proposed variable K3 is environmental pollution pressure. To sum up, the principal components of Guangzhou’s ecological environment are environmental excellence (K1), environmental restoration response (K2), and environmental pollution pressure (K3).
| Index | Component | ||
|---|---|---|---|
| 1 | 2 | 3 | |
| X1 | -0.945 | 0.561 | -0.084 |
| X2 | 0.933 | 0.165 | -0.182 |
| X3 | 0.928 | 0.277 | -0.218 |
| X4 | 0.799 | -0.296 | 0.212 |
| X5 | 0.462 | 0.856 | 0.200 |
| X6 | -0.327 | -0.846 | 0.495 |
| X7 | 0.528 | 0.731 | 0.341 |
| X8 | -0.051 | -0.702 | 0.589 |
| X9 | -0.099 | -0.091 | 0.957 |
3.1.2. Dynamic Measurement of Principal Component and Comprehensive Evaluation Index
According to the results of principal component structure analysis, the comprehensive evaluation index in each principal component of ecological environment in Guangzhou is calculated by using formula (2) and formula (3). The dynamic changes of index parameters of each principal component with the study year are shown in Figures 1–3, respectively. As a first-tier city in China, Guangzhou was selected into the first batch of smart cities in 2014. In the development of smart city construction, the ecological construction of Guangzhou presents a steady rising trend and is superior to the level of smart city construction in five years. In general, the response level of environmental excellence and environmental restoration is relatively high, and the environmental pressure system is relatively poor. In recent years, Guangzhou has always followed the development concept of “low carbon economy, smart city, happy life” as an ecological smart city and vigorously promoted the organic integration of economic construction and ecological construction [17]. Figure 1 shows the dynamic change law of each index parameter under the condition of environmental excellence (K1). It can be seen from Figure 1 that the excellent environment rate, as the first principal component, is the main factor affecting the ecological environment of smart cities in Guangzhou. During 2010-2018, the greenland coverage rate and forest coverage rate of built-up area showed an overall growth trend, in which the greenland coverage rate of built-up area increases from 57.0% to 58.98% and then slightly decreased to 58.59%, with the overall greening rate improving to a certain extent. As a supplementary factor for the environmental excellence, the water supply popularizing rate showed a dynamic and balanced development trend, and the overall water supply rate reached 98%, which was in the forefront of the country.
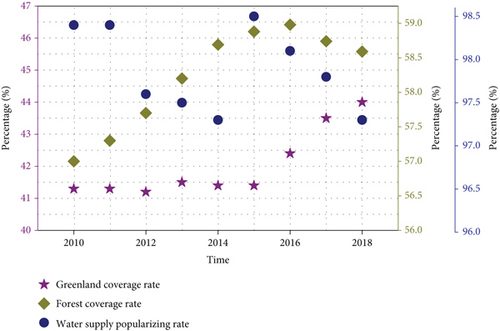
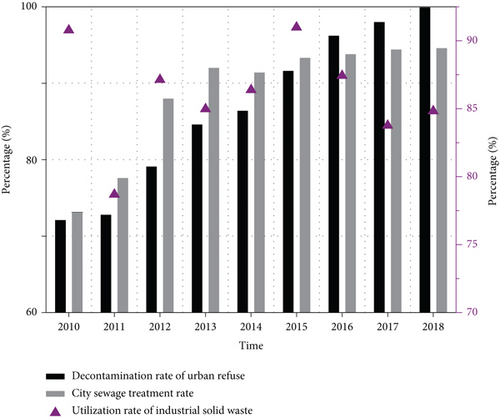
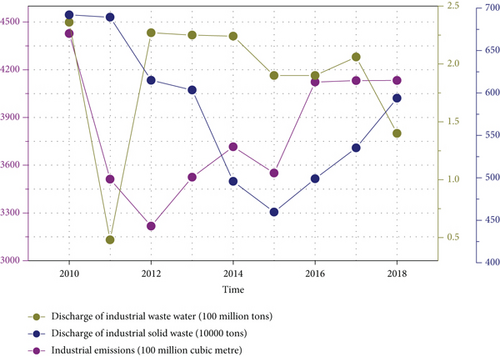
Figure 2 shows the dynamic change law of each index parameter of environmental restoration response (K2). It can be seen from Figure 2 that the urban sewage treatment rate, decontamination rate of urban refuse, and comprehensive utilization rate of industrial solid waste are the three major indexes that feed back the ecological environment restoration response ability of smart city. Generally speaking, the urban sewage treatment rate and decontamination rate of urban refuse in Guangzhou are increasing year by year, from 73.1% to 94.6% and 72.1% to 99.9%, respectively. The improvement of environmental protection technology of wastewater and solid waste effectively promotes the environmental restoration response capacity in Guangzhou. On the other hand, the comprehensive utilization rate of industrial solid waste has always been in a state of dynamic fluctuation, ranging from 83.76% to 90.77%. Since 2014, Guangzhou has attached great importance to the construction of “smart Guangzhou” ecological environment, put forward the development concept of “low-carbon economy, smart city, happy life,” and issued the “1 + 15” policy document system to promote the development of ecological smart city, calling on local universities, such as Sun Yat-sen University and South China Agricultural University, to jointly develop green treatment technology of waste gas, waste liquid, and solid waste, comprehensively improve the restoration and response capabilities of ecological environment [18].
Although the restoration and response capabilities of ecological environment in Guangzhou smart city is improving year by year, it is also facing the environmental pollution pressure caused by the discharge of waste gas, waste liquid, and solid waste. Figure 3 shows the dynamic change law of various index parameter of environmental pollution pressure (K3). It can be seen from Figure 3 that the discharge of waste gas, waste liquid, and solid waste generally shows a trend of first decreasing and then increasing, among which the discharge of industrial wastewater rebounded sharply to 2.27 after reaching the lowest value of 48 million tons in 2011, and then maintained a relatively stable state. The discharge of solid waste first decreased from 6.921 million tons in 2010 to 4.596 million tons in 2015, and then gradually increased to 5.9377 million tons. The discharge of industrial waste gas decreased from 442.737 billion cubic meters in 2010 to 321.75 billion cubic meters in 2012, and then increased to 413.217 billion cubic meters year by year. It can be seen that despite the great pressure, Guangzhou has taken corresponding improvement measures in various aspects to effectively alleviate the pressure of environmental pollution. For example, in terms of air environment improvement, deepen the source analysis of nitrogen oxides and volatile organic compounds by implementing PM2.5 and ozone coordinated control; strengthen the control of mobile source pollution, promote the early elimination of old cars, and increase the prevention and control of pollution such as diesel trucks, ships, and construction machinery. In the aspect of water environment improvement, by strengthening the water environment management of the main stream of the Dongjiang River North, the back channel of the Pearl River, the Baini River, and the front channel of the Pearl River, to ensure the rectification of block and the central environmental protection inspectors and to ensure that the water quality meets the requirements [19].
3.2. Correlation Analysis on Principal Components of Ecological Environment Construction in Guangzhou Smart City
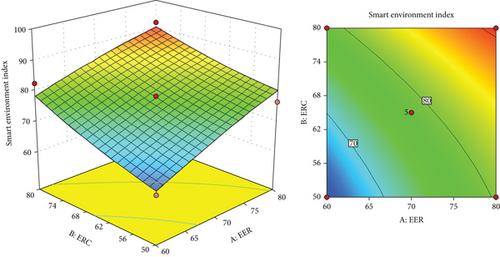
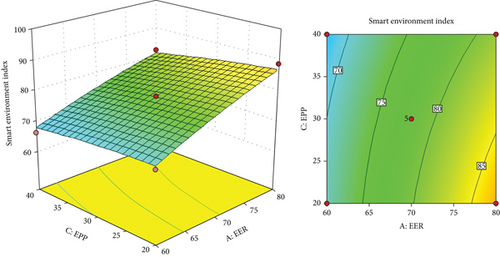
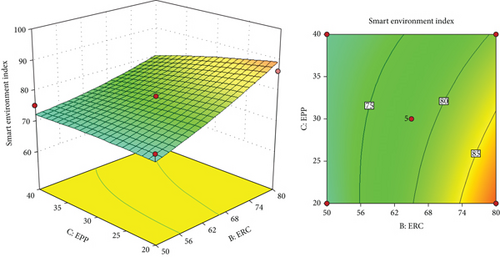
The contour of the response surface model is the projection of the response surface 3D model in the horizontal direction, which reflects the degree of interaction between two interactive factors. The more the contour tends to be elliptical, the more significant the interaction between the two factors is. The more the contour tends to be circular, the less significant the interaction is [20, 21]. Figure 4 shows the correlation between each principal component of ecological environment evaluation system in Guangzhou smart city. By analyzing and comparing the contour map of two principal components, it can be seen that the steepness of contour line of environmental pollution pressure (K3) is more gentle than that of environmental excellence (K1) and environmental restoration response (K2), which indicates that the significance of environmental excellence (K1) and environmental restoration response (K2) is greater than that of environmental pollution pressure (K3). By further comparing the contour map of the environmental excellence (K1) and the environmental restoration response (K2), the steepness of the environmental restoration response (K2) is greater, which indicates that the influence of the environmental restoration response (K2) on the ecological environment index of smart cities is more obvious [22]. On the other hand, by analyzing and comparing the pairwise principal component 3D interaction model, it can be seen that when K1 and K2 interact, the ecological environment index of smart city increases with the improvement of environmental excellence and environmental restoration response; when K1 and K3 interact, the ecological environment index of smart city increases with the increase of environmental excellence (K1), showing a linear growth trend, while gradually decreases with the increase of environmental pollution pressure (K3). The optimization analysis shows that when the state of environmental excellence tends to the maximum (K1 = 80), the environmental restoration effect tends to the maximum (K2 = 80) and the environmental pollution pressure tends to the minimum (K3 = 20), at this time, the ecological environment index of the smart city can reach the maximum value of http://95.43. To sum up, although the pressure of environmental pollution will have a certain degree of negative impact on the ecological environment of smart city, the key to improve the ecological environment construction of smart city is to improve the environmental excellence and the environmental restoration response.
4. Conclusion
- (1)
By integrating the natural ecological environment, environmental governance, environmental carrying capacity, and other comprehensive elements, a data fusion framework for the ecological environment of smart cities driven by multisource is constructed, and an ecological environment evaluation index system of smart city in Guangzhou from 2010 to 2018 is constructed
- (2)
The results of empirical analysis on principal component show that environmental excellence (K1), environmental restoration response (K2), and environmental pollution pressure (K3) are the main components of the ecological environment of smart city in Guangzhou. The environmental excellence and environmental restoration response level are relatively high, and the environmental pressure system is relatively low, among which the greenland coverage rate increases from 41.3% to 44.0%, and the urban sewage treatment rate and the decontamination rate of urban refuse increase year by year, from 73.1% to 94.6% and from 72.1% to 99.9%, respectively
- (3)
The results of principal component correlation and influence analysis on ecological environment construction of smart city in Guangzhou show that there are interactions among environmental excellence (K1), environmental restoration response (K2), and environmental pollution pressure (K3). The ecological environment index of smart cities increases with the improvement of environmental excellence and environmental restoration response, but decreases gradually with the increase of environmental pollution pressure. Generally speaking, improving environmental excellence and environmental restoration response is the key to enhance the ecological environment construction of smart cities
Conflicts of Interest
The authors declare no competing interests.
Open Research
Data Availability
The labeled dataset used to support the findings of this study is available from the corresponding author upon request.


