A Novel Anchorless Node Positioning Method for Wireless Sensor Network
Abstract
Wireless sensor network sensing data is meaningless without any location information, and a large number of anchor node-based localization methods have been proposed to obtain the location information of nodes. However, this kind of method requires a certain number of anchor nodes deployed in the network and complex information interaction between nodes. Therefore, it is not ideal in positioning cost and effect. A WSN positioning method based on the steering antenna of the base station is proposed to address this problem. By rotating the orientation information of the antenna, accurate positioning can be achieved without the assistance of anchor nodes, and no signal interaction between nodes is required. Theoretically, the method is easier to be deployed in the actual scene to realize the positioning of sensor nodes. Experimental results show that the proposed method is better than most positioning methods assisted by anchor node in positioning accuracy, positioning time, and energy consumption.
1. Introduction
Wireless sensor networks (WSNs) are widely adopted in data perception and collection, but it is meaningless to perceive data without knowing its location information. For example, if a WSN is used to monitor a forest for fires, it is still meaningless to not know the location of the fire, even though the fire can be determined based on the sensory data of a node. The positioning of nodes with GPS modules on each sensor node is impractical for large-scale wireless sensor networks, so it is important to study accurate and low-energy WSN positioning methods.
Research on wireless sensor network positioning is mainly divided into several categories: (1) range-based positioning; (2) range-free positioning; (3) anchor-based positioning; (4) anchor-free positioning, etc. Among them, range-based positioning and anchor-based node positioning are generally combined with each other, such as using the Received Signal Strength Indication (RSSI) attenuation of node interaction, signal Time of Arrival (TOA), signal Time Difference of Arrival (TDOA), and signal Angle of Arrival (AOA) model to calculate the distance between nodes and other information, and combining multiple anchor nodes can locate the positioning of unknown nodes. For example, Yan et al. studied the WSN positioning algorithm based on fuzzy decision-making, which is divided into several stages: knowledge accumulation, knowledge fusion, and knowledge expansion. In the knowledge accumulation stage, the RSS of the anchor node is obtained and processed as a position relation index; the knowledge fusion stage optimizes the membership degree of anchor nodes in different environments; in the knowledge expansion stage, the points with the highest matching degree are used to estimate the position of unknown nodes [1]. Furthermore, Yu et al. proposed a WSN node algorithm based on social spider optimization and opposition-based learning. Firstly, the Bounding-box method was used to know the possible region of unknown nodes, and then, the opposition-based learning strategy is combined with the social spider optimization algorithm in the area to estimate the node locations. According to the simulation results, the positioning accuracy is higher than the traditional method [2]. Li et al. proposed a positioning method based on anchor nodes, using positioning priority to improve accuracy. This method reduces positioning errors by introducing a new concept that explores node positioning priorities.. Finally, the experiment compares and evaluates Simulated Annealing Location(SAL), Genetic Algorithm Locations (GAL), and the proposed method, showing that the priority-based positioning method has better positioning accuracy [3]. Xiong et al. proposed a hybrid positioning algorithm of RSS and TOA, which solved the multitarget positioning problem of wireless sensor networks in three-dimensional space and optimized the positioning results by using the least-squares method. The experiment comparing RSS ranging or TOA ranging alone has demonstrated that RSS combined with TOA has a higher accuracy rate [4].
Range-free positioning and anchorless node positioning are generally combined with each other. For example, Zhu et al. implemented a WSN indoor positioning method based on fingerprint matching. First, using the strength of the wireless signal to construct a basic fingerprint map, then constructing a high-resolution positioning fingerprint map with the Kriging interpolation algorithm, and finally optimizing the fingerprint matching result with K-means clustering algorithm to get the target position [5]. Messous et al. improved the DV-HOP positioning algorithm to investigate range-free localization algorithms in similar multihop wireless sensor networks, which optimizes the average hop length between nodes based on the recursive position of the positioning node, thereby reducing the positioning error [6]. Lee proposed a fingerprint database construction method for indoor fingerprint positioning, which can effectively solve the problem of large deviations in the fingerprint data collected due to the positioning environment during the construction of the fingerprint database. The method can improve positioning accuracy by studying the optimal number of clusters and combining the K-means method to obtain a more accurate radio fingerprint construction method [7]. To address the problem of outdoor parking difficulties, Postigo-Málaga et al. investigated a parking space location method based on RSS fingerprints of parking spaces. By collecting the signal strength of parking spaces during idle and busy hours, a fingerprint database was constructed, and then, the parking spaces were located by fingerprint matching [8].
The above analysis of range-based and range-free positioning methods reveals that they all require a certain number of anchor or beacon nodes to locate unknown nodes. Anchor nodes or beacon nodes require a large and complex workload and are subject to greater external interference, resulting in less than optimal positioning accuracy and deployment costs [9–11].
To address the above problem, this paper proposes a node positioning method based on the base station steering antenna, which can achieve high accuracy positioning without the need for an anchor node.
2. Related Assumptions and Positioning Model
2.1. Related Assumptions
- (1)
All nodes in the sensor network are deployed on the XY two-dimensional plane and cannot obtain their own position
- (2)
The signal energy emitted by the rotatable antenna mounted on the base station is mainly concentrated within its beam width, while the signal energy outside the beam width is weak and can be considered zero
- (3)
The base station adopts an active power supply and has strong calculation performance, supporting communication with ordinary nodes and complex calculations, and can achieve the purpose of adjusting the maximum communication distance by varying its transmission power Pt
- (4)
The location of the base station can be obtained by GPS technology
2.2. Positioning Model
- (1)
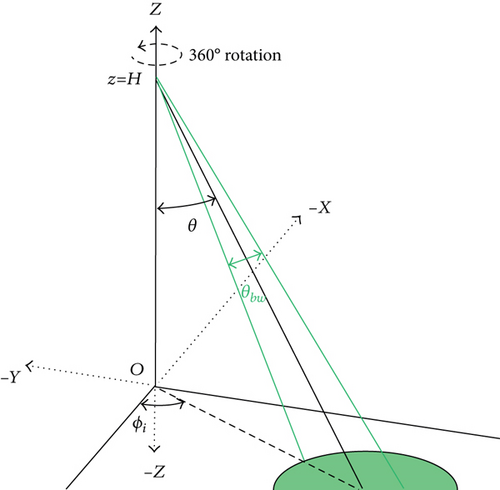
The rotating antenna is a parabolic reflector-type directional antenna with a small beam width (θbw)
- (2)
DA locates at height H above BS
- (3)
DA can rotate around the z-axis, and the included angle with the x-axis is φ(0 ≤ φ ≤ 2π)
- (4)
DA rotates around the z-axis, the smallest unit of each rotation is δϕ(δϕ≤θbw/2)
- (5)
The elevation angle θ of DA is adjustable (0 ≤ θ ≤ θmax), and θmax can be used to calculate the position of the node farthest from BS
- (6)
The minimum adjustment unit of DA elevation angle θ is δθ(δθ≤θbw/2);
- (7)
By changing the φ and θ angles of the antenna, the base station signal can scan all nodes in the positioning area
- (8)
Each time DA changes its position (δθ or δϕ), the beacon frame data is updated and the updated data frame is sent to ordinary nodes. The beacon frame includes antenna height H, elevation angle θ, horizontal rotation angle φ, and the position of the base station
3. Anchorless Positioning Algorithm
This section introduces the proposed method for positioning wireless sensor networks without using anchor nodes, followed by a theoretical analysis of the performance associated with this positioning method.
3.1. Positioning Algorithm
3.1.1. Principle of Positioning
The positioning method proposed in this paper does not require frequent communication between anchor nodes and unknown nodes but achieves positioning through the beacon data interaction between the rotating antenna of the base station and the ordinary node.
The beacon frame format is shown in Figure 2, including the horizontal rotation angle φ, elevation angle θ of the rotating antenna, the height H of the antenna, and the location LBS of the base station (obtained by GPS). When the antenna orientation is adjusted once, φ and θ are updated again, while the values of antenna height H and base station location LBS are fixed.

The beam signal sent by the rotating antenna at angles φ and θ will get an elliptical signal coverage area in the XOY plane. If an ordinary node exists in this area at this time, the ordinary node can receive the beacon signal from the antenna, which contains the rotation angle φ, the elevation angle θ, and the height H of the rotating antenna. Ordinary nodes can calculate the distance ρ from the base station O based on these three parameters, as shown in Equation (1). Then, the position of the node can be expressed as φ, ρ, according to which the polar coordinate can be converted to the horizontal and vertical coordinates (x, y) of the node, and the conversion method is shown in Equation (2). As shown in Figure 3, it is assumed that the ordinary node is located at exactly point N, and it can calculate its own position based on the beacon frame.
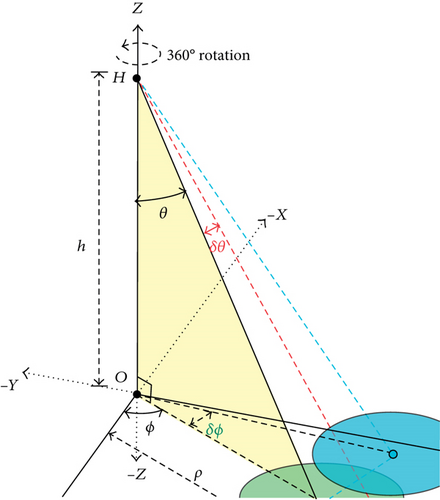
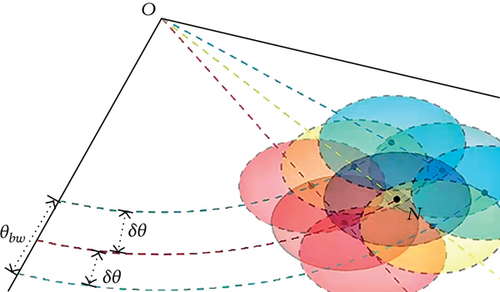
When the rotating antenna rotates along the horizontal direction, each time rotating one unit angle δϕ(i.e., φ = φ ± δϕ), then the signal coverage area will shift accordingly. As shown in Figure 3, the signal coverage area moves from the original position N to the position nj. If there are ordinary nodes in the signal coverage area, the position coordinates of the ordinary nodes can also be obtained by the above method. When the steering antenna adjusts the elevation angle θ(i.e., θ = θ ± δθ), the coverage area of the signal from the steering antenna in the XOY plane will also change, such as moving from the original area with N as the signal coverage center to the coverage area with nk as the center. If the magnitude of each adjustment of the steering antenna angle is relatively small, there is an overlap area in the signal coverage area between adjacent antenna angles, And the ordinary node in the overlapping area can receive a beacon signal at least once, and the number of times a node receives a beacon frame depends on the adjustment units δθ and δϕ of the antenna angle. If a node receives n beacon frames, then the average antenna rotation angle and average elevation angle contained in these n beacon frames are calculated as shown in Equations (3) and (4). The average antenna rotation angle and the average elevation angle can be used to calculate the location of the ordinary node more accurately.
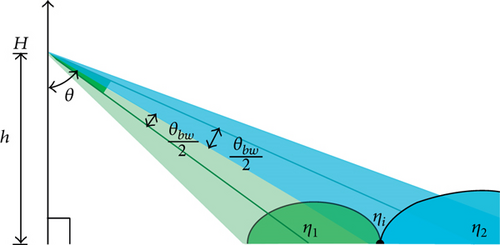
In Equations (5) and (6), H represents the antenna height, and θbw represents the signal beam width, both of which are known values.
-
Algorithm 1: BS positioning process.
-
The steps of BS positioning
-
Input: signal beam width (θbw ), Antenna height ( H ), the smallest unit of antenna azimuth adjustment (δθ or δϕ);
-
Output: Updated beacon frame: beacon;
-
Steps:
-
1: Initialize angle θ and ϕ, θ = θbw/2, ϕ = 0∘;
-
2: According to the current antenna’s azimuth information (beacon = {φ,θ,H,LBS}), construct a beacon frame and send it;
-
3: while(θ + θbw/2≤θmax)
-
4: if(φ<2π)
-
5: Horizontal rotating antenna: φ=φ+δϕ;
-
6: elseifφ==2π
-
7: φ←0;
-
8: θ=θ +δθ;
-
9: endif
-
10: Update the antenna’s orientation information and construct new beacon frames: Beacon = {φ’,θ’,H,LBS};
-
11: Send beacon frames through the antenna;
-
Algorithm 2: Ordinary node positioning process.
-
The steps of ordinary node positioning
-
Input: Received beacon frames: beacon = {φ,θ,H,LBS};
-
Output: Node coordinates:(x,y);
-
Steps:
-
1: while(1)
-
2: Node in listening state;
-
3: recv ← Received data frames;
-
4: if(recv is the end frame)
-
5: break;
-
6: else //Indicates beacon frames
-
7: if(recv≥1)
-
8: if(recv>1)
-
9: ,
-
10: endif
-
11: ρ = H · tan(θ)
-
12: Node polar coordinates: (ρ,φ)
-
13: (x,y)←(ρ,φ)
-
14: endif
-
15: endif
-
16: endwhile
3.1.2. Coordinate Conversion
Part (1) of Section 3.1 details the positioning method proposed in this paper, and based on this method, the coordinates (x, y) of ordinary nodes can be located, which is a coordinate system established with the base station as the origin and represents only the coordinates relative to the BS. Since the position of the BS can be obtained by GPS, the coordinates (x, y) of the ordinary node can also be converted to GPS coordinates based on the BS coordinates (,). The conversion steps are as follows:
3.2. Positioning Performance
3.2.1. Analysis of Positioning Error
3.2.2. Analysis of Positioning Time
In Equation (11), Nφ = 2π/δφ, Nθ = θmax.
3.2.3. Analysis of the Number of Beacon Frames Received
4. Experiment Analysis
4.1. Analysis of Positioning Error
The performance of the algorithm proposed in this paper is verified through experimental analysis. The experiment uses MATLAB for simulation and randomly deploys 100 sensor nodes in a positioning area of 100 m × 100 m, and the base station is located in the center of the positioning area. Under this condition, the maximum positioning distance of the system is ρmax = 70.71 m (the distance from the base station to a vertex of the positioning area). In the experiment, the value of the signal beamwidth angle θbw and the steering antenna height H are dynamically adjusted. The specific parameters of the simulation experiment are shown in Table 1.
| Symbol | Value |
|---|---|
|
|
We analyze their influence on the positioning accuracy of the node by adjusting the height of the antenna and the beam width of the signal during the simulation. In the experiment, the experimental results obtained by varying the beam width (10°, 40°, and 70°) when the antenna height is all 20 m and analyzing the effect of beam width on positioning accuracy are shown in Figure 6(a). Then, change the antenna height when the beam width is all 30°, and analyze the effect on the positioning accuracy, the experimental results are shown in Figure 6(b). Both horizontal coordinates indicate the distance of the node from the base station and the vertical coordinates indicate the positioning error.
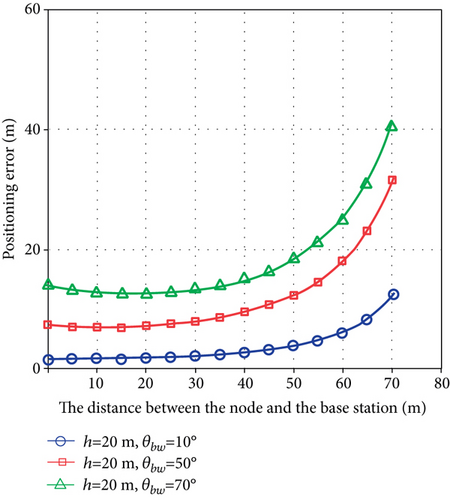
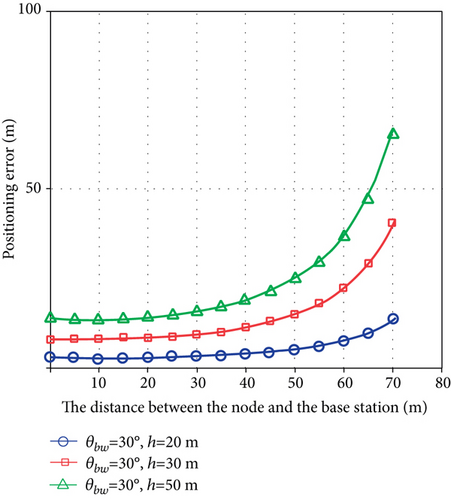
The experimental results in Figure 6(a) show that when the beam widths are 10°, 40°, and 70°, respectively, the localization error first increases gently as the distance between the node and the base station increases, and then increases faster when the distance from the base station is greater than 40 m. When the distance between the node and the base station is the same, the larger the beamwidth, the worse the positioning accuracy. Because the larger the beamwidth, the larger the area covered by the signal, and therefore, the positioning accuracy will be reduced. The experimental results in Figure 6(b) show that when the beamwidth is the same, the higher the antenna height, the worse the corresponding positioning accuracy. Similarly, when the antenna height is higher, the signal coverage in the XOY plane is larger, resulting in worse positioning accuracy.
The maximum locatable distance ρmax of the proposed positioning method is affected by the antenna height and beam width θbw (as in Equation (5)), which affects the maximum positioning range of the system when the antenna height or beam width is adjusted. The experimental results are shown in Figure 7, where the horizontal coordinates indicate the antenna height and the vertical coordinates indicate the maximum locatable range ρmax.
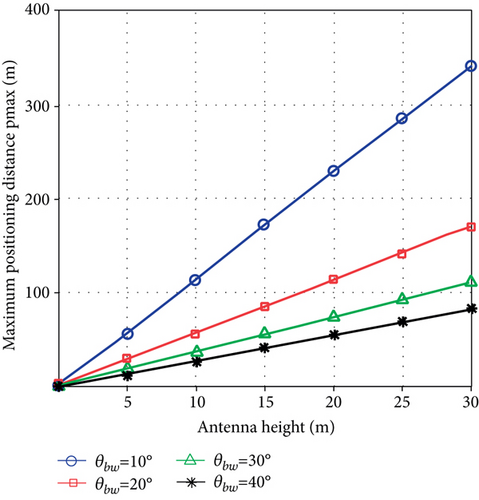
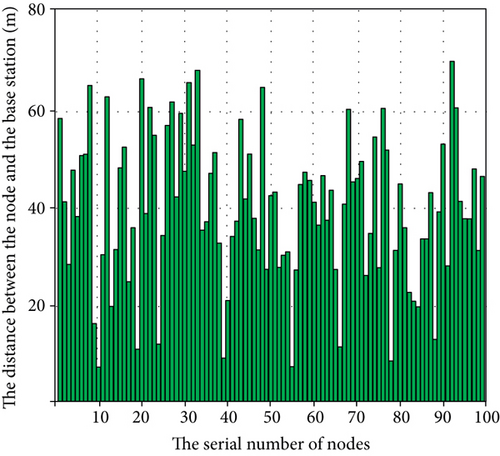
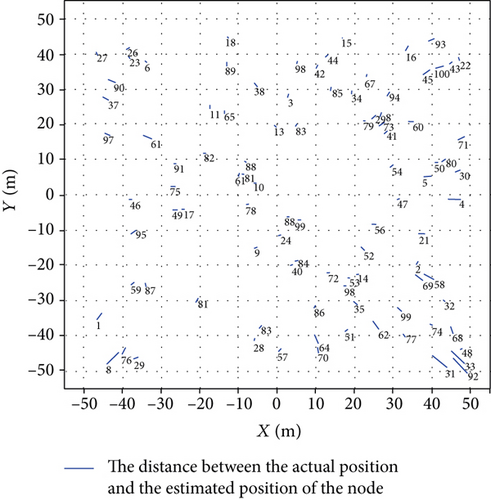
The experimental results are shown in Figure 7, which indicate that the maximum positioning distance ρmax grows in a linear pattern with the increase of the antenna height. Equation (5) for calculating ρmax shows that ρmax is linearly related to H. So when the antenna height is the same, the larger the beam width θbw is, the smaller the maximum positioning distance ρmax is. The distance of each node in the positioning area from the base station and the positioning error of each node are shown in Figures 8(a) and 8(b), respectively. The final positioning result of the node is shown in Figure 9. From the positioning results, it can be seen that the positioning error is relatively large for the node located in the lower left corner of the positioning area, while the positioning error located in the central area is the smallest, because the signal coverage at the positioning center area is strongest, and its positioning error is also the smallest.

The total time consumed by the proposed method to locate nodes in this paper includes the antenna azimuth adjustment time, the beacon frame construction and transmission time, and the node reception of beacon frames and localization calculation time. Therefore, the positioning time also reflects the distance between the node and the base station. This experiment analyzes the relationship between the positioning time and the positioning error of different nodes. The experimental results are shown in Figure 10.
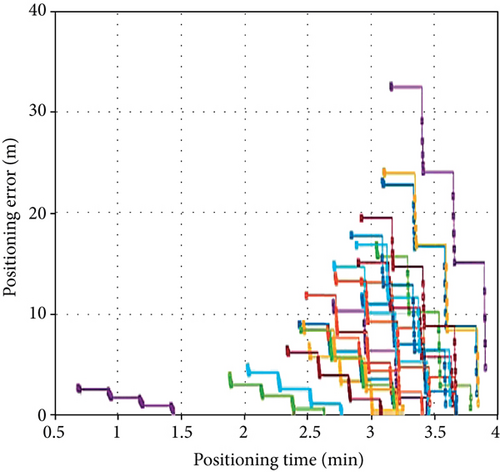
The experimental results show that as the positioning time increases, the maximum positioning error of the node also increases, which indicates that the positioning error of the node far from the base station is greater. Also for a single node, the positioning error decreases as the localization time increases because the number of beacon frames received by the node increases with time, which optimizes the positioning results based on the mean value of the parameters of multiple beacon frames [12–15].
4.2. Positioning Comparison Experiment
The localization area of this experiment is a rectangle of 50 m × 50 m, and the signal strength-based localization optimization algorithm proposed in reference [16] is compared in the experiment, which uses a Kalman filter to filter the data collected from the optimal communication range and can easily solve the problem of perturbation of RSSI values. The variable relationship between communication distance and RSSI can be analyzed for more accurate optimization of node positioning. In reference [16], 20 anchor nodes and 100 ordinary nodes were deployed in the localization area, with 20 anchor nodes enabling the positioning of 100 nodes and all sensor nodes having a communication radius of 15 m. In contrast, the method proposed in this paper does not deploy anchor nodes, but only 100 ordinary nodes, and the height of the antenna is 10 m, the angle step unit δθ and δϕ both are 4°, and the beam width θbw is 10°.
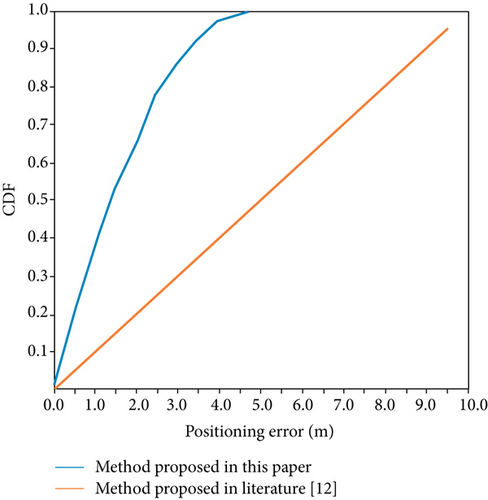
In Figure 11, the localization errors of 100 sensor nodes in the localization area are compared under the two methods. From the results, it can be seen that the maximum localization error of the localization method proposed in literature [16] is much higher than that of the localization method proposed in this paper, and the maximum localization error of the method proposed in this paper is less than 3 m, while the maximum error of the localization algorithm proposed in [16] is higher than 8 m.

The above experiments were verified 100 times and the results of the cumulative distribution of positioning errors were obtained as shown in Figure 12. The experimental results show that the positioning error of the positioning method proposed in this paper is basically in the range of 0-5 m in the positioning area of 50 m × 50 m, while the positioning error of the positioning method proposed in literature [16] is basically distributed in the range of 0-10 m. CDF denotes Cumulative Distribution Function.
Since the residual energy of sensor nodes is fixed and the residual energy of nodes decreases with the operation, if the energy consumption of the localization algorithm is too high, it is very detrimental to the long-term survival of the sensor network. Therefore, the energy consumption of the localization algorithm is one of the key metrics to measure its performance. This experiment is based on an experimental analysis of the common used energy consumption model (as presented in literature [17, 18]). The model parameters during the experiments are shown in Table 2. The total energy consumption of 100 nodes was compared in the experiment, and the results are shown in Figure 13.
| Parameter | Value |
|---|---|
|
|
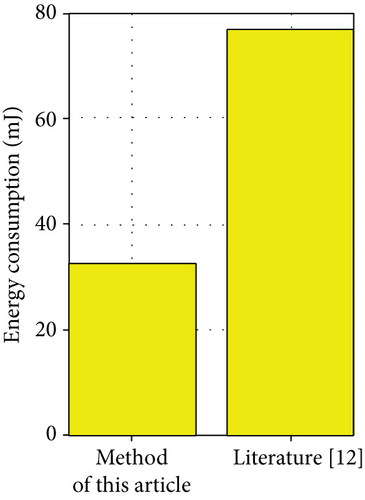
To complete the localization of 100 nodes, the total energy consumed by the method proposed in this paper is about 33.6 mJ, and the total energy consumed by the localization method proposed in literature [16] is about 77.3 mJ. Because the localization method proposed in this paper does not require complex communication with anchor or neighboring nodes and only receives beacon data frames from the base station and is therefore less energy-intensive. In contrast, the localization method proposed in literature [16] requires communication with at least three surrounding anchor nodes and therefore consumes more energy than the method proposed in this paper. The actual experimental setup is deployed as shown in Figure 14. It is an outdoor Wifi Base Station with antenna.

5. Conclusion
As current wireless sensor network localization methods rely on anchor nodes or require complex data interaction to achieve localization, this paper proposes a localization method that does not require anchor nodes. The method uses base station steering antennas and interacts with the nodes to achieve node localization, and the experimental results show that the proposed method achieves good positioning accuracy and is of low energy consumption. In the future, we would further investigate the node localization method when the rotation angle of the steering antenna changes irregularly.
Conflicts of Interest
The authors declare that they have no conflicts of interest.
Acknowledgments
This research was supported by the Basic Public Welfare Research Program of Zhejiang Province under the grant no. LGF21F020015 and Key Specific Projects Cyberspace Security of National Key Research and Development Program under the grant no. 2018YFB0804302.
Open Research
Data Availability
The data used in the study is available by sending an email to [email protected].


