Sustainable Land Use Dynamic Planning Based on GIS and Symmetric Algorithm
Abstract
The general land use planning is to arrange all kinds of land use behaviors in an orderly manner, and its own disorder will inevitably affect the scientific and authoritative nature of the general land use planning, which makes the effect of land management unsatisfactory. The reason is that there are differences in the spatial scale of general land use planning, which makes the analysis of land information not comprehensive enough. Therefore, this paper puts forward the dynamic planning of sustainable land use based on GIS and symmetry algorithm. The collected land information is preprocessed by ArcGIS, and the land remote sensing images are classified by decision tree combined with ENVI (Visual Image Environment), using local sparse coding to extract land use features, with enhancement and reconstruction of remote sensing images using symmetric algorithm. On this basis, the factors that limit the spatial expansion of land are analyzed, and the land planning is completed by substituting them into Arc Map software. Experiments show that the average accuracy rate of this method for land planning reaches 91.22%, which can effectively complete land planning.
1. Introduction
As the main place for human inhabitation and life, land also provides a rich material foundation and reproduction resources for human beings. After natural and man-made influences, the covering formed on the Earth’s surface is often called land cover [1, 2]. Containing parts of soil, glaciers, surface vegetation, lakes, roads, and swamps and wetlands, specific time and space characteristics are factors changing the form and state of land cover at multiple temporal and spatial scales [3, 4]. At present, the progress of industrialization and urbanization has not only closely linked human production, life, and land coverage, but also made ecological and environmental issues increasingly prominent in the wave of continuous expansion of construction land. As the ecological protection area is shrinking sharply, it has attracted the attention of related scholars and relevant departments, and it has gradually evolved into a hot research topic.
The dynamic planning scheme refers to the inaccurate data prediction due to the uncertain factors in the process of socioeconomic development. For example, the same uncertainties in economy, resources, and environment as other countries and regions in the world, the long-term disagreement in theory, the environmental situation of land planning implementation, the implementation tools, methods, and procedures, and the destruction of resources and ecological environment are caused by excessive consumption of resources caused by rapid economic development. In order to circumvent these risk factors, a planning plan made within a certain period of time according to different development situations is composed of a set of implementation plans [5, 6]. There are multiple implementation plans for the dynamic planning plan, but there is only one target year. Whether to switch between the implementation plans is judged through the evaluation indicators, so as to increase the credibility of the adjustment of land use indicators and the accuracy of planning forecasts. Starting in the early 1970s, the radical political economy school represented by David Harvey inherited the basic concepts of modern land use master planning, and they put more emphasis on the evaluation of value judgment levels. They believe that it is necessary to first understand the value of planning and then to understand the social and fairness of planning and then evaluate its effects, so that the cart will not be turned upside down. Same scholar [7] believes that the later evaluation of planning impacts should also be included in the planning plan, that is, after the implementation of the plan, its impact and consequences will be further evaluated, and necessary changes to the plan will be made according to the actual social conditions. Some scholars proposed to combine the spatial explicit model of ecosystem process with the agricultural commodity production model to analyze the biophysical and economic consequences of alternative land use and land management models, so as to achieve the maximum daily total load target of the prototype agricultural watershed; other scholars [8] proposed to use the data in two digital soil maps to create a land capacity classification (LCC) system map and developed a 250m LCC value grid map of the whole region. If the AWC constraint is removed from the LCC algorithm (i.e., simulating the use of full irrigation or higher and more evenly distributed rainfall), the main constraint will become less severe and more spatially variable [9]
Since the reform and opening up, with the rapid development of China’s economy and society, the contradiction of all kinds of land use has become more and more prominent. Three waves of enclosure since 1980s indicate that China’s land management has not been able to keep up with the pace of economic and social development. As the leader of land management, the overall land use planning failed to give full play to its due role. The main reason is that there are external policy and environmental factors. More importantly, China’s overall land use planning has a late starting point, a short history, and immature development. Specifically, the five-level system of China’s overall land use planning can no longer meet the requirements of regional integration and urban-rural integration development, and the division of labor between the upper and lower levels of planning is unclear, resulting in conflicts and disjointments. The general land use planning is to arrange all kinds of land use behaviors in an orderly manner, and its own disorder will inevitably affect the scientific and authoritative nature of the general land use planning, which makes the effect of land management unsatisfactory. Therefore, in order to enhance the effectiveness of land management by general land use planning, it is necessary to build a general land use planning system that is suitable for the development requirements of the new situation in China and coordinate the compilation and implementation management of all levels of planning. In order to make land planning sustainable and facilitate overall planning and coordination, this paper proposes sustainable land use dynamic planning based on GIS and symmetric algorithms.
2. Extraction of Land Use Characteristics Based on GIS Technology
Geographic Information System (Geographic Information System, GIS for short) is an innovative technology that integrates geography, computer, remote sensing technology, and maps. With the powerful performance of information collection and sorting, this technology is widely used in many fields [10]. By storing the map information in the computer, drawing the corresponding electronic map, it is convenient to use the computer to quickly find the target [9, 11].
Use ArcGIS to preprocess the read information data, extract sample data including gray value, PCI, NDVI, DEM, geology, landform, and soil information of each band, and analyze it with SPSS19.0 and establish a decision tree to obtain the classification rules, import the classification rules to ENVI, and complete the remote sensing image classification [12]; the land use classification extraction process is described in Figure 1.
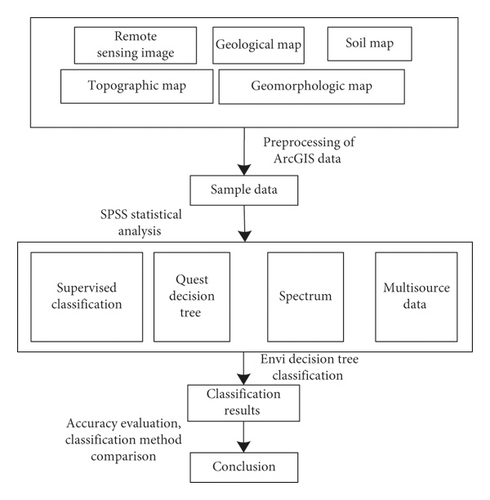
The QUEST decision tree algorithm is used to complete the extraction of land use classification. QUEST decision tree is a relatively new binary tree growth algorithm, which is called a fast, unbiased, and efficient statistical tree. QUEST has two obvious characteristics in the process of specific splitting nodes, which are the ability to separately consider the choice of splitting variables and the choice of splitting points. This single-variable segmentation has almost no bias in the choice of variables [13].
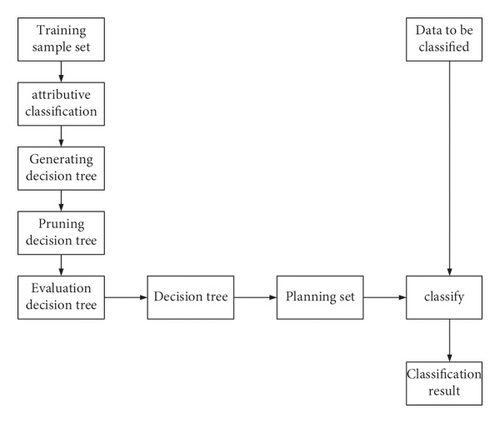
The decision tree classification method based on quest algorithm is a fast, unbiased, and efficient method to improve the differentiation of remote sensing images to different land types in complex terrain by relying on multidimensional remote sensing information composite technology. This method is used to classify complex and changeable landforms, and the accuracy is higher than that of ordinary decision tree classification method [14], as is shown in Figure 2.
- (1)
Firstly, select the prediction variables, and analyze the correlation between all the prediction variables X and the target variable y in turn. If x is a discrete variable, use the chi square test to calculate the correlation strength between X and y, and calculate the probability p value classified into this class; if x is an ordered or continuous variable, the p value is calculated by analysis of variance.
- (2)
By comparing the P values of all variables with the preset boundary values α/M for comparison, α, the significance level specified for the user is between (0, 1), and M is the total number of predictive variables. If both are less than the bound value, the smallest p value is selected as the branch variable; if both are greater than the boundary value, when x is a continuous or ordered variable, the homogeneity test of Levene variance is used to calculate the p value, and when the p value is less than the boundary value, the smallest p value is selected as the branch variable. If the P values of the homogeneity test of variance are greater than the threshold, the minimum variable of P value in the first step is selected as the branch variable.
- (3)
If the selected branch variable is a discrete classification variable, it needs to be transformed to maximize the difference of y value of target variable with different x value and calculate its maximum discrimination coordinate.
- (4)
If y is a multiclassification, the mean of X is calculated for each y value, and these categories are finally combined into two categories by using cluster analysis method. Therefore, the multicategory is simplified to a two-category discrimination problem.
- (5)
Using the quadratic discriminant analysis method, the location of the segmentation point is finally determined, and the original value of the selected prediction variable x is obtained, so as to construct the classification rules.
3. Remote Sensing Image Enhancement Using Symmetric Algorithm
The remote sensing image is enlarged using local sparse coding technology. Transforming a nonsparse image into a suitable transform domain is the core of sparse coding.
In the above formula, λ is the Lagrangian coefficient. In the l1 space, the optimal solution can be obtained by linear programming with regularized coefficients. The single image block can be handled by (3). However. when processing multiple image blocks, the resulting final image will have blocking effects [15]. To overcome this problem, it is necessary to properly handle the connection between the two x.
4. Sustainable Land Use Dynamic Planning
From the 1950s to the 1960s, people doubted the “growth-development” model under environmental pressures caused by economic growth, urbanization, population, and resources. The core principle of sustainable land use is that the economic development of human society cannot surpass the carrying capacity of resources and the environment, and it summarizes the five principles of sustainable land use: socially acceptable (acceptability); economically viable (feasibility); protecting the potential of natural resources and land resources and preventing the degradation of soil and water quality (protection); reducing the risk level of production (stability); maintaining or improving the production or service functions of the land (productivity) [18, 19].
In the formula, pX represents the urban land spatial expansion index of unit X. The larger the urban land spatial expansion index, the higher the probability of being allocated as urban land by the government [22]. The probability distribution of various types of land development is used as a constraint condition for the next level of intelligence to make spatial land use decisions [23].
4.1. Constraints on the Spatial Impact of Land Use
In the formula, a0 represents a constant; Pi represents the parameter value corresponding to the spatial impact factor i; Di represents the collection of the land use spatial impact factor i.
4.2. Neighborhood Constraints
In the formula, con represents the conditional function and Sij describes the cell state.
4.3. Restrictions
In the formula, Z describes the restriction condition judgment function. When the function value Z = 0, it indicates that the cell ij existing in the land use restricted development zone cannot be developed into urban land. When the function value Z = 1, it indicates that the cell ij in the development and construction area can be developed into urban land.
4.4. Random Constraints
In the formula, R represents the random interference factor; k is the coefficient, which can regulate the intensity of random interference; a is a random number.
In the formula, K represents the rate of change, Ua and Ub are the number of a certain land type at the beginning and end of the study period, and T is the length of the study period.
| Type classification | Unused land level | Extensive use of land | Intensive land level | Land use level of urban settlement |
|---|---|---|---|---|
| Types of land use | Unused land | Forest, grass, and water | Cultivated land | Land used for building |
| Graded index | 1 | 2 | 3 | 4 |
The transfer matrix of land use can reflect the land use conversion in different periods and different types of land. For vector data, you can use Arc Map’s fusion tool to merge the same land use types with each other and then intersect the land use data for two time periods to extract the same location from the land use type map at different time periods. Then use Excel’s pivot table function to make land use transfer matrix; for raster data, you can use Arc Map’s raster calculator function to calculate. In order to solve the constrained multiobjective optimization problem, an algorithm based on decomposition can be adopted; that is, a new replacement strategy is used to update the solution, so as to circularly replace the solution and obtain the optimal solution, which meets all constraints.
5. Experimental Study
5.1. Experimental Program
Design performance test comparison experiment prepares a main control computer and a remote sensing image scanner. Install Arc GIS10.2, ENVl5.2, and FRAGSTATS3.4 and other software in the main control computer as the platform basis for high-resolution remote sensing image processing. Determine the area of the city, imaging time, shooting track, equipment accuracy, and imaging quality. At the same time, considering the climatic characteristics of the urban area, priority is given to the selection of remote sensing images for winter imaging. The climate type in this area is mostly temperate semihumid climate. Influenced by topography, there are obvious vertical differences in climate, abundant precipitation in wet season, and diverse natural landscapes such as forests, wetlands, grasslands, and glaciers. DEM data comes from SRTM data set of geospatial data cloud website (http://www.gscloud.cn/), with a resolution of 90 m, covering the whole city. DEM data are spliced, reprojected, resampled, and cut according to the city boundary. The 1 : 1 million raster map of soil type distribution in this city comes from the Science Data Center of Cold and Dry Areas (http://westdc.westgis.ac.cn); the resolution is 1 km. First, the soil type distribution grid is reprojected, and then it is converted into vector data by ENVI software. Land cover data comes from the website of geospatial data cloud (http://www.gscloud.cn/). Globcover2021_V2.3_GL-Obal data set, with a resolution of 300 m, covers the whole world. The land cover data is resampled and cut according to the urban boundary. The information of altitude, surface roughness, agricultural land, construction land, ecological wetland, and so on in the study area is extracted by ArcGIS. Among them, a total of 238 remote sensing images of land use were selected, including images with pixels of 256 ∗ 256, with spatial resolution ranging from 0.3 to 30 m.
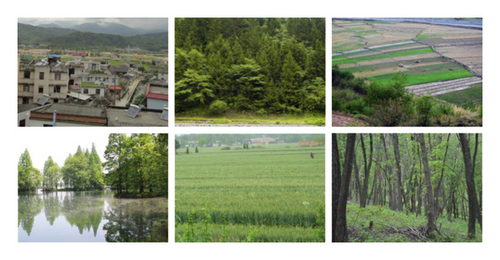
Among them, the field sampling adopts GPS technology to realize data acquisition. The field sampling route and various markers based on GPS technology are shown in Figure 3.
5.2. Results
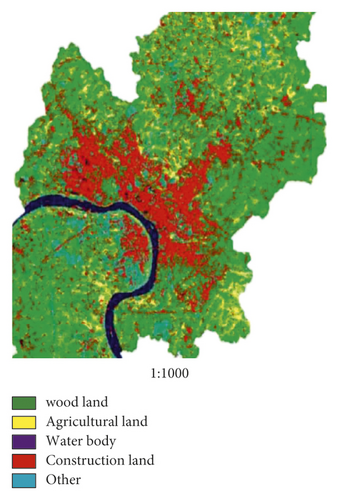
| Land use type | Paddy field | Dry land | Woodland | Shrub land | Settlement place |
|---|---|---|---|---|---|
| Decrease | 9012 | 14812 | 12575 | 8467 | 4526 |
| Increase | 3421 | 5423 | 4712 | 15747 | 24550 |
| Dynamic graph (‰) | −0.24 | −0.28 | −0.57 | 0.47 | 25.7 |
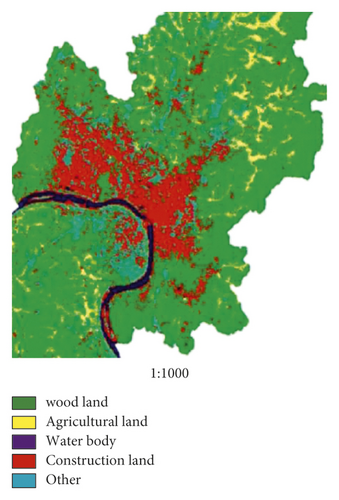
The change of agricultural land was small, and after a slight increase, there was a slight fall; due to the positive response to the related policy of closing hills for afforestation, the coverage of forest land increased greatly; the water body hardly changed. Although there are small ponds and river ditches occupied, due to ecological needs, many reservoirs and ponds have also been built, and ecological wetlands have also been protected on a large scale; the increase in construction land is obviously due to the rapid increase in population and the promotion of urbanization; the sudden decline of other land is due to the growing concept of ecological protection and the cautious attitude of land development.
In the formula, UAi represents the user accuracy of category i, pii represents the number of pixels belonging to category i of the classified image and the actual type, which is the diagonal of the matrix, and pi+ denotes the total number of pixels of category i. i is the sum of rows; n is the number of classification categories.
Table 3 describes the land use classification accuracy of this method and the traditional method.
Through the analysis of Table 3, it can be seen that the average accuracy of land division by this method reaches 91.22%, while the average accuracy of traditional methods is 83.17%, which shows that the method proposed in this paper can effectively complete land division and has good division accuracy. By analyzing the overall division data of this method, we can know that this method significantly reduces the misclassification and omission of water areas and reduces the possibility of water leakage for residents’ lives. The result of residential land division by this method is ideal, which greatly reduces the probability that construction land is wrongly divided into water bodies. Moreover, the method in this paper is better in dividing forest land, and its mapping accuracy and user accuracy rate are over 90%. Because the hue of forest land is different from other cover types in remote sensing images, it is easy to identify. The division of grassland and cultivated land is one of the main difficulties in remote sensing image classification. The reason affecting the division of the two is the fragmentation of land cover type distribution in the test area. Because the grassland area is reduced and scattered, the cultivated land area is large.
| Method | Land category | Arable land | Woodland | Grass | Waters | Residential use | Unused | Sum | User accuracy/% |
|---|---|---|---|---|---|---|---|---|---|
| Traditional methods | Arable land | 37 | 1 | 1 | 0 | 0 | 3 | 42 | 88.43 |
| Woodland | 2 | 46 | 4 | 0 | 0 | 0 | 52 | 90.36 | |
| Grass | 32 | 2 | 51 | 1 | 0 | 1 | 87 | 63.87 | |
| Waters | 0 | 0 | 0 | 30 | 0 | 0 | 30 | 100 | |
| Residential use | 0 | 0 | 0 | 25 | 58 | 0 | 80 | 68.77 | |
| Unused | 2 | 1 | 2 | 0 | 0 | 46 | 54 | 88.11 | |
| sum | 73 | 50 | 58 | 56 | 58 | 50 | 345 | ||
| User accuracy (%) | 86.1 | 80.1 | 67.2 | 80.4 | 100 | 85.23 | |||
| The method of this paper | Arable land | 65 | 3 | 23 | 0 | 0 | 3 | 94 | 98.54 |
| Woodland | 1 | 52 | 0 | 0 | 0 | 0 | 53 | 97.82 | |
| Grass | 2 | 1 | 51 | 0 | 0 | 1 | 55 | 92.21 | |
| Waters | 0 | 0 | 0 | 30 | 0 | 0 | 30 | 100 | |
| Residential use | 0 | 0 | 0 | 2 | 58 | 2 | 62 | 96.65 | |
| Unused | 2 | 1 | 2 | 0 | 0 | 46 | 51 | 96.11 | |
| Sum | 70 | 57 | 76 | 32 | 58 | 52 | 345 | ||
| User accuracy (%) | 95.25 | 90 | 70.4 | 96.43 | 100 | 95.24 | |||
6. Methods
By dividing and calculating the land use planning, we can clearly see the changes of various types of land use, and the accuracy of division has reached a high level. The two research methods mentioned above [8, 9] are all land planning from the aspects of economy, etc., without reference to the actual division of various types of land, so the land planning made in this way is not comprehensive enough.
The overall land use planning includes nine aspects, such as current planning implementation evaluation, land use status analysis, land supply forecast, land demand forecast, land use strategy, determination of planning objectives and tasks, adjustment of land use structure and layout, land use zoning, formulation of implementation planning measures, etc. We can focus on studying land use strategic ideas and formulating land use guidelines and policies. Under the background of regional economic integration and urban-rural integration, it is suggested that the overall land use planning system should still be based on the administrative division system. Actively analyze the disjointed and conflicted problems existing in the compilation and implementation management of China’s overall land use planning, and put forward the working ideas of overall planning and coordination. Adopt the method of synchronously compiling the overall land use planning at three spatial scales of province, county/suburb, and township to ensure the symmetrical exchange and convergence of planning information between the upper and lower levels; optimize the planning and management mode, establish the mechanism of exemption and rejection, implement the simultaneous revision of planning at county and township levels, and limit the spatial scope of planning revision. We will improve and coordinate the legal guarantee system for the preparation and implementation management of the overall land use planning at different spatial scales and form a legal guarantee system at the national, departmental, and local levels, with the land planning law as the core and composed of laws, regulations, departmental rules, and technical specifications.
7. Conclusion
Under the concept of sustainable development, a dynamic land use planning algorithm is designed. ArcGIS is used to preprocess the read information data, establish a decision tree to obtain classification rules, import the classification rules into the environment, complete the classification of remote sensing images, and realize the visualization of dynamic planning of land remote sensing images based on local sparse coding. Experiments show that this method can effectively calculate the dynamic change of land and determine the dynamic change range of different types of land. On this basis, it is verified that this method can accurately divide land, and its accuracy reaches 91.22%, which has good applicability.
However, the system designed in this paper still has shortcomings. Some influencing factors are difficult to consider comprehensively, such as government policies, enterprise land, residents’ life, and other human factors that directly affect land use, as well as some variables that are difficult to quantify and some unpredictable factors, such as natural disasters.
Conflicts of Interest
The authors declare that there are no conflicts of interest.
Acknowledgments
The research is supported by National Natural Science Foundation of China - Estimation on ecological risk of land use at Chakou watershed based on AnnAGNPS (No. 41071345).
Open Research
Data Availability
The datasets used and/or analyzed during the current study are available from the corresponding author on reasonable request.


