Research on Optimization of Intelligent Traffic Dispatching Algorithms Based on Big Data in Chinese Urban Internet of Things Platform
Abstract
The economic development in China has brought about the urban traffic problems such as traffic congestion, long traffic waiting time, and inappropriate vehicle transfer. Therefore, under the technical background of China’s Internet of Things platform, the fusion technology based on big data is studied and an algorithm for Chinese urban intelligent traffic safety scheduling is designed. In this paper, first of all, the urban traffic safety big data is clustered. Secondly, the gray distribution model of the big data is established by extracting the association rule features. Thirdly, the elements in Chinese urban traffic safety big data are fused, including the text, location, picture, audio, and video. On the condition of meeting highly time-sensitive needs of urban traffic intelligence, the video information after data fusion is applied to detect traffic flow parameters, so that an evaluation strategy for urban traffic safety state under the urban traffic speed dispersion is established. According to the fuzzy value of urban traffic drivers’ satisfaction with the waiting time, the effect of traffic dispatching is measured, the convergence formula of urban traffic in the morning and evening peaks is constructed, and the optimal solution of the objective function of dispatching strategy is calculated by the particle swarm optimization algorithm. In this way, more efficient urban traffic safety scheduling in China is realized. As can be learned from the experimental results, the proposed algorithm can reasonably judge the urban traffic safety situation and reduce the time of waiting for urban vehicles with reasonable data fusion results, so it is proved to improve the urban traffic safety.
1. Introduction
The rapid economic and social progress has not only promoted the traffic demand but also made the traffic problem into a hot focus of all walks of life [1]. Due to the severe road congestion problem under this circumstance, urban intelligent transportation has developed into a sign for the future development trend of global road transportation as well as the progress of modern cities. Faced with the pressure of numerous transportation resources, intelligent transportation can further transform road traffic, improve the application efficiency of urban transportation network [2, 3], and thereby alleviate urban traffic problems and reduce the economic loss caused accordingly through communication technology and Internet of Things platform. This is also the core of intelligent traffic. The urban traffic safety scheduling algorithm is the key technology to urban intelligent transportation, so designing the urban intelligent transportation algorithm for different urban areas according to the current situation and development trend of urban transportation is worth detailed study.
Lu [4] and others proposed a flexible coordinated scheduling algorithm for urban multiline traffic during off-peak hours. The algorithm explores the scheduling problem during off-peak hours. The algorithm takes the reduced walking time of passengers, the increased travel time of passengers, operating cost, and other factors as indicators, establishes a two-tier planning model of urban traffic coordination and scheduling, and uses the genetic algorithm to encode the number of passengers on-board when the vehicle responds to the reservation station and then completes the model solution. However, the computational cost of this algorithm is too large, and the real-time performance of the scheduling result is not high. Kong et al. [5] designed an urban traffic dispatching algorithm based on intelligent vision. The basic architecture of the algorithm is composed of ZigBee coordinator module, intelligent vision module, traffic control base station, and so on. The ZigBee coordinator module is used to process vehicle information, which collects road congestion information through the on-board sensor node module in the intelligent vision module and controls the volume of on-board sensor nodes, system energy, and capital consumption. The real-time feedback of traffic image information of congested vehicles is completed by using the road image information acquisition and processing module, and the scheduling algorithm under the hybrid fish school algorithm is used to solve the problem of vehicle congestion. However, the anti-jamming performance of this algorithm in data acquisition needs to be improved.
In view of the above problems, the author of this study designed an urban intelligent traffic safety dispatching algorithm based on big data fusion under the platform of the Internet of Things. The algorithm uses big data fusion to complete the integration of traffic safety information and the evaluation of traffic implementation and then uses the particle swarm optimization algorithm to achieve the goal of efficient traffic safety dispatch and improve urban traffic safety.
2. Information Processing and Evaluation of Urban Intelligent Traffic Safety Based on Big Data Fusion
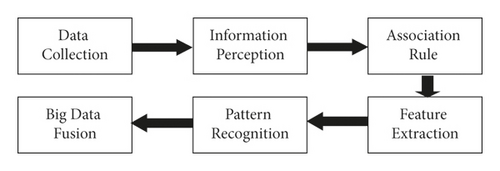
Under the platform of the Internet of Things, in order to complete the goal of traffic safety big data fusion, the first step is to build a distributed structure model of traffic big data. To this end, this research uses G to define a fuzzy distributed storage center for traffic safety big data. If the phase space embedding dimension of the traffic safety big data interaction is represented, several nonlinear joint statistical i methods can be used to realize the reconstruction of the big data high-dimensional feature space [6], and the fusion fuzzy clustering algorithm is used to complete the extraction of big data fusion features. The global architecture model of big data fusion is shown in Figure 1.
In the formula, p represents the order of the distributed big data storage structure and α represents the time window width of statistical data sampling.
In the formula, a represents the variance index between big data domains and BH represents the correlation function of big data fusion.
In the formula, T′ represents the time delay when the big data is in the reconstruction space, and represents the degree of correlation between the changes in traffic safety big data during t and t + T. Integrate the concept of information fusion, implement information fusion for text information, location information, pictures, audio, video, and other data in big data, and improve the independent dispatching ability of big data.
After the big data fusion is completed, the video big data information is used to accurately assess the traffic safety situation in order to adopt a reasonable vehicle scheduling strategy. Set a rectangular detection area to ensure that the two parallel detection lines in the set video image detection area are in a vertical relationship with the road. Treat the vehicle as a moving target for clumping.
In the formula, V80,i represents that 80% of all vehicles traveling on this road segment have the same speed, and only 20% of the vehicle speeds are not lower than the cumulative frequency curve of vehicle speed, and the curve value represents the speed of this road segment; SL represents the standard deviation of 80 vehicle speeds on the highway section, and is the average speed of vehicles passing through the entire road. In formulae (9) and (10), the total number of sections is the exact value that needs to be calculated, and the more the sections are divided, the more accurate the calculation results will be. However, too close cross-sections bring great difficulty to the evaluation [10]. On the basis of facilitating observation and calculation, the number of cross-sections should be increased to the greatest extent, and the distance between the cross-sections should be maintained at about 60 m. This not only facilitates the detection but also ensures the reasonableness of the calculation results.
According to the speed dispersion, the road section is divided into four grades. After carrying out statistical analysis on the historical big data fusion information of multiple sections and the severity level of accidents, the traffic safety assessment criteria as shown in Table 1 are obtained. In Table 1, represents the average value of vehicle speed dispersion under safe highway driving.
| Speed dispersion (%) | Security classification | |||
|---|---|---|---|---|
| Security A | Safer B | Basic safety C | Unsafe D | |
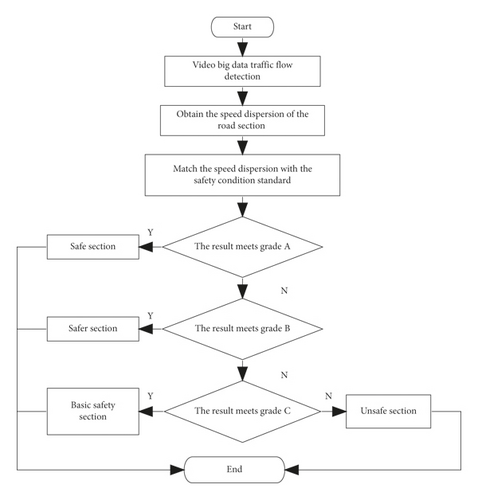
The detailed process of traffic safety assessment is shown in Figure 2. Through the calculation process in Figure 2, the accurate overall situation of traffic vehicles can be obtained, and we can know whether there are hidden safety hazards on the road. If there are emergencies such as congestion or traffic accidents, the urban intelligent traffic safety scheduling algorithm based on particle swarm optimization can be used to properly handle traffic safety issues.
3. Urban Intelligent Traffic Safety Scheduling Algorithm Based on Particle Swarm Optimization
There are many sudden factors in the driving of modern traffic vehicles, and the accumulation of time with congestion makes it difficult to effectively implement the traffic dispatching plan. If in the vehicle scheduling the delay parameter of arrival at the destination follows any parameter variable of the normal distribution, the general derivation model cannot directly calculate the uncertain value. Under the platform of the Internet of Things, the particle swarm optimization algorithm is used to find the optimal solution for the traffic safety scheduling strategy.
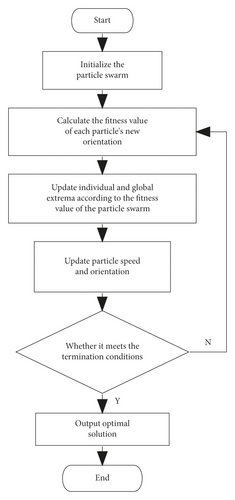
The particle swarm optimization algorithm is a swarm intelligence algorithm created on the basis of exploring the behavior of fish and bird groups. The central idea comes from the theory of artificial life and evolutionary computing. It simulates the flight and foraging behavior of birds and uses the collective cooperation of birds to optimize the group [11]. Figure 3 shows the calculation process of the particle swarm optimization algorithm.
In this study, it is assumed that the vehicles start to travel from the corresponding place on time, and there is no detention phenomenon when the vehicles are driving. The satisfaction fuzzy value of the waiting time of the driver is used to weigh the effectiveness of the traffic safety dispatching when the vehicle is driving.
Formula (19) expresses the update process of the particle itself, and formula (20) expresses the coordination ability of the particle in the scheduling algorithm, which is also the highlight of the particle’s sociality.
The solution space of the particles is the traffic safety dispatching criterion within a certain range, which can be specifically expanded to the number of driving times and the length of travel time of each vehicle. Traffic vehicles have high nonlinear characteristics. The algorithm does not need to implement too many parameter adjustments to complete multiple operations. The continuous update of a certain particle in the optimization iteration will form an operator that maintains a better position. The auxiliary performance of the operator can be used to improve the accuracy and rate of individual constraints.
The particle distribution calculation is to put the unequal traffic safety scheduling strategy particles into different containers in turn and use the equal division [12] method to divide a particle group into multiple subgroups.
The individual optimal particle gbest exchanges synchronization information with the individual optimal particle ppes in a fixed period. In the subgroup, the individual optimal particle ppes can all be received by the global optimal particle g best. The subgroup selects a g best from the best position in the adjacent container to replace its own g best. The replaced cycle time decreases layer by layer according to the exponential decreasing sequence. During the search period, the diversity of the group is very high, and the local search ability of this period is more critical than the whole search ability, and ppes will produce g best values of different processors after a long independent working time, which is a critical period for turning into a global constraint. The particles in multiple containers are updated cooperatively with each other to ensure that the obtained scheduling plan is the optimal solution, thereby achieving accurate and efficient vehicle safety scheduling.
4. Simulation Experiment and Result Analysis
In order to evaluate the performance of the urban intelligent traffic safety dispatching algorithm based on big data fusion under the Internet of Things platform, this algorithm is compared and analyzed with the two algorithms in literatures [4, 5] for traffic safety dispatching simulation. The simulation parameters are shown in Table 2.
| Parameter name | Parameter value |
|---|---|
| Intersection length | 55 m |
| Phase transition time | 3 s |
| Minimum green time | 20 s |
| Longest green time | 90 s |
| Driver’s response time | 1 s |
| Lane waiting time threshold | 350 s |
| Car length | 5 m |
| Bus length | 9 m |
| Car acceleration | 0.9 m/s2 |
| Bus acceleration | 0.5 m/s2 |
| Car deceleration | 4.8 m/s2 |
| Bus deceleration | 3 m/s2 |
| Car top speed | 24 m/s2 |
| Maximum bus speed | 14.57 m/s |
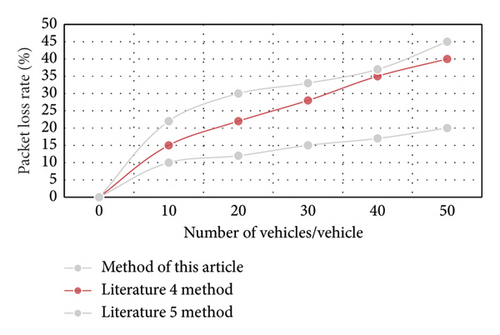
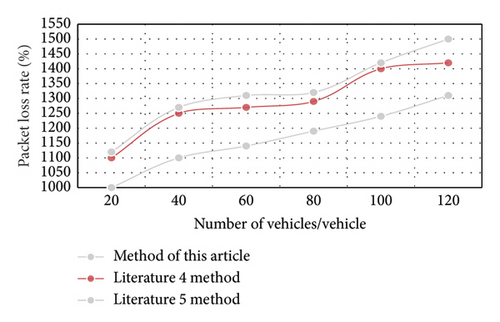
Figure 4 shows the simulation results of the packet loss rate of the vehicle traffic safety video information data fusion under the three algorithms. It can be seen from Figure 4 that with the continuous increase in the number of vehicles in the video, the load of the big data information flow is getting heavier and the packet loss rate is also increasing. However, under the algorithm of this paper, the rising trend of packet loss rate is relatively flat, and the packet loss rate is also lower than the algorithms in literatures [4, 5]. The reason is that the algorithm in this paper can integrate text information, location information, video, and other data in urban intelligent transportation, which greatly enhances the transmission performance of big data information flow, and convey effective traffic safety dispatch information to deal with safety accidents caused by congestion and other phenomena.
It is assumed that each road segment in the simulated road network has 1 left-turning lane, 3 through-going lanes, and 1 right-turning lane in turn. Then, test the variation of vehicle waiting time under different algorithms. Each simulation time is 30 minutes, and the simulation result is the average value of 50 simulations. The result is shown in Figure 5. In Figure 5, the ordinate represents the waiting time of all vehicles, and its unit is second (s). The abscissa is the traffic flow, which represents the number of vehicles arriving in each lane in a minute.
It can be seen from Figure 5 that when the traffic volume is relatively small, the performance difference of the three algorithms is also small. However, as traffic flow increases gradually, the performance of each algorithm changes significantly. From a global perspective, the performance of the algorithm in this paper is much better than that in the above two literatures. This is because the algorithm in this paper uses the particle swarm optimization algorithm to deduce the time for vehicles to pass through the intersection to complete the green light time setting and complete the optimal traffic safety scheduling; that is to say, the time of each dispatch is to make the waiting time of the vehicle as short as possible.
5. Conclusion
With the development of China’s economy and urban road construction, the urban intelligent traffic safety system plays important role in both urban traffic scheduling and traffic safety. In consideration of the increasingly severe traffic safety situation, an urban intelligent traffic safety dispatching algorithm based on big data fusion is proposed in this research by making the most of the Internet of Things platform. With strong adaptive ability and simple calculation process, the proposed algorithm can not only effectively integrate various types of traffic safety big data and improve the utilization of traffic big data resources but also obtain high-precision traffic safety scheduling strategy via the particle swarm optimization algorithm, thus playing decisive role during the fast and safe driving of vehicles.
Conflicts of Interest
The author declares that there are no conflicts of interest.
Acknowledgments
This work was supported by the Scientific and Technological Research Plan of Chongqing Education Commission-Research on Key Technologies of Knowledge Map Construction Based on Text Representation Learning (kjqn2021040008), Research on Knowledge Map in Engineering Consulting Intelligence Platform in Iron and Steel Field (kjqn2021040007), and Research on Improvement of Text Generation Method Based on Generation Confrontation Network (kjqn202004002).
Open Research
Data Availability
The data used to support the findings of this study are available from the corresponding author upon request.


