Functionalized Selenium Nanoparticles Enhance Anticancer Efficacy of Doxorubicin for Hepatocellular Carcinoma Therapy
Abstract
Hepatocellular carcinoma (HCC) is ranked as the second leading cancer-related death in the world. Chemotherapy is one of the most commonly used strategies for HCC patients, while the clinical application is hampered by its cytotoxicity. To address this dilemma, tumor-targeted nanotechnology has been proposed to balance the toxicity and efficacy of chemotherapy. Tumor-targeted selenium nanoparticles (HA-SeNPs) were prepared to load an anticancer drug doxorubicin (DOX). In this drug delivery system, hyaluronic acid (HA) was used as a tumor-targeted moiety to bind with its receptor highly expressed in hepatocellular carcinoma cells. The transmission electron microscopy (TEM) and dynamic light scattering assays showed that HA-Se@DOX was a small and high stable nanocomposite. The cell viability, scratch migration, and invasion chamber assays indicated that HA-Se@DOX showed stronger ability to suppress HepG2 cells growth and migration/invasion compared to Se@DOX or DOX alone. Moreover, HA-Se@DOX could induce HepG2 cells apoptosis probably through the reactive oxygen species (ROS). In summary, the results indicated that HA-Se@DOX exhibits great potential to be a prodrug against hepatocellular carcinoma.
1. Introduction
Hepatocellular carcinoma (HCC) is one of the most common digestive tract malignancies with more than 600,000 new cases occurring every year [1]. Due to metastasis and absence of effective therapies, the HCC patients show a poor prognosis and a low level five-year survival rate (5–6%) [2]. The surgical restriction obviously improves the survival rate at the early stages of HCC [3]. Unfortunately, once diagnosed, most HCC patients were at advanced stage as lack of appropriate screening tests and effective monitoring methods [4]. Chemotherapy is one of the most common therapies for patients with advanced HCC [5, 6]. However, traditional chemotherapy drugs are limited by their low water solubility and short half-lives, which results in a small amount of drug molecules reaching to tumors [7, 8]. Furthermore, drug toxicity and side effects of chemotherapy are severe, as cancer cells and normal cells are killed at the same time [9]. Consequently, it is necessary to explore effective and targeted therapeutic agents for HCC therapy, which improve local drug concentration and reduce serious side effects [10].
Recently, nanomaterials, as new drug delivery systems, have been more widely applied to complete tumor-targeted chemotherapy, due to its attribution of small size, good water solubility, and controllable morphology [11–14]. A variety of drug carriers, such as liposomes, micelle, dendrimer, and polymer, have been developed to improve delivery of therapeutic agents to tumors [15–17]. Selenium (Se, an essential trace element) plays a significant role in human metabolism, antiaging, antioxidative, and antitumor [18]. Se nanoparticles (SeNPs) were of concern as drug carries for their weak toxicity, well degradability, and potent tumor preventive effect [19]. Decorations with targeting ligand on the surface of SeNPs can promote nanoparticle selectively reach to cancer cells and tumor sites [20]. High expression of hyaluronic acid (HA) receptor has been found in hepatocellular carcinoma cell [21]. Moreover, HA is a dietary supplement, which has the feature of nonimmunogenicity, well degradability, and biological compatibility [22]. Hence, HA-modified nanocarrier was designed for targeted delivery of chemotherapeutic agent to hepatocellular carcinoma [23].
Of the chemotherapy drugs, doxorubicin (DOX) is considered as an anthracycline antibiotic and plays an important role in the inhibition of proliferation and induction of apoptosis [24]. DOX has been applied to the treatment of many cancers, including prostate cancer, colorectal cancer, and breast cancer [25]. And also, DOX is one of the most commonly used therapeutic drugs for the treatment of HCC patients [26]. Unfortunately, DOX is metabolized to doxorubicinol in vivo and primarily accumulates in the heart, which leads to cardiotoxicity, such as congestive heart failure and cardiomyopathy [27]. To address this dilemma, in this study, HA-modified SeNPs were chosen to deliver the DOX to the tumor location, and aimed at balancing the toxicity and efficacy of chemotherapy.
2. Materials and Methods
2.1. Materials
Sodium selenite (Na2SeO3), sodium hyaluronate, ascorbic acid (vitamin C), and doxorubicin (DOX) were purchased from Xi’an Sanjiang Biological Engineering Co. Ltd. Propidium iodide (PI) and 4′, 6-diamidino-2-phenyindole (DAPI) were acquired from ChinaPeptides Co. Ltd. Both antibodies and BCA protein assay kit that used for western blot were purchased from CST.
2.2. Preparation and Characterization of Nanoparticles
HA-Se@DOX was fabricated as follows: 2 mL of 50 mM vitamin C solution was gently added into 0.25 mL of Na2SeO3 solution (0.1M). The excess Vc and Na2SeO3 were removed by centrifugation at the speed of 8000 rpm (Thermo Legnd Micro 17R). Then, 2 mL of the above mixed solutions were added with 3.8 mg of DOX and 12 μL of HA (10 μM). The morphology and nanoparticle size distributions of HA-Se@DOX were characterized by transmission electron microscope (TEM) and dynamic light scattering (DLS), respectively.
2.3. Cell Line and Cell Culture
HepG2 cells and Human Umbilical Vein Endothelial Cell (HUVEC) were obtained from ATCC (Manassas, VA, USA) and were cultured in complete Dulbecco’s Modifed Eagle’s Medium (DMEM) containing 10% fetal bovine serum (FBS) and 1% antibiotic (penicillin/streptomycin).
2.4. Cellular Uptake of HA-Se@DOX
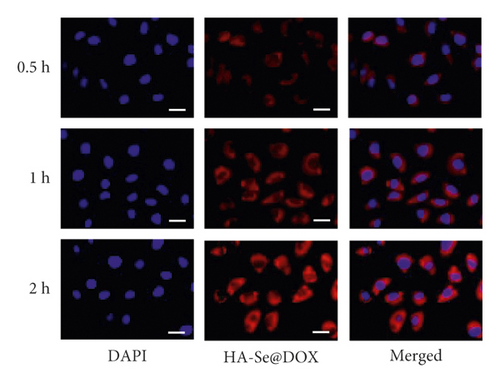
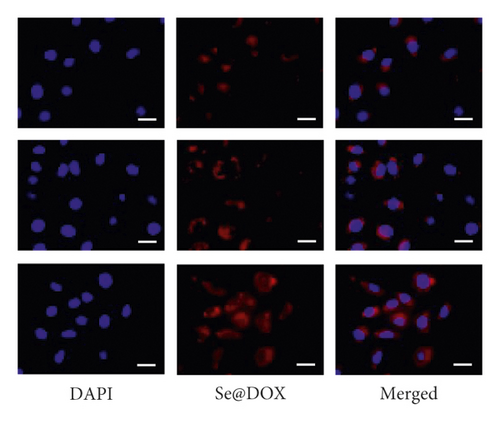
The uptakes of nanoparticles were studied using fluorescence microscope. The HepG2 cells were cultured in complete DMEM for 24 h and then exposed to 20 μg/mL of HA-Se@DOX or Se@DOX for different time. The cells were rinsed with cold PBS and then stained with 1 μg/mL of DAPI for 15 min. Finally, the uptakes of nanoparticles were visualized via red fluorescence from DOX, and the images were captured using a fluorescence microscope (Leica DMi8).
2.5. The Uptake Mechanism of HA-Se@DOX
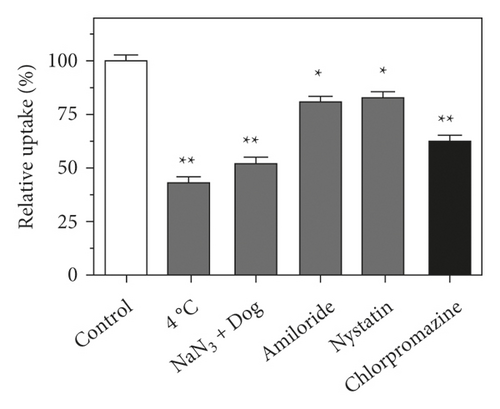
The uptake mechanism of HA-Se@DOX was explored by ICP-MS as a previous report [28]. Firstly, HepG2 cells were exposed to HA-Se@DOX (20 μg/mL) for 4 h at 4°C without inhibitors, or at 37°C with various inhibitors. Finally, the relative uptake rate of HA-Se@DOX was calculated by ICP-MS.
2.6. The pH-Response Release of DOX
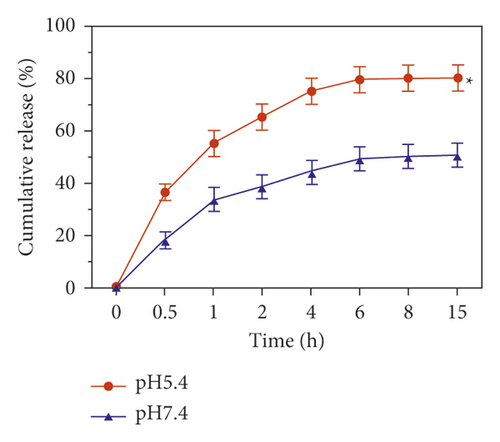
The test of drug release in vitro was performed in phosphate buffer solution (PBS) with different pH values (pH 5.4 or pH 7.4). In brief, 2 mg of HA-Se@DOX was diluted with 1 mL of PBS and then the PBS containing HA-Se@DOX was put in the dialysis bag. Subsequently, the dialysis bag (3.5 kDa molecular weight cutoff) was immersed in 1L of PBS (pH 5.4 or pH 7.4) and incubated on the shaker at 37°C. Finally, the amount of DOX was monitored by HPLC.
2.7. Cell Viability Assay
The cytotoxicity of various DOX formulations on HepG2 cells was measured by a method using MTT assay as described earlier [29]. Briefly, HepG2 cells (5 × 10⁴ per well) were seeded in 96-well plates and then cultured overnight. After treatment with different DOX formulations for 24 h, the cells were rinsed with PBS. The each well was added with 15 μL of MTT solution (5 mg/mL). After 4 h, 150 μL/well of dimethyl sulfoxide (DMSO) was used to dissolve formazan crystals formed by live cells. The toxicity of HA-SeNPs against HepG2 cells was examined as mentioned above. A microplate spectrophotometer was used to test the absorbance at 570 nm.
2.8. Scratch Migration Assay
The in vitro migration of HepG2 cells were detected by the scratch method [30]. The HepG2 cells (5 × 10⁴ cells/well) were cultured in a 24-well plate overnight. Once the cell confluence reached nearly 100%, the center of the cell monolayers was lightly scratched in a straight line using a sterile microtip. Then the well was gently rinsed thrice to remove loosened debris of the cells. After the cells were exposed to various DOX formulations (2 μg/mL equivalent concentration of DOX) for 12 h, the gap between the cells was inspected and captured by a microscope at different points (0 and 12 h).
2.9. Invasion Chamber Assay
For measuring cell invasion, a transwell assay was performed [31]. HepG2 cells were prepared by incubating in a free-serum medium for 12∼24 h. Then, the collected cells were seeded onto the chambers to reach 80% confluence. After that, the cells were treated with various DOX formulations (2 μg/mL equivalent concentration of DOX) for 12 h. The cells at the bottom membrane of the chamber were fixed and then immersed in crystal violet (1 μg/mL) for 5 min. The stained cells were captured with a light microscope. Inhibition rates of cell migration were calculated by the following equation: inhibition of migration (%) = (cell number in control group − cell number in treated group)/cell number in control group × 100.
2.10. Flow Cytometry Study
To characterize the cell cycle distribution and apoptosis of HepG2 cells exposed to different DOX formulations, a flow cytometry was performed as previously reported [32]. In brief, the HepG2 cells were incubated with various DOX formulations (2 μg/mL equivalent concentration of DOX) for 24 h, and then the cells were harvested using trypsinization and washed with PBS. After that, the cells were collected and fixed with 70% ethanol before staining with propidium iodide. Data were collected by the CellQuest VTM software and processed with the FlowJoTM software.
2.11. Reactive Oxygen Species
The reactive oxygen species (ROS) generated in HepG2 cells was examined via DCFH-DA staining [33]. In brief, the cells were co-cultured with various DOX formulations (2 μg/mL equivalent concentration of DOX) for 24 h, respectively. Then, the cells were washed and co-incubated with 10 μM of DCFH-DA. Finally, the ROS production was examined using fluorescence microscope.
2.12. Statistical Analysis
Each experiment was carried out three times. All the data are presented as mean ± standard deviation. One-way analysis of variance was used for comparison among three or more groups. Values of ∗p < 0.05 or ∗∗p < 0.01 were considered to indicate a significant difference and very significant difference.
3. Results and Discussion
3.1. Preparation and Characterization of HA-Se@DOX
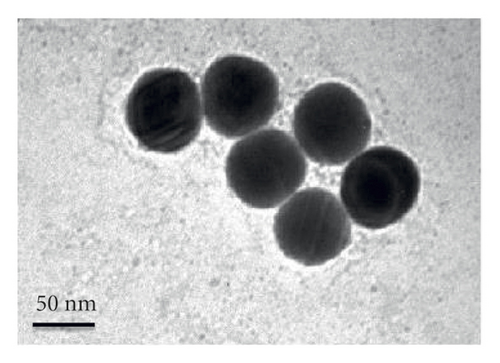
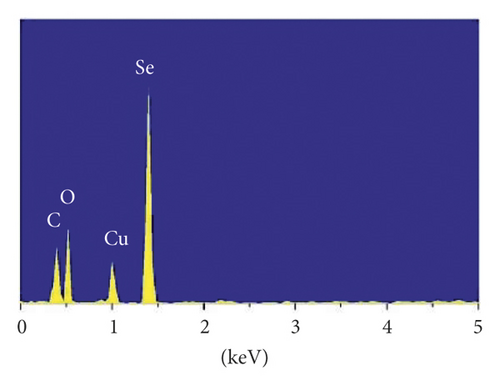
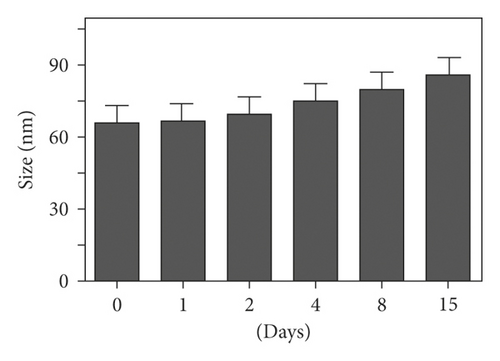
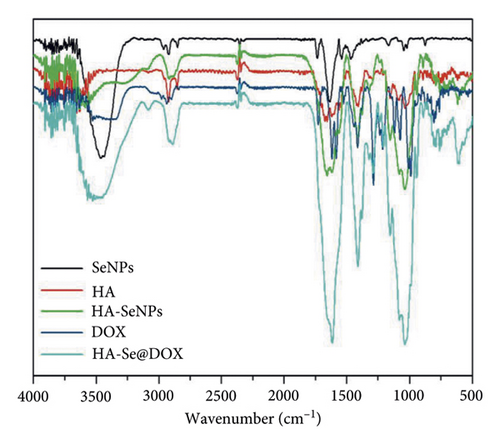
A size controllable and stable HA-Se@DOX was synthesized in this study. The SeNPs capped with HA were designed for targeted delivery of chemotherapeutic agent doxorubicin (DOX). As seen from Figure 1(a), the average size of HA-Se@DOX was approximately 65 nm. TEM analysis demonstrated that the HA-Se@DOX was monodisperse spherical morphology and the particle size was in the range of 50–80 nm (Figure 1(b)). However, the size of SeNPs was about 40–50 nm, indicating the functionalizing and loading of the DOX on the SeNPs’ surface slightly increased the size of SeNPs (Figure S1). The particle size within a certain range (50~200 nm) was proportional to the reaction concentration of raw materials. In addition, the surface modification of SeNPs could slightly increase its size. The nanoparticles with the size range of 50∼100 nm exhibited an optimal ability to deliver drugs to the tumor. Because particles with over 100 nm in size were not conducive to be taken up by tumor cells, particles with less 50 nm in size were possibly taken up in large quantities by normal cells, resulting in undesired toxic side effects. The zeta potential of SeNPs also changed from negative to positive after the functionalizing and loading of the DOX on the SeNPs’ surface (Figure S2), which would be beneficial for the internalization of nanoparticles. As seen from Figure 1(c), the marker signals of the Se, O, and C atoms appeared in the EDS peaks of HA-Se@DOX, suggesting that HA-Se@DOX complex was successfully synthesized. Furthermore, the average size of HA-Se@DOX was kept at 90 nm for 15 days (Figure 1(d)), indicating HA-Se@DOX was highly stable. As shown in Figure 2, the FTIR spectrums of HA-Se@DOX, DOX, SeNPs, HA, and HA-SeNPs were observed. The characteristic peaks of SeNPs, HA, and DOX also appeared in the spectrum of HA-Se@DOX. The typical amide peak at 1635 cm-1 from HA and the broad hydroxyl peak at 3285 cm−1 from DOX appeared in spectrums of HA-SeNPs@DOX, confirming the successful loading of HA and DOX onto the surfaces of SeNPs.

3.2. Cellular Uptake of Se@DOX and HA-Se@DOX
The uptake of Se@DOX and HA-Se@DOX in HepG2 cells was observed using fluorescence microscope. As seen in Figure 3, the red fluorescent signal from DOX in the Se@DOX and the HA-Se@DOX groups became stronger with increasing time, indicating that the cellular uptake of Se@DOX and HA-Se@DOX in the HepG2 cells is a time-dependent process. The quantitative analysis of fluorescence intensity in HepG2 cells showed that HA-Se@DOX exhibited significantly stronger cellular uptake than Se@DOX in HepG2 cells (Figure S3). These results indicated that HA-conjugated SeNPs exhibited greater ability to deliver DOX to HepG2 cells in comparison with SeNPs.
3.3. Endocytosis-Dependent Cellular Uptake of HA-Se@DOX
Endocytosis is a temperature-dependent and energy-consuming active cellular process [34]. The HepG2 cells were exposed to HA-Se@DOX at low temperature (4°C) or normal physiological temperature (37°C), respectively. Compared with 37°C, 4°C or NaN3/DOG treatment obviously reduced the internalization of HA-Se@DOX (Figure 4(a)), confirming the energy-dependent uptake way of HA-Se@DOX in the HepG2 cells. To further explore the specific endocytic pathways of HA-Se@DOX, these endocytosis-related inhibitors, including micropinocytosis inhibitor amiloride, caveolae-related inhibitor nystatin, and clathrin-related inhibitor chlorpromazine were used to pretreat the HepG2 cells. As shown in Figure 4(a), after the pretreatment with amiloride or nystatin, the uptake of HA-Se@DOX in HepG2 cells was decreased by 19.7% and 16.8%, respectively. However, the uptake of HA-Se@DOX in the chlorpromazine-pretreatment group was reduced by 37.5%. The above result showed that HA-Se@DOX entered HepG2 cells mainly through clathrin-related endocytosis.
3.4. The Release of DOX from HA-Se@DOX
The pH-response and time-dependent release of DOX was assessed under the conditions of pH 5.4 and pH 7.4, which represented the endo-lysosomal microenvironment and physiological condition, respectively. As shown in Figure 4(b), in physiological condition (pH 7.4), DOX from HA-Se@DOX was slowly released within 15 h, and the cumulative release was only less than 50%. However, in pH 5.4, simulating the endo-lysosomal microenvironment, the release rate was increased evidently, which reached approximately 80% within 15 h. The release rate of DOX in pH 5.4 was 1.6-times higher than that in pH 7.4. The result indicated that the DOX release follows an acid-triggered manner. The faster release of DOX in pH 5.4 can be explained that the decrease of the surface negative charge of the SeNPs in an acidic environment weakens the electrostatic attraction of DOX and facilitates the release of DOX from the SeNPs. Generally speaking, the tumors exhibited more acidic environment than normal tissues, so the pH-dependent drug release is advantage for the treatment of cancers [35]. In sum, it is feasible to use HA-SeNPs as an effective anticancer drug delivery carrier.
3.5. Effect of Various DOX Formulations on Cell Proliferation
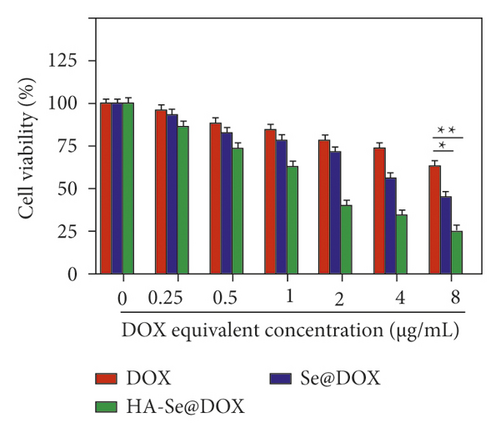
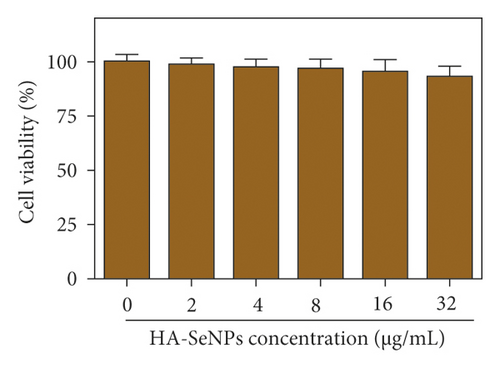
To evaluate whether various DOX formulations affected the proliferation of HepG2 cells, cell viabilities in different treatments were determined by MTT assay. Seen from Figure 5(a), DOX, Se@DOX, and HA-Se@DOX all revealed a trend to dose-dependently suppress the cell viability. Furthermore, DOX displayed weak activity to inhibit the cell viability, while Se@DOX significantly suppressed the cell viability with the increasing concentrations of Se@DOX. This result suggested that SeNPs enhanced the efficiency of DOX to suppress HepG2 cell proliferation. Compared to DOX and Se@DOX, HA-Se@DOX exhibited the most cytotoxicity against HepG2 cells, with markedly effects at the equivalent DOX concentration of 8 µg/mL. The MTT assay revealed HA-SeNPs enhanced the activity of DOX to suppress the proliferation of HepG2 cells. Furthermore, the cell viability of HA-SeNPs was also assessed in the HepG2 cell model. As shown in Figure 5(b), HA-SeNPs hardly had effect on the cell viability even at high concentration up to 32 µg/mL, suggesting that HA-SeNPs are biocompatible drug delivery carriers. The toxicity of HA-Se@DOX in HepG2 and Human Umbilical Vein Endothelial Cell (HUVEC) was also assessed by MTT assay. As shown in Figure S4, the HA-Se@DOX exhibited stronger activity to inhibit the proliferation of HepG2 cells than HUVEC, indicating good selective toxicity of HA-Se@DOX between HepG2 and HUVEC.
3.6. HA-Se@DOX Inhibits Migration/Invasion of HepG2 Cells
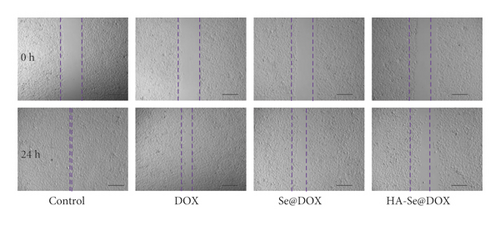
The migration capacities of HepG2 cells were determined by the scratch migration assay. As shown in Figure 6(a), the cell scratch was clearly healed in the control group, however, the cell scratches were significantly inhibited by three DOX formulations. It was worth nothing that the gap of the HA-Se@DOX group was significantly wider than that in the DOX or Se@DOX group, indicating HA-Se@DOX showed the greatest capability to inhibit the migration of HepG2 cells.

Furthermore, the transwell assay was performed to investigate the effect of three DOX formulations on cell invasion. As shown in Figure 6(b), the number of invaded cells in the HA-Se@DOX group was significantly decreased compared to the control group. The inhibition rate of migration in the DOX, Se@DOX, and HA-Se@DOX groups were 12.3%, 32.6%, and 53.7%, respectively. The results revealed that HA-Se@DOX had stronger ability to depress HepG2 cells invasion than DOX or Se@DOX. This phenomenon can be partly explained that HA-Se@DOX exhibited the most ability to inhibit the HepG2 cells activity, thus it also maximally inhibited the invasion of HepG2 cells. Taken together, the results demonstrated that HA-Se@DOX dramatically suppressed the migration/invasion of HepG2 cells compared with the DOX and Se@DOX groups.
3.7. The Effect of HA-Se@DOX on the Cell Cycle Distributions and Apoptosis
Apoptosis is considered one of the key mechanisms of anticancer action, and plays an important role in tissue homeostasis [36]. In this study, flow cytometry was used to study the cell cycle distribution and apoptosis in the HepG2 cell model. As seen from Figure 7(a), the sub-G1 peak indicated the apoptotic cells and the cell percentage in G0/G1 phase had no obvious difference in the control, DOX, Se@DOX and HA-Se@DOX groups. However, DOX-, Se@DOX- and HA-Se@DOX-treatment resulted in the increase in S phase and sub-G1 peak, indicating DOX, Se@DOX and HA-Se@DOX probably arrested cells at S phase and then induced cells apoptosis. From least to most, the percentages of apoptosis cell in different treatment groups were ranked as following: DOX (12.21%) < Se@DOX (17.68%) < HA-Se@DOX (44.62%). The results suggested that HA-Se@DOX was the most effective therapeutic to induce HepG2 cells apoptosis compared with the other groups.


3.8. The Anticancer Mechanism of HA-Se@DOX
The recent report showed that the reactive oxygen species (ROS) is a significant target to induce the cancer cells apoptosis [37]. Therefore, the ROS production in HepG2 cells treated with three DOX formulations was examined using the DCFH-DA fluorescent dye. As seen from Figure 7(b), the obvious green fluorescent signal was observed in the HepG2 cells after being exposed to DOX, Se@DOX, or HA-Se@DOX for 8 h, and the mean fluorescence intensity (MFI) in the DOX-, Se@DOX- or HA-Se@DOX-treated HepG2 cells were 14.67, 21.33, and 45.0, respectively (Figure S5), indicating HA-Se@DOX had the greatest ability to promote the production of ROS in HepG2 cells. The above results showed that HA-Se@DOX could induce HepG2 cells apoptosis probably by promoting the production of ROS. HA-Se@DOX might also activate the apoptosis-related proteins (such as caspase-3) to induce HepG2 cells apoptosis. Thus, the underlying mechanism needs to be further explored.
4. Conclusion
In the current study, HA-Se@DOX was designed as a novel chemotherapeutic agent to enhance anticancer activity of DOX. As anticipated earlier, the HA-SeNPs could effectively enhance the uptake of DOX in HepG2 cells and exhibited a pH-response release. Furthermore, HA-Se@DOX showed superior ability to suppress HepG2 cell proliferation and migration. HA-Se@DOX induced HepG2 cell apoptosis probably by the production of ROS. In addition, the tumor-bearing mice model should be established to assess the in vivo antitumor efficacy of HA-Se@DOX in the future, and there is a big challenge to deliver them effectively to its targeting tumor. Taken together, our finding demonstrates that HA-Se@DOX provides a hopeful strategy for the treatment of HCC.
Conflicts of Interest
The authors declare no conflicts of interest.
Acknowledgments
This work was supported by the Guangdong Basic and Applied Basic Research Foundation (2021A1515110457), the Technology Planning Project of Guangzhou City (202102010036 and 202102010202), the Guangdong Medical Science and Technology Research Fund of Guangdong Province (A2021497), the Guangzhou General Science and Technology Project of Medicine and Health (20211A011014), the Guangzhou Medical University Students’ Scientific Research Innovation Ability Improvement Project (02-408-2203-2080), the Guangzhou Medical University Students’ Science and Technology Innovation Project (2021AEK119, 2021AEK122, 2021AEK125, and 2021AEK128).
Open Research
Data Availability
The data used to support the findings of this study are available from the corresponding author upon request.


