[Retracted] Research on the Construction of Crossborder e-Commerce Logistics Service System Based on Machine Learning Algorithms
Abstract
Based on machine learning algorithms, this paper designs a crossborder e-commerce logistics service system recommendation algorithm. First, we introduce the meaning of query recommendation, analyze the mechanism of e-commerce platform shopping search, redesign the query recommendation process on this basis, establish a Markov decision process model for the problem, and solve the optimal recommendation strategy through deep machine learning algorithms. Second, we design a simple calculation example, use Python programming through a simulated shopping environment, give the solution process of the optimal recommendation strategy in the whole process, and prove the feasibility of the algorithm. The sentiment synthesis word vector is used as the input data structure of the text, the convolutional neural network model and the recurrent neural network model in machine learning are independently designed and constructed, and a shunt is proposed. The rule (shunt) realizes the operation of judging the data and inputting the two machine learning networks. The shunt fully realizes the combination of the advantages of the local feature characterization of the convolutional neural network and the timing characteristics of the recurrent neural network and achieves a more efficient and accurate electrical system. Finally, through simulation experiments, a series of data processing work such as data outlier cleaning, sliding window construction features of data variables, and training set and test set division are designed to convert regression prediction problems into classification problems to predict commodity demand. At the same time, it also compared the effect of the time series model, random forest model, GBDT, single Xgboost model, and the model used in this topic and analyzed the reasons for this difference and the application of each model.
1. Introduction
The conversion rate of search ads in e-commerce platforms is used as an indicator to measure the effect of advertising conversion, which comprehensively characterizes users’ purchasing intentions for advertised products from multiple perspectives such as advertising creativity, product quality, and business quality [1]. Increasing the conversion rate, on the one hand, can enable advertisers to match users who are most likely to purchase their own products and increase the advertiser’s return on investment (ROI); on the other hand, it can also enable users to quickly find products with the strongest willingness to buy, thereby improve the user experience in the e-commerce platform. With the gradual maturity of the e-commerce industry, businesses and users have put forward higher requirements for the conversion of searched advertisements. Regrettably, for search advertising, existing research mainly focuses on exposure and click-through rate, and research on conversion rate is rarely involved. What are the influencing factors of the conversion rate and how to improve the conversion rate has become an urgent problem to be solved [2–5].
The hypothesis of machine learning location can be located at any location in continuous space. The method of solving continuous site selection is usually the analytical method. The advantage of continuous site selection is that it has strong flexibility, but the disadvantage is that the assumption of continuous space tends to ignore actual space factors, resulting in lower feasibility of the final site selection results [6–8]. As e-commerce companies gradually improve their logistics system, commodity demand forecasting has become an important part of commodity sales planning and logistics management. As accurately as possible, grasping the influencing factors that affect demand and the degree of influence of variables on the results will help improve the accuracy of forecasting. This will help merchants make decisions, achieve overall optimization, and increase the sales of products for a period of time in the future, and timely replenish products for sales. Regarding the possible decline in the future sales of commodities, timely promotion and price reduction are used to reduce commodity inventory and minimize the loss of e-commerce merchants [9–11].
This paper establishes a machine learning model with the conversion rate as the target and analyzes the features that the model relies on after training and learning with big data, so as to find out the influencing factors of the conversion rate. The results of data mining show that among the influencing factors of search advertising conversion rate, the top rankings are logistics services, product sales, consumer preferences, and the accuracy of e-commerce platform query recommendations. In the first stage, the e-commerce platform should try to improve the accuracy of query recommendation; in the second stage, the business should place accurate advertisements with the characteristics of consumers, such as considering when and what content to publish; the third stage, merchants should improve the quality of advertising products and stores, such as the establishment of product prices, expand product sales through activities, and improve store logistics service, etc. Among them, the first stage of query recommendation is the basis of the entire conversion process and the only controllable factor of the platform in the three stages. Therefore, for the platform, the research here should be mainly started to improve the conversion rate.
2. Related Work
With the rapid development of big data, cloud computing, hardware GPU, and storage technology in recent years, machine learning has obtained extremely possible application practices. Compared with traditional machine learning methods, machine learning has a deeper model depth and is closer to brain learning. Based on the subject of bionics to further grasp the more abstract and deep features, it has achieved great success in image and speech recognition. At present, more and more scholars are bringing it into the field of natural language processing, which is also some of the latest natural language processing trends [12–14].
Qing et al. [15] take fast-moving consumer goods in e-commerce as the research object to study the demand for fast-moving consumer goods in e-commerce and then optimize commodity inventory through demand forecasting. Inventory optimization is also based on replenishment costs for adjustment and optimization. First, a time series model based on ARIMA was established based on the existing data to study the demand for fast-moving consumer goods under the time series. Then, based on the existing variable characteristics such as the inventory of fast-moving consumer goods, the number of clicks, and the types of goods, a multiple linear regression model was established to predict the demand for goods. Based on the existing data, the forecast of commodity demand for vector autoregression was carried out. Ge and Han [16] obtained the advantages of vector autoregression in the forecast of commodity demand by looking at the fitting effect of the model. Finally, the author also used BP neural network to prove the advantages of neural network in forecasting commodity demand. Ma et al. [17] found through comparative research that, first of all, the author’s own data features are used less, which is not suitable for machine learning models similar to integrated models, and the data size has higher requirements for neural network algorithms, and the data need to have a higher dimension to model the data; otherwise, it will cause over-fitting, and only have good results for the current data set, but if the modeling is put into the actual production environment, the model may not produce good results. The author finally did a cluster analysis on the location of the inventory through K-means.
Based on the algorithm of the support vector machine, Zhu and Shi [18] conducted a research on the demand for vegetables and selected qualitative and quantitative factors that affect vegetable sales to train the model. Choosing some qualitative variables is not easy to quantify variables including macroeconomic policies, the direction of economic development, and the level of urban development. The author considered the nature of macro variables that are not easy to quantify and did not include these variables in the scope of the model in the final modeling. Bilgic and Duan [19] use a comprehensive model of multiple regression and time series to forecast the demand for cigarette sales. Among them, the variables used in the multiple regression models mainly include GDP, urban per capita income, and types of social workers for modeling. Intuitively, it is difficult to measure the importance of the variables with GDP and other variables together with the consumption of cigarettes [20–22]. The researchers used the Bayesian method to study the demand forecast and inventory optimization of short-period products. The initial parameters of the model were given through the simulated annealing algorithm, and the parameters of the model were gradually optimized through the gradual changes in product sales. Finally, the effectiveness of the model is verified through evaluation indicators such as RMSE [23, 24].
3. Machine Learning Algorithm Architecture
3.1. Algorithm Recursion
Machine learning achieves the purpose of adapting to the environment by constantly exploring the environment and adjusting its behavior according to the feedback of the environment. The basic principle is shown in the text. When the agent completes a certain task, it chooses an action to be used in the environment. After the environment is affected by the action, the state changes, and at the same time, a return signal (reward or punishment) is generated to feedback to the agent.
The division of training set and test set is to test the effect of the model and avoid over-fitting to a certain extent. The division of the training set and the test set has a great impact on the model. For example, in the financial antifraud model, OOT (out of time) is often used to divide the training set and the test set in chronological order. The purpose is to verify whether the current model will have a predictive effect on samples in the future time period.
3.2. Data Cleaning
By adjusting the parameters several times, a higher learning accuracy rate is finally obtained. Since the input layer of the model is related to the number of input variables, this empirical analysis has 25 variables, so 25 input units are set here. Here, it is only judged whether it is the person who has swiped the order, and then, two output units are set here. The model parameters are set as follows in the Python code.
In logistic regression, redundant variables will have side effects on the model and make the model worse. We can use L1 regularization to select variables in the original data that are useful to the model. In the ensemble model, such as the random forest model, the importance of each variable can be directly output, because the information gain of each variable is calculated in the process of training the model, and the information gain directly represents the importance of the variable to the model. Similarly, because in most ensemble tree models, variables are automatically selected during model training, when the ensemble tree model is trained, redundant variables will not have too much influence on the results.
3.3. Algorithm Optimization
Since each machine model will produce a biased solution to the learning problem, it is important to evaluate the pros and cons of the learning ability of an algorithm model. According to the algorithm settings used in Table 1, we can use a test set to test the accuracy of the algorithm model or design a model performance test standard for the target application.
| Node 1 | Node 2 | Node 3 | Node 4 | |
|---|---|---|---|---|
| Character a | 0.94432 | 0.15097 | 0.01423 | 0.94432 |
| Character b | 0.43312 | 0.13487 | 0.46617 | 0.43312 |
| Character c | 3.07063 | 0.40737 | 0.32657 | 3.07063 |
| Character d | 0.11601 | 0.00351 | 0.22552 | 0.11601 |
The word frequency is the best threshold segmentation point. There is no specific theoretical basis for this point. It is observed that the frequency distribution shows that the number of characters within 25 does not have a stable distribution. Here, we take out all reviews within 25 characters to artificially check their characteristics and find that most of them are based on one or two characteristics of the product. Human observations are normal reviews, so 25 is selected as the threshold here, and the number of characters is less than or equal to 25.
4. Construction of Crossborder e-Commerce Logistics
4.1. Exploring Machine Learning Algorithms
Machine learning algorithms use all documents to analyze the relationship between words in the document, find other words that are closely related to the query word, and then construct a recommended query. To put it simply, a frequency vector is constructed according to the frequency of each word in each document, and the similarity between the vectors is used to reflect the similarity between words.
The optimization of the CMDP problem is equivalent to minimizing the upper bound of the transfer-penalty function in a single cycle. But often because the number of documents is much larger than the number of words in the topology in Figure 1, the resulting vector is too sparse, which is not conducive to similarity calculation. This problem can be solved by decomposing the matrix, but the computational complexity is too high, and it is difficult to bear in the face of large-scale data.
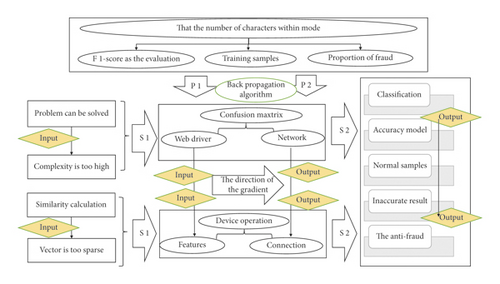
It can perform the nonlinear transformation of linear values, for example, the sigmoid function can map the input value to between [0,1]. Since the error of the back-propagation algorithm needs to be guided to find the direction of the gradient, all the activation functions are required to be continuous and differentiable.
We can appropriately increase the proportion of positive samples by over-sampling the positive samples and then use AUC or KS as the evaluation indicator of the model to monitor the effect of the model. The performance evaluation of classification models often uses confusion matrix, ROC curves, or classification accuracy methods to evaluate data mining models.
Taking into account the anticrawl mechanism of web pages and the characteristics of some web pages that are more complex and difficult to find web pages, the Selenium module is used here, as a tool for web application testing, mainly through WebDriver to drive chrome Google browser for simulated browsing device operation.
4.2. Evaluation of Logistics Services
In the logistics service level, the deep neural network of multiple hidden layers has strong feature extraction capabilities. The input information is combined and extracted through the layer-by-layer network to finally abstract the gold features recognized by the computer, thereby discovering the internal connection between the data.
To express the Q table through a neural network, the first problem is to define the loss function for training. In order to reduce the frequent and large fluctuations in the training of neural network parameters, the team introduced the auxiliary neural network Target Q in the DQN algorithm. Table 2 shows that there are two neural networks, one is used to create learning goals, and the other is used for actual training, to ensure the smooth learning of the neural network.
| Comment data | Variable a | Variable b | Variable c |
|---|---|---|---|
| Actual training | 0.41295 | 0.53928 | 0.15255 |
| Model training | 0.78639 | 0.22905 | 0.06813 |
| Indicator training | 1.82087 | 0.09899 | 0.43799 |
| Analysis training | 0.27033 | 0.12907 | 0.1874 |
| Review training | 9.99147 | 0.14925 | 0.53636 |
After deleting the comment data, it is observed that the data are commented from several angles, and it is more appropriate in terms of the number of information that can be extracted and the number of samples retained. After reviewing possible comments, we finally got more suitable analysis data. Among them, the user experience and objective environment indicators are derived from the subject word extraction. It should be noted that when constructing the indicators, the frequency of occurrence of all the abovementioned secondary indicator variables in each comment is counted as the value of the variable.
4.3. Crossborder e-Commerce Level Nesting
In the process of searching for crossborder e-commerce, a series of retrieval behaviors for the same retrieval target constitute a session. Many times, a session will contain multiple queries, which indicates that the user is not satisfied with the retrieval results of the initial query in the session.
Second, two queries that often appear in the same session are likely to be semantically similar because they express the same query intent multiple times. Therefore, recommendations can be made based on the co-occurrence information queried. However, the session-based method needs to divide the query log into multiple sessions first, and the division of sessions will affect the accuracy of query recommendation.
The traditional method judges whether the two queries are in the same session based on the time interval. If the data time interval in Figure 2 is greater than a set threshold, the session switch is performed between the two queries point. Obviously, it is not very accurate to rely solely on the time interval to divide the session.
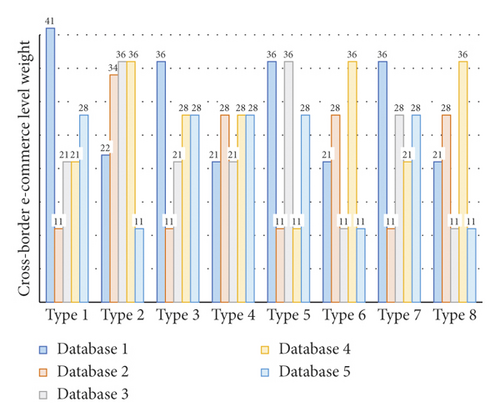
This is a general-purpose auxiliary development tool that comes with the browser and has powerful functions. The variable comment feature variable is the frequency of occurrence of the relevant secondary variables according to the part-of-speech statistics after the comment segmentation. The positive score and negative score of the secondary variable are calculated according to the emotional score calculation formula.
4.4. Analysis of the System Conversion Rate
This classifier finds that the ratio of true positives and false positives is the same, which means that the classifier cannot recognize the difference between the two, which is the baseline for evaluating other classifiers. If the ROC curve is closer to this line, the model is not very useful. Similarly, the perfect classifier in Figure 3 has a curve that crosses the 100% true-positive and 0% false-positive points. It has correctly identified all true-positive samples before incorrectly distinguishing any negative results. Most of the classifiers are similar to the test classifiers, which are located in the area between the perfect classifier and the classifiers that have no predictive value.
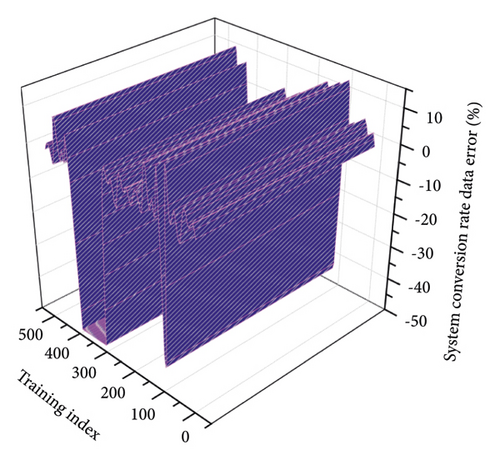
The DQN algorithm uses empirical playback to solve this problem. The experience playback method is to store the existing data or the data obtained by the agent’s subsequent interaction with the environment as a learning experience in the experience pool. After a fixed time or number of steps, a batch of data is randomly sampled from the experience pool for use in the Q network. The use of the experience replay mechanism breaks the timing dependence between the data obtained from the machine learning interaction. At the same time, the method of random batch data (minibatch) in the neural network optimization can be used to accelerate the training.
5. Application and Analysis of Crossborder e-Commerce Logistics
5.1. Data Preprocessing of Algorithms
And, Doc_total_number is the total number of words in the text, so the Sentiment_orientation value can obtain the result of emotional intensity by percentage: a positive number means that the emotional tendency is positive and positive, and a negative number means that the emotional tendency is negative and negative, and the absolute value is closer to 1.
Where S(wi) is the sentiment value of the current sentiment word; F(wi) is the value of the negative word in front of the current sentiment word, namely −1, x is the number of negative words in front of the current sentiment word; R(wi) is the weight of the affective coefficient of the interjection. The entire sentiment value and coefficient weights are obtained from the current quantitative vocabulary look-up tables of various sentiment computing scholars.
| Logistics step | Training process | Distribution level 1 | Distribution level 2 |
|---|---|---|---|
| 1 | Evaluation text sentiment classification | 0.03393 | 0.22905 |
| 2 | The general loss function | 0.02986 | 0.09899 |
| 3 | The affective coefficient of the interjection | 0.49294 | 0.12907 |
| 4 | The emotional tendency is negative and negative | 0.39901 | 0.14925 |
| 5 | The model must be appropriately converted | 0.53313 | 0.01689 |
When conducting an e-commerce evaluation text sentiment classification experiment, we selecteda corpus of 40,000 evaluation texts, including 20,000 positive sentiment comment materialand 20,000 negative negative comment materials, with an overall training set to test set ratio is 8:2. Its size is only 3793 kb, which is convenient for mobile storage.
5.2. e-Commerce Platform Simulation Analysis
The evaluation standard of the experimental results is particularly important. It is an important demonstration standard to measure the effect of this “word vector-based e-commerce evaluation sentiment dictionary construction and application” and its own method validity and value contribution.
It is based on scientific demonstration and objectively quantifiable. There are currently three commonly used text classification indicators, namely the accuracy, recall, and F1 values in Figure 4. Precision reflects the ability of the algorithm model to obtain correct results, and recall is to obtain relevant results, and the F1 value comprehensively considers the balance of the first two indicators, and they are closely connected to form a commonly used text classification evaluation system.
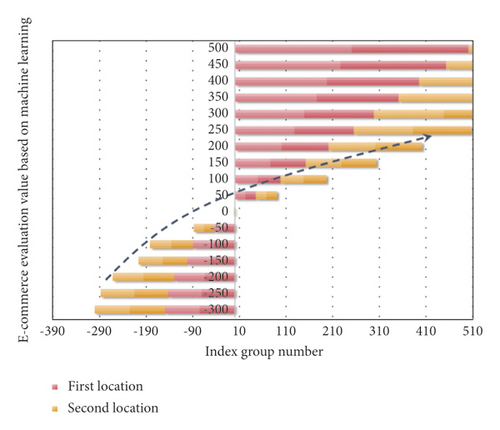
The experiment first uses a user-defined dictionary for word segmentation and part-of-speech tagging. After word segmentation, the sequence traverses first to find a positive emotional word or a negative emotional word and then traverses forward to the beginning of the sentence or the previous emotional word, and uses it as a window to calculate the emotional tendency value of the entire window, including negative words in the calculation process. After repeating until the end of the sentence, the sentiment value of the sentence is accumulated, judged whether the sentence is an exclamation sentence or a rhetorical question, and calculated the sentiment value of the whole sentence.
5.3. Weight Setting of the Logistics Service System
The logistics service query log records the URLs clicked by the user during each query. These URLs can be used to explore the closeness of the relationship between the queries. If many of the click URLs corresponding to the two queries are the same or similar, then the two queries have a great correlation. According to this idea, the query term is recommended. This paper proposes a distributed task offloading strategy and computing migration algorithm.
It can be concluded that the time spent on text emotion classification based on the general sentiment dictionary collection in the experiment is relatively high because the word matching success rate in the e-commerce product evaluation text is lacking, resulting in an accuracy rate of only 73.88%, which is based on general purpose. The text classification accuracy rate of the sentiment dictionary collection e-commerce sentiment dictionary reached 86.31%, an improvement of 12.43%.
In terms of recall rate, because the general dictionary is obviously focused on judging good reviews, it also shows the imbalance defect of the general emotional dictionary in terms of negative reviews and good reviews. Xgboost does a second-order Taylor expansion of the loss function and adds a regular term to the objective function to find the overall optimal solution, which is used to weigh the decline of the objective function and the complexity of the model over-fitting.
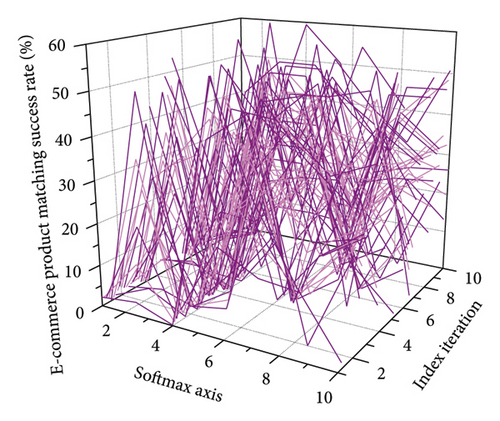
In fact, the conventional logistic regression model can also be used in the positive and negative emotion classification in this article. However, although softmax regression is supervised, it can also be combined with machine learning, that is, unsupervised learning methods. Therefore, based on the general form, the model designed in this paper uses softmax regression for sentiment classification. Softmax is applicable to both multiclassification and two classification problems. In this paper, only softmax is used for the two-class classification of positive and negative emotions.
5.4. Case Application and Analysis
The overall coding of the experiment is developed using python3.5 because the Tensorflow framework perfectly supports the python language, and the training calculation of the word vector is mainly based on the word2vec method training in the Gensim open-source library of the python language. It is a machine learning platform framework that can achieve rapid modeling and crosslanguage compatibility.
It can significantly reduce the energy consumption of the system and the service delay of the business. It also supports parallel training of GPU and CPU. The current GPU-based Tensorflow 1.3.0-gpu version is more stable from the final data collection to preprocessing and from the subsequent training and combined generation of emotional integrated word vectors, to the final design, implementation, and training and testing of convolutional neural networks.
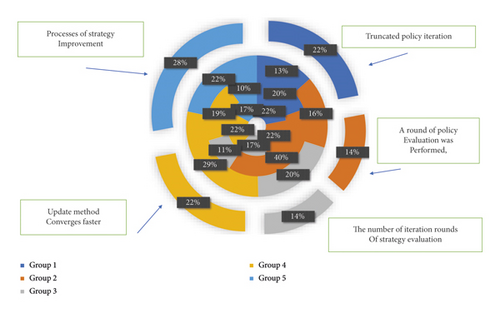
After a limited number of mutual games, mutually satisfactory correlation results are achieved. In terms of F1 value, the construction and application method of the special sentiment dictionary proposed in this paper has also been significantly improved, increasing the 82.37% of the traditional dictionary application to 88.24%, which is a good improvement for the judgment of good and bad reviews.
Finally, in terms of time, because the “text sentiment classification based on the general sentiment dictionary collection + e-commerce sentiment dictionary” method combines the sampling word frequency of the e-commerce evaluation, the filtering of irrelevant words, etc., it is relatively short and concentrated, so the processing time is less expensive 279 s successfully accelerated to 47 s.
6. Conclusion
This article analyzes the shopping search process in e-commerce platforms and introduces supervised machine learning algorithms to mine the factors affecting the conversion rate of logistics products. Compared with traditional regression analysis, the mining factors are more comprehensive, and the process is relatively simple. At the same time, the query recommendation process is summarized as a sequential decision problem, which can provide a reference for the design of the e-commerce query recommendation system. At the same time, a stacking model based on Xgboost is established, and the model output of the primary classifier is used as the input of the secondary learner model. Compared with the result of using only a single machine learning model, the result of using the stacking model has further improved the accuracy. This stacking model based on the Xgboost algorithm has not appeared in the forecast of commodity demand. At the same time, because the subject has restructured a large number of variables in the feature, this provides the possibility to model the primary learner. When the output of the primary learner is used as the input of the secondary learner, this is to a certain extent. Variables are processed with dimensionality reduction, which not only further improves the generalization ability of the model but also makes the model effect more improved than a single model. In order to maximize the preferences of both the supply and demand of resources, this paper designs a calculation migration mechanism based on the two-way matching theory. We construct a Markov decision model for the query recommendation process in actual shopping and design a deep machine learning algorithm to solve the model. The experimental results show that after trial learning, the platform learns the optimal strategy, and it is selecting popular content in a certain decision-making process proves the effectiveness of the algorithm. Compared with traditional query recommendation, this method has the characteristics of accuracy, intelligence, and real-time adaptation.
Conflicts of Interest
The authors declare that they have no conflicts of interest.
Acknowledgments
The study was supported by the Provincial University-Industry Collaborative Education Program of Higher Institute of Zhejiang Province (2020) “Industrial College Development through College-Enterprise Cooperation to Forge Highland for Nurturing High-Caliber International Foreign-Trade Talents.”
Open Research
Data Availability
The data used to support the findings of this study are available from the corresponding author upon request.


