Design of Knitted Garment Design Model Based on Mathematical Image Theory
Abstract
Iconology is an approach used by Western art theorists and art history researchers to explain plastic art and even relative to other various plastic art activities. This article is aimed at researching and discussing the design of knitted garment design model based on mathematical image theory. This article first discusses the application of digital image processing in the field of knitted clothing; digital image processing technology has a wide range of applications in the field of knitted clothing, including four aspects of fiber, yarn, fabric, and clothing, and proposes digital image filtering technology and digital image fuzzy filtering algorithm and then researches and analyzes the drape performance of knitted fabrics. Fabric drape is an important performance that reflects the beauty of the appearance of the fabric. The design of knitted garments is discussed based on mathematical imagery, and finally, the pressure performance of knitted garments is tested and analyzed. The experimental results in this paper show that the data correlation of the clothing pressure measured in different situations of the upper body is 0.87328, 0.779832, and 0.780213, respectively, under the plain weave, rib, and mesh fabric clothing fabrics. It shows that under the pressure of this degree of knitted clothing, it is in line with the needs of human healthy growth, because a certain degree of clothing pressure can maintain human physical and mental health and improve the quality of life.
1. Introduction
With the continuous development and growth of the economic level, as the top “clothing” of clothing, food, housing, and transportation, people not only wear clothing for shame but also choose clothing for the needs of beauty. People continue to advocate leisure, comfort, and sports in people’s lives. The knitwear industry has developed rapidly and has become a clothing category that has received much attention and welcome nowadays, and it is gradually developing in the direction of fashion and outerwear. At the same time, we apply new technologies, new processes and new materials to the design of knitted clothing to make it more comfortable and better performance. In modern daily life, knitted clothing has always been in a very important position and has become an indispensable clothing category in people’s lives. In order to better adapt to the development status of the domestic market, many knitwear brands have begun to reduce the rate of basic knitwear leaving the factory, and more of them are shifting their attention to the design concept with a sense of design. Nowadays in the knitwear industry, many companies pay much attention to the promotion of corporate culture in the process of sales planning, instead of starting from the starting point of innovative design and using the most primitive methods to achieve the most ideal goals. Nowadays, influential materials such as painting and computer production are increasing rapidly in society. This is the reason why popular visual culture such as iconography has replaced classical text culture as the dominant cultural trend. The innovative design of knitted garments can completely find their own inspiration in iconography and present the latest concepts and methods of the knitted garment industry with various innovative methods.
The principle of mathematical iconography is intuitive and visual. At present, the application of mathematical iconography in knitted garment design is still only in the extraction and application of the image pattern itself, and there is no related principle combined with knitted garment design. Most designers in the knitwear industry only use suitable image styles to directly apply images to the design of knitwear and even copy them in the selection of images, without designing and deforming the image itself. It does not start from the brand culture of knitwear design and the design connotation of the design works and does not carry out comprehensive design nor does it carry out the deformation design of the image from the perspective of form, style, and meaning. Therefore, it does not fully reflect the true value of images in knitwear design works. Therefore, how to use the principles of mathematical iconography to design knitted garments and how to decompose, reorganize, and extract connotations of images are particularly important for knitted garment brands.
According to the research progress at home and abroad, different scholars also have a certain degree of cooperative research on mathematical image theory and knitted garment design model: Kunihiko et al. proved that self-perspiration used in evaporative cooling (SPEC) clothing can effectively reduce skin temperature without increasing the humidity in the clothing. However, the cooling effect will be delayed until a sufficient amount of water permeates and evaporates. In this study, Kunihiko et al. hypothesized that wearer-controlled vaporization can improve the cooling effect. This study shows that SPEC-W can effectively reduce skin temperature without increasing the humidity in clothing [1]. The purpose of Ramzan et al. is to study the influence of stitching parameters and washing type on the dimensional characteristics of knitwear. Different stitching parameters are used, including stitch density, stitch type, stitch thread, and washing type. The key measurement values of the selected garment are used as output variables, namely, body width, sleeve length, body length, and shoulder width. The shrinkage rate was calculated by using the measurement results before and after washing. Studies have shown that stitching parameters have a significant impact on the shrinkage of knitted fabrics. Therefore, when developing patterns for fabric cutting, the expected shrinkage rate, that is, the residual shrinkage rate, must be considered to avoid accidental changes in the shape of the garment [2]. Tsypliashchuk et al. evaluated the effectiveness and safety of the 2 types of compressed knitwear VENOTEKS TREND and used it for conservative and injection venous sclerosis treatments for patients with clinical C1-C3 chronic venous diseases of the lower extremities. The study included a total of 30 patients, with a compliance rate of 92%. The results show that the 2 types of compressed knitwear, VENOTEKS TREND, statistically significantly reduced the degree of subjective symptoms, and it is effective and safe to treat edema syndrome after conservative treatment and sclerotherapy [3]. With the help of newer technology and combined with the main characteristics of clothing design, Tang discussed the related history, appearance, and corresponding connotation of clothing design, conducted in-depth and scientific research and discussion, and provided a new idea [4]. Itoh et al. evaluated the effectiveness of dimensionality reduction method in calculating similarity in image pattern recognition through mathematical experiments. Image pattern recognition is used to identify instances of specific objects and distinguish differences between images. This recognition uses pattern recognition technology to classify images [5]. Barbeiro and Lobo studied the optimized partial differential equation (PDE) model for image filtering. The gray image is represented by the vector field of two real-valued functions, and the image restoration problem is modeled through the evolution process, so that the restored image meets the cross initial boundary value problem at any time [6]. The purpose of Rajalakshmi and Prince’s research is to develop a mathematical model of the retinal layer with a complex neural structure that can detect incoming signals and convert the signals into an equivalent peak sequence. The proposed retinal layer model includes a photoreceptor, an outer plexiform structure (OPL), an internal plexiform structure (IPL), and a ganglion cell layer. They exhibit the characteristics of compression, brightness, and spatial-temporal filtering in visual information processing [7]. However, these scholars did not conduct research and discussion on the design of knitted garment design models based on mathematical iconology, but only discussed its significance unilaterally.
The innovations of this article are mainly reflected in the following: (1) Firstly, the application of digital image processing in the field of knitted clothing is discussed, and digital image filtering technology and digital image fuzzy filtering algorithm are proposed. (2) Then, the drape performance of knitted fabric garments was researched and analyzed, and the drape performance of the fabric is an important performance reflecting the beauty of the appearance of the fabric. (3) The design of knitted garments is discussed based on mathematical image science, and finally, the pressure performance of knitted garments is tested and analyzed.
2. Design Research Method of Knitted Garment Design Model Based on Mathematical Image Theory
2.1. The Application of Digital Image Processing in the Textile and Apparel Field
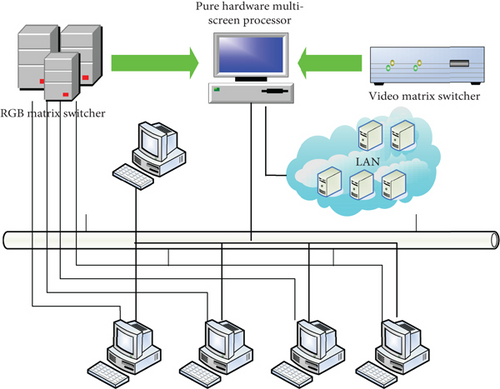
The development of digital image processing is closely related to the development of digital computers [8], as shown in Figure 1, for digital image processing technology. In recent years, with the development of computer science, digital image processing science and technology has also made rapid progress, and its field has gradually expanded, and considerable progress has been made in theoretical research and practical engineering applications [9]. Digital image processing is a general technology, combined with specific disciplines which can get a variety of effective application results [10].
- (1)
The application in fiber is mainly reflected in the surface characteristic test of the fiber, such as the appearance and shape of the fiber, the fiber fineness, the measurement of the balance of the cotton web, and the measurement of the fiber profile rate [12]
- (2)
The main application focus in yarn testing is yarn mixing state, yarn blending ratio test, and yarn appearance quality test
- (3)
There are many applications in fabrics, including the surface quality of fabrics, such as fabric defect inspection, pilling analysis, fabric flatness evaluation, fabric wrinkle analysis, and other applications. The monitoring of fabric specifications mainly includes automatic monitoring of fabric warp and weft density and automatic identification of fabric structure and fabric performance detection such as automatic detection of fabric moisture permeability and objective evaluation of fabric drape performance [13]
- (4)
The applications in clothing mainly include automatic measurement of control data of various parts of the three-dimensional human body, evaluation of clothing folds, and evaluation of clothing modeling [14]. Figure 2 shows the application of digital image processing technology in the textile and apparel field
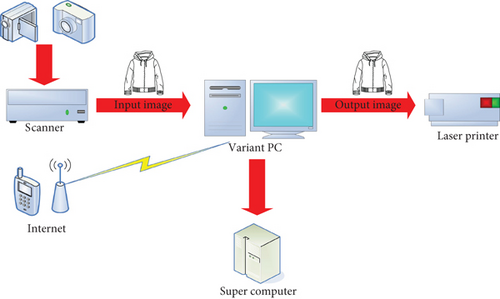
In short, the combination of digital image processing technology and the textile and apparel field has greatly promoted the development of the textile industry, improved the traditional manual operation process in textile inspection, and promoted the automated process of textile inspection. It greatly improves work efficiency and solves many problems in textile testing technology from a novel perspective. It is a major change in the textile and apparel field.
2.2. Digital Image Filtering Technology
- (1)
Impulse noise model’s mathematical description is as follows:
Among them, n(a, b) and m(a, b), respectively, represent the pixel gray scale value at (a, b) in the original image and the noise image, φ(a, b) represents the distribution of the signal-to-noise ratio, and ld represents the distribution density of the original noise.
- (2)
Gaussian noise model’s mathematical description is as follows:
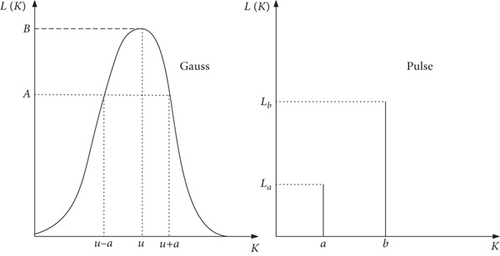
j(m, n) = s(m, n) + t(m, n), where j(m, n) means that the original image function s(m, n) adds the effect of Gaussian noise t(m, n) pollution, as shown in Figure 3.
- (1)
Peak signal-to-noise ratio is mathematically described as follows:
- (2)
Mean square error’s mathematical description is as follows:
- (3)
The relative average absolute error is described mathematically as follows:
- (4)
Normalized mean square error’s mathematical description is as follows:
Usually in image processing, the peak signal-to-noise ratio and the average variance are used as the main indicators for the objective evaluation of the image.
2.3. Digital Image Fuzzy Filtering Algorithm
In the process of digital image processing, the earliest important data processing technique is the traditional filter processing algorithm such as linear filtering algorithm, because it can better deal with Gaussian noise. But once there is an additional noise in the signal processing, the data processing results become more common. Later, some nonlinear filtering algorithms were produced, which organically integrated statistical theory and made great progress. They can control impulse noise more effectively, but the effect of eliminating Gaussian noise is not outstanding. Later, due to the development of fuzzy technology and the deepening of scientific research, many researchers tried to merge the related theories of fuzzy mathematics with conventional filtering algorithms, resulting in several new filtering algorithms.
Due to the introduction of fuzzy technology in the image filter, many researchers have merged the traditional median filter algorithm with the fuzzy technology, resulting in a variety of dim median filter algorithms. Among them, this algorithm does not use the same method for all images. First, the fuzzy method is used to determine the degree of noise pollution of each pixel in the image, and then, the median filter calculation is changed according to the obtained value. The basic idea is as follows:
Among them, m(a, b) represents the gray value of the pixel where the noise image (a, b) is located, M(a, b) represents the gray value of the output image, k(a, b) is the standard output of the traditional median filter algorithm, and s(a, b) represents the severity of the noise in the image. If s(a, b) = 1, it means that the image is completely uncontaminated. If s(a, b) = 0, it means that the image is completely noisy.
- (i)
If s(a, b) is small and t(a, b) is small, then s(a, b) is large
- (ii)
If s(a, b) is small and t(a, b) is large, then s(a, b) is small
- (iii)
If s(a, b) is large and t(a, b) is small, then s(a, b) is small
- (iv)
If s(a, b) is large and t(a, b) is large, then s(a, b) is very large
- (1)
First calculate the fuzzy contrast of pixel m(a, b):
- (2)
Selecting the linear membership function for sa,b calculation in the above formula:
- (3)
Nonlinear transformation of G:
- (4)
Perform median filtering on the ambiguity G`` after convex transformation to obtain the filtered ambiguity G`, and then calculate the adjusted pixel membership through G`:
- (5)
Finally, calculating its corresponding gray value
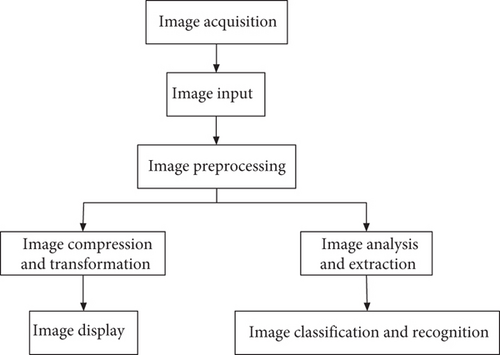
For the actual image processing process, since the image is usually affected by the two kinds of noises, the denoising efficiency cannot be optimized simply by using any filter. If we can find a way to distinguish the images contaminated by impulse noise and Gaussian noise, then choose completely different filtering methods for the images contaminated by various noise environments. In theory, a better filtering effect will be obtained. Therefore, how to design a filtering algorithm to reduce the impact of mixed noise environmental pollution in practice has more practical values. The image processing process is shown in Figure 4
3. Experimental Results of Design Research on Knitted Garment Design Model Based on Mathematical Image Theory
3.1. Drape Performance of Knitted Fabric Garments
The drape of the fabric is an important performance reflecting the beauty of the appearance of the fabric and an important feature of the visual style of the fabric. It is particularly important for skirts. It is an important indicator for evaluating the aesthetics and comfort of the shape and directly affects the appearance of the skirt. The fabric sags due to its own weight in the natural drape state, which can form a soft, smooth, and uniform curvature surface, which is called the drape performance of the fabric. The static drape coefficient is the most common index to express the drape characteristics of the fabric. The smaller the static drape coefficient, the better the drape characteristics of the fabric, and vice versa. However, the static drape coefficient does not fully represent the drape form of the fabric, and most of the clothing worn on the human body are in a state of motion. In recent years, with the deepening of research, more and more attention has been paid to the beauty of the dynamic dress form of clothing, and this problem is more prominent for light and thin fabrics. Considering that the drape form of the fabric is of great significance, the XDP-1 fabric drape performance testing machine can be used to test the dynamic and static drape characteristics of the fabric.
The XDP-1 fabric drape characteristics’ tester is a new type of test instrument designed by Shanghai Xinxian Instrument Equipment Co., Ltd. according to the FZ/T01045-1996 test specification. It uses image processing technology to measure the static and dynamic drape characteristics of the fabric. The structure is precise, and the operation is simple. It only needs to place the sample and use the mouse to control the “up,” “down,” and “test” buttons, and then, the computer can output and print the test results. Applied to the drape performance test of different fabrics, a number of performance indicators can be detected, mainly including the drape basic technical indicators and the drape auxiliary technical indicators. The basic indicators are divided into drape coefficient, wavenumber, average degree of peak amplitude, crest angle balance, and dynamic and static drape coefficient percentages. The auxiliary index is divided into the highest peak amplitude and the least peak amplitude. Among them, the measurement error of the drape coefficient is ≤±1%, which can more comprehensively reflect the drape characteristics of the fabric and help to make an objective evaluation of the wearability of the fabric. Among them, Table 1 and Table 2 are the test results of fabric drape.
| Serial number | Static drape coefficient (%) | Wavenumber (N) | Peak amplitude uniformity (%) | Uniformity of included angle of wave crest (%) | Dynamic drape coefficient ratio | Maximum peak amplitude (mm) | Minimum peak amplitude (mm) |
|---|---|---|---|---|---|---|---|
| Number 1 | 45.02 | 5 | 3.01 | 12.98 | 1.31 | 47.11 | 37.09 |
| Number 2 | 49.79 | 7 | 2.98 | 19.79 | 1.29 | 47.03 | 38.02 |
| Number 3 | 57.89 | 6 | 1.97 | 17.11 | 1.21 | 48.69 | 39.98 |
| Number 4 | 52.01 | 6 | 2.78 | 14.03 | 1.09 | 46.98 | 40.12 |
| Number 5 | 50.99 | 5 | 2.19 | 14.79 | 1.32 | 48.96 | 42.03 |
| Number 6 | 52.05 | 6 | 6.02 | 19.89 | 1.19 | 49.02 | 30.18 |
| Serial number | Static drape coefficient (%) | Wavenumber (N) | Peak amplitude uniformity (%) | Uniformity of included angle of wave crest (%) | Dynamic drape coefficient ratio | Maximum peak amplitude (mm) | Minimum peak amplitude (mm) |
|---|---|---|---|---|---|---|---|
| Number 7 | 51.21 | 6 | 2.71 | 16.19 | 1.24 | 46.99 | 38.79 |
| Number 8 | 44.01 | 6 | 2.59 | 16.49 | 1.41 | 44.02 | 36.02 |
| Number 9 | 50.03 | 6 | 2.68 | 17.61 | 1.31 | 47.03 | 39.23 |
| Number 10 | 49.12 | 6 | 2.72 | 19.02 | 1.34 | 47.69 | 40.41 |
| Number 11 | 41.05 | 6 | 2.49 | 8.98 | 1.39 | 43.98 | 37.02 |
| Number 12 | 51.08 | 6 | 3.31 | 14.59 | 1.23 | 47.95 | 38.21 |
It can be concluded from the statistical principle of static drape coefficient that the smaller the static drape coefficient, the better the drape characteristics of the fabric, and vice versa. According to the fabric drape test results in Table 1 and Table 2, it can be known that the static drape coefficient of fabric no. 3 is the highest, but the drape is poor, and the fabric is relatively stiff, which is not consistent with the drape projection shape. The static drape coefficient of no. 11 fabric is very small, the drape performance is good, the fabric is delicate, and the drape projection shape is uniform and natural. The comparison diagram of the two drape shapes is shown in Figure 5. The wave function reflects the number of bending of the fabric in the free drape state and is one of the key parameters of the drape shape. Since the selected fabrics are light and thin woolen fabrics, there is a little difference in fabric characteristics. Knowing from the above discussion, the pendant wavenumber range of the selected sample is about 5-7. Among them, fabric no. 1 has the least number of dangling waves, which is five, while fabric no. 2 has the most dangling waves, which is seven. Technical indicators such as uniformity of wave crest amplitude and uniformity of included angle of wave crests show the drape form of the fabric in different viewing angles.

3.2. Design of Knitted Garments Based on Mathematical Iconography
The progress of computer and graphic information technology has laid a good foundation for obtaining objective measurement indicators of modern clothing modeling and created many effective methods, such as 3D scanning technology, computer simulation technology, and image processing technology. Clothing modeling includes external contour modeling and internal shape. We focus on the classification of the external contour shape of miniskirts. The objective shape evaluation index of clothing is refined through image processing technology, so first of all, it is necessary to expand the picture collection of the outer shape of the miniskirt.
Image acquisition technology is a key issue in image processing. The quality of image acquisition technology directly determines the quality of image levels and variable characteristic values. This article mainly uses photography to collect pictures on the outer shape of the miniskirt and requires that photography should be started when the indoor and outdoor natural light conditions are sufficient and the temperature is relatively stable; before each shooting, put the miniskirt on the human platform. After positioning the human platform, it rotates three times in the clockwise and counterclockwise directions of the hands, and after standing for about 3-5 minutes, all the skirts are attached to the human platform under the condition of automatic hanging and no dead ends, and the distance between the camera and the human platform is kept constant. The control parameters of the camera are kept unchanged at a fixed time parameter value, so as to avoid the deviation of the image collection of the appearance shape of the skirt caused by human factors and avoid the negative impact on the objective evaluation of the miniskirt. The shooting angle mainly includes the front, side, and bottom of the skirt. When shooting the bottom, the platform should be placed vertically and hung together, and the photo should be taken from directly below the platform.
The standard deviation of crest radius, the standard deviation of trough radius, the standard deviation of crest included angle, and the standard deviation of trough angle selected in this article all consider the uniformity of related indexes from a mathematical point of view. The smaller the value of the standard deviation, the less obvious the change of its related index, which can indicate that the amplitude of the wave crest or trough radius and the wave crest or trough angle is smaller. This means that the more uniform the wave shape of the miniskirt is, the more beautiful the outer shape of the skirt. On the contrary, the more uneven the wave shape, the less beautiful the outer shape of the skirt. The test method is the formula calculation method that comes with the Excel spreadsheet, and the calculation results are shown in Table 3.
| Serial number | Standard deviation of crest radius | Standard deviation of trough radius | Standard deviation of crest angle | Standard deviation of valley angle |
|---|---|---|---|---|
| Number 1 | 1.59 | 1.98 | 12.09 | 12.61 |
| Number 2 | 1.58 | 1.58 | 5.82 | 8.31 |
| Number 3 | 0.98 | 1.69 | 9.76 | 9.89 |
| Number 4 | 1.79 | 2.08 | 8.21 | 10.43 |
| Number 5 | 1.78 | 2.18 | 9.81 | 13.89 |
| Number 6 | 1.19 | 1.87 | 10.02 | 11.78 |
| Number 7 | 1.23 | 1.68 | 13.01 | 12.98 |
| Number 8 | 1.51 | 1.82 | 11.39 | 12.69 |
| Number 9 | 1.82 | 1.92 | 11.98 | 12.79 |
| Number 10 | 1.64 | 1.68 | 10.02 | 16.02 |
| Number 11 | 1.38 | 1.79 | 9.42 | 10.89 |
| Number 12 | 1.73 | 1.58 | 8.02 | 11.99 |
3.3. Knitwear Pressure Performance Test Analysis
With the continuous deepening of clothing pressure research, the research results related to the current stage of clothing pressure not only involve professional research results related to clothing fabrics but also involve other professional research content such as medical and health, sports science, and psychology. In the process of product design and manufacturing of clothing, not only the influence of wearing pressure is fully considered but also certain medical and health care wearing pressure functions and sports comfort are considered. And according to the most comfortable value of wearing pressure in various parts of the body, making the most optimal wearing pressure setting will greatly improve the wearing performance of the clothing, thereby enhancing the overall competitiveness of the apparel industry. On the basis of the stress test system, we conducted an in-depth study on the clothing pressure changes of traditional knitted apparel and proposed the law of the air pressure distribution change of the upper body of the male human body under specific conditions. The novel pliance-x-32 clothing pressure measurement system is used to achieve clothing pressure measurement, which can grasp the objective measurement method of clothing pressure, the distribution of clothing pressure on parts of the human body, and the comfort characteristics of clothing pressure on the human body. At the same time, the novel pliance-x-32 pressure measurement system is used for objective clothing pressure measurement of the human body. The measurement preparation requirements are consistent with those of the FlexiForce sensor pressure measurement system. It is compared with the average value of the clothing air pressure of different parts of the upper body of the male human body obtained by the two pressure measurement systems, and the law of the distribution of the air pressure of the upper body of the male human body under certain conditions is obtained.
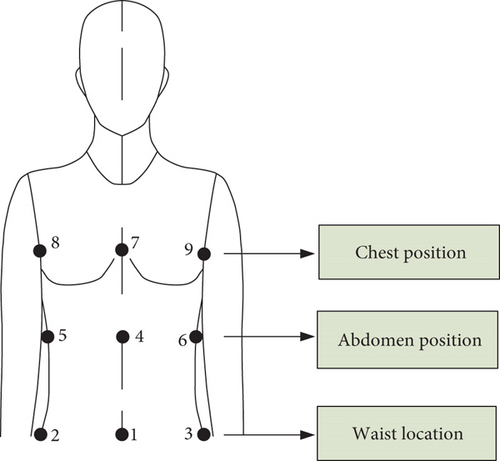
The clothing used in the measurement in this paper is mainly knitted seamless underwear, which is more in the market. The clothing fabric is mainly composed of cotton and ammonia, and certain physical properties of the clothing fabric have been tested. The fabric organization of the clothing mainly uses plain weave, rib weave, and mesh organization, and the fabric composition is 92% cotton and 8% spandex. The measurement position of clothing pressure mainly chooses the upper body of male human body, mainly chooses the position with relatively large pressure value, and selects 9 test positions for clothing pressure as shown in Table 4. The measurement positions are indicated by 1, 2, 3, 4, 5, 6, 7, 8, and 9, respectively.
| Numbering | Human body position | Numbering | Human body position | Numbering | Human body position |
|---|---|---|---|---|---|
| 1 | Front center of the waist | 4 | Center of the anterior abdominal wall | 7 | Mid-chest position |
| 2 | Left side of the waist | 5 | Left position of the anterior abdominal wall | 8 | Left side of the chest |
| 3 | Right side of the waist | 6 | Right position of the anterior abdominal wall | 9 | Right side of the chest |
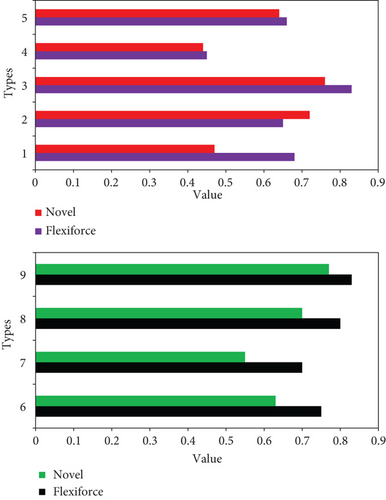
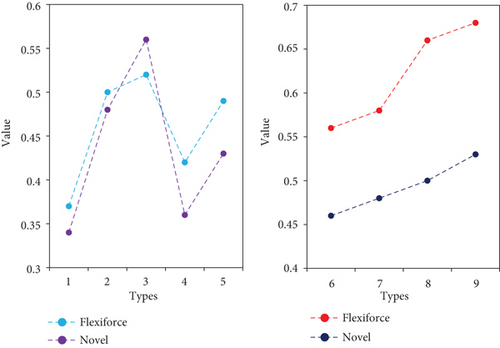
Of the 9 selected points, points 1, 2, and 3 are on the waist and are on the same horizontal line; points 4, 5, and 6 are on the abdomen, and the three points are on the same horizontal line; points 7, 8, and 9 are on the same horizontal plane of the chest, and the distribution is shown in Figure 6.
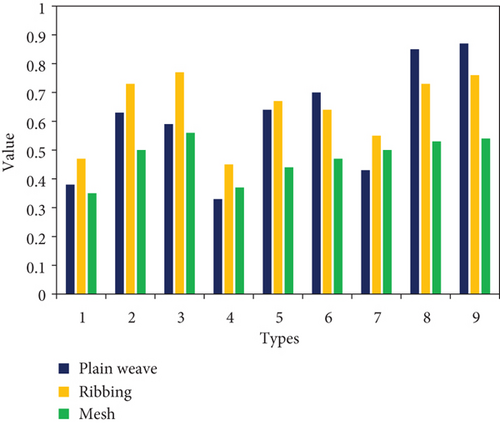
Novel pliance-x-32 test system records clothing pressure data every 0.1 s during the measurement process, and the data of each part is measured for 30 s, and the measurement is kept standing, and the measurement results are saved in word form. The saved result has a total of 60 sets of data, except the highest value and the lowest value, and the average remaining pressure value is the measured value. The clothing pressure value of each measurement point is the average value of 5 testers at the test point, and the measurement result is shown in Figure 7. The measurement locations are represented by locations 1, 2, 3, 4, 5, 6, 7, 8, and 9.
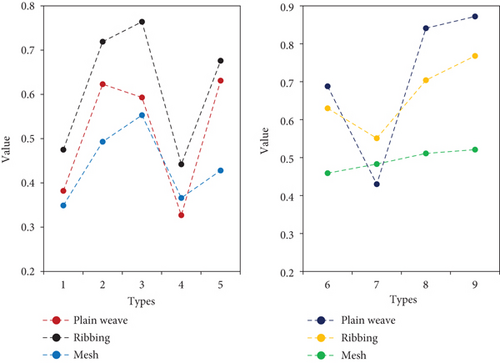
The average pressure value measured at each location is shown in Figure 8. Although the clothing pressure value tested by the novel pliance-x-32 test system is different at each location, the pressure distribution law is basically the same as the law obtained above. It can be seen from Figure 8 that, in general, the compression value of the clothes in the middle of the human body is generally smaller than that of the clothes on both sides. However, the compression value of the clothes formed by the rib weave on all parts of the human body exceeds the compression value of the clothes formed by the plain weave fabric. In the areas on both sides of the human chest, the clothes formed by the plain weave fabric are most stressed, and the clothes formed by the mesh tissue are usually relatively small.
- (1)
The pressure comparison of the test system under plain weave fabrics is shown in Figure 9
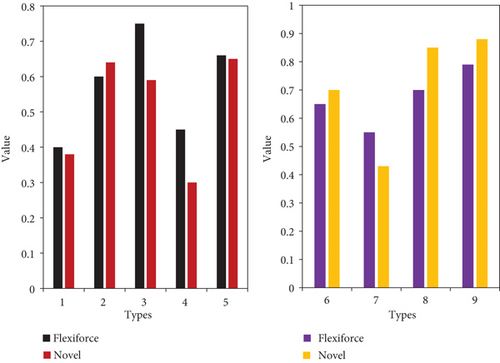
Through the correlation analysis of the two sets of data, the correlation of the measured data of the two systems as shown in Table 5 can be obtained.
| Position (1-9) | FlexiForce | Novel | |
|---|---|---|---|
| Position (1-9) | 1 | — | — |
| FlexiForce | 0.55783 | 1 | — |
| Novel | 0.62987 | 0.87328 | 1 |
- (2)
The pressure comparison of the test system under the rib weave garment fabric is shown in Figure 10.
Through the correlation analysis of the two sets of data, the correlation of the measured data of the two systems as shown in Table 6 can be obtained.
| Position (1-9) | FlexiForce | Novel | |
|---|---|---|---|
| Position (1-9) | 1 | — | — |
| FlexiForce | 0.379821 | 1 | — |
| Novel | 0.3298453 | 0.779832 | 1 |
- (3)
The pressure comparison of the test system under mesh fabrics is shown in Figure 11.
Through the correlation analysis of the two sets of data, the correlation of the measured data of the two systems as shown in Table 7 can be obtained.
| Position (1-9) | FlexiForce | Novel | |
|---|---|---|---|
| Position (1-9) | 1 | — | — |
| FlexiForce | 0.893216 | 1 | — |
| Novel | 0.449762 | 0.780213 | 1 |
It can be obtained from Table 7 that in the clothing pressure measurement process of the mesh fabric, the correlation of the data measured by the two pressure measurement systems is 0.780213.
4. Discussion
Reasonable clothing pressure will also have a positive effect on human physiological health care. Therefore, the study of clothing pressure has increasingly become a major issue in the clothing industry. Under the influence of a certain degree of clothing pressure, it is an important reason for maintaining human physical and mental health and improving the quality of life. The fast and accurate objective measurement of clothing pressure is of great significance to the scientific research of clothing pressure, and it is also a key subject of the current scientific research of clothing pressure. In the analysis of the pressure performance measurement system for knitted garments, under the plain weave fabric, in the novel pliance-x-32 pressure measuring system and the FlexiForce pressure measuring system, the data correlation of the clothing pressure measured on different conditions of the upper body is 0.87328. Under the rib-woven garment fabric, the novel pliance-x-32 air pressure measurement system and the FlexiForce air pressure measurement system are on different parts of the upper body, and the data correlation of the measured clothing pressure is 0.779832. Under mesh fabrics, the novel pliance-x-32 air pressure measurement system and FlexiForce air pressure measurement system are on different parts of the upper body, and the data correlation of the measured clothing pressure is 0.780213. The results show that under the pressure of this degree of knitted garments, it is in line with people’s healthy growth needs.
5. Conclusions
Taking into account the drape characteristics of the fabric as the main aspect that affects the beauty of the fabric, it also has a very important impact on the outer shape of the miniskirt. Therefore, this paper selects XDP-1 fabric that can express the drape characteristics of the fabric from a variety of perspectives, and the dynamic and static drape characteristics’ tester detects the drape characteristics of the sample. The main measurement indicators are divided into dynamic and static drape coefficient, wavenumber, peak amplitude balance, peak angle balance, dynamic and static drape coefficient ratio, highest peak amplitude, and minimum peak amplitude, and the test results are recorded in a standardized manner. Using the camera method to collect pictures of the appearance of the miniskirt, the appearance of the miniskirt is converted into a digital image value and then use the comparative research data analysis results of the literature and select the corresponding objective evaluation index of the styling characteristics on the front, side, middle, and bottom of the miniskirt in turn. From a mathematical point of view, the calculation formulas of each index are determined, and these indexes are digitally extracted using image processing. With the improvement of people’s living standards, people are paying more and more attention to the personalized and fashionable dress. The application of unconventional pleats, drape, exaggeration, and other design techniques has increased the fun and fashion of clothing modeling; at the same time, complex and simple styles of clothing coexist with diversification. Therefore, the use of modern technology such as digital image processing to study the relationship between the mechanical properties of fabrics and unconventional clothing styles and diversified styles can also be used as a future research direction.
Conflicts of Interest
The author declares no conflicts of interest.
Acknowledgments
This research study is sponsored by “Textile light” research project on higher education teaching reform of China Textile Industry Federation. The name of the project is Research on the Construction of Fashion Design Courses in the Context of “New Liberal Arts.” The project number is 2021BKJGLX471. Thanks are due to the project for supporting this article!
Open Research
Data Availability
The data used to support the findings of this study are available from the corresponding author upon request.


