[Retracted] Construction of Intelligent Building Integrated Evaluation System Based on BIM Technology
Abstract
In order to alleviate the impact of the old bridge by the environment and its own life and the problem of increasing maintenance cost, the intelligent building integrated evaluation system based on BIM technology is proposed. Firstly, based on BIM technology, an all-weather hardware monitoring system is constructed by using multiple sensors laid on the bridge. The software communicates with the monitoring system through 5G public network and applies the unique advantages of deep neural network in classification to the assessment of the health status of old bridges with the help of the multiclassification convolutional neural network embedded in the software. The test results show that the preprocessed data is imported into the health diagnosis module for training, and the training accuracy reaches about 70%, and the loss curve is stable at about 0.5. Conclusion. The system meets the design requirements and solves the problem of difficult health diagnosis caused by long monitoring period and low efficiency of old bridges. The system has advantages of low difficulty in obtaining parameters, high precision, and accurate health assessment.
1. Introduction
At present, the number of highway bridges in China has exceeded 800,000. Many bridges built since the 1960s have reached the design service life and began to gradually aging. Considering the deviation of engineering construction, the effect of natural environment, and the improper operation and use of the later period, the bridge structure will appear various diseases. The accumulation of these diseases to a certain extent will affect the overall appearance of the bridge, lead to the decline of bridge bearing capacity, and seriously affect the safety, applicability, and durability of the bridge structure. In recent years, accidents such as collapse and overturning of bridge structures caused by vehicle overload and adverse environment have occurred frequently [1]. As an important part of bridge structure operation and maintenance, bridge inspection plays an indispensable role in the analysis and evaluation of bridge structure bearing capacity. Regular bridge inspection can provide reliable decision-making basis for bridge maintenance and repair and effectively avoid accidents caused by bridge structural diseases [2].
Traditional bridge inspection includes appearance inspection, technical inspection, and static load test. Appearance inspection and technical inspection collect bridge structure geometry, structure, and disease information by visual inspection, camera and other manpower, and mechanical equipment combination, to calculate the degree of bridge damage and evaluate the technical status of the bridge; the static load test is to evaluate the bearing capacity of the bridge structure by comparing the response values of the bridge structure with the design theoretical values by applying test load to the bridge structure. However, there are many disadvantages in the information management of traditional bridge inspection. Building Information Modeling (BIM) technology has been paid more and more attention by the engineering construction industry. BIM technology rises in the construction engineering industry, aiming to improve labor productivity in the lagging and inefficient production links of the construction engineering industry [3]. BIM technology can provide efficient management solutions; BIM technology as a bridge life cycle management tool is also the trend.
2. Literature Review
Wernerová et al. summarized the use of comprehensive analysis and experimental analysis to carry out a comprehensive assessment of bridge condition. Through nondestructive and destructive tests and structural identification of 7 actual bridge samples, the bridge state assessment and reliability assessment techniques are described [4]. Mmk et al. introduced the use of computer expert systems to establish bridge maintenance expert systems to analyze and evaluate existing small and medium-sized highway bridges [5]. Abdelkarim et al. use expert system CLIPS to establish the overall evaluation program of bridges and put forward the fuzzy weighted vector method, that is, the weight of indexes is obtained by pairwise comparison matrix. Weak segmentation and fuzzy addition are used to obtain the fuzzy weight vector of the corresponding evaluation subset, which improves the stability of the final evaluation results, supports the dispersion of the evaluation results of the inspectors, and overcomes the sensitivity of some monitors’ inaccurate detection results [6]. Rodriguez et al. believe that the bridge management system should have the function of bridge state assessment and uses machine learning to establish the concrete Bridge Grade Assessment Expert System (BREX), whose goal is to evaluate the state performance of the bridge structure under many factors, such as bearing capacity and durability [7]. According to the structural characteristics and defect characteristics of the bridge, Wang et al. proposed the monitoring content and rating standard of the defect condition of the bridge components, introduced the bridge defect condition index BCI as the indicator of the bridge defect condition, established the calculation model of BCI, and calibrated the parameters of the model by combining subjective and objective methods [8]. Based on the consultation of dozens of bridge experts and a lot of investigation and research, B et al. collected the expert knowledge of bridge evaluation and proposed to measure the damage degree of bridge structure or component by the damage degree. In addition, the fuzzy comprehensive evaluation system of bridge service performance is established by using the principle of fuzzy mathematics, and the bridge evaluation expert system is explored and established [9]. Shen et al. systematically introduced the status quo of existing bridges and the development of bridge evaluation, systematically proposed the basic characteristics of bridge evaluation, analyzed the relationship between bridge evaluation, design, and management, and preliminarily discussed the main characteristics of evaluation specifications [10]. Bejarano-Luque et al. use the analytic hierarchy process (AHP) to put forward the index system of safety and durability evaluation and the method of weight determination of steel-reinforced concrete composite girder cable-stayed bridge. According to the principle of fuzzy comprehensive evaluation, the comprehensive evaluation method is discussed, and the evaluation algorithm of bridge safety and durability is recommended [11].
In this essay, a bridge remote structure comprehensive parameter acquisition and intelligent evaluation software is designed, and the service environment and operation load of the bridge are obtained by comprehensively using the sensors laid in the key parts of the bridge structure. The software generates a multiclassification network model that can be applied to most of the old bridges by deep learning training, to realize the state and safety performance evaluation of the bridge structure, which solves the problems of long monitoring period, low efficiency, and difficult health evaluation of the old bridges. It has the advantages of convenient parameter acquisition, high precision, and accurate health evaluation.
3. The Research Methods
3.1. BIM Technology
BIM stands for Building Information Modeling. BIM digital model has both physical and functional characteristics, running through the whole life cycle of construction projects, so that all links of such projects in planning, construction and so on can achieve the purpose of reducing resource consumption, reducing costs, and improving benefits.
The 3D model created by using BIM related software can obtain intuitive 3D coordinated effect diagram before construction and clearly point out the defects and problems existing in the design. In actual construction, conflicts between structure and pipeline, asymmetry, or omission of reserved holes may occur. With the help of BIM technology, construction schemes lacking rationality can be adjusted [12]. Using BIM technology to conduct construction simulation on the basis of creating a model is a process of transforming the past transverse chart into a 3D model, so as to better arrange and adjust the schedule of construction before starting the construction operation. By using the engineering rules in the software, the attributes between components in the project are intelligently identified. The overall rationality check of the project enables us to find out the omissions and collisions in the architectural design before entering the construction stage.
3.2. Overall Design Scheme
The monitoring system mainly includes hardware monitoring system and control terminal. The hardware monitoring system is mainly responsible for receiving and parsing the instructions from the control terminal and completing data acquisition and transmission. The control terminal mainly realizes the functions of communication, data processing, health monitoring, and evaluation with hardware monitoring system. The hardware monitoring system communicates with the control terminal strictly according to TCP/IP protocol through WIFI+5G data transmission.
3.3. Hardware Monitoring System Design Scheme
The hardware monitoring system mainly includes data acquisition and storage module, sensor module, and wireless communication module. The hardware monitoring system uses THE STM32H743 high-performance microcontroller of ST Company as the main control chip and combines the MEMS acceleration sensor, temperature and humidity sensor, strain sensor, and other sensors to construct the multiparameter monitoring node of the bridge. The Beidou positioning system is used to mark the sensor node and monitor the position of the bridge segment. Through DMA transmission, the data collected by the above sensors are stored in external SDRAM, and then, the ultraremote communication link is formed by WIFI+5G, and the sensor monitoring node and terminal server are constructed into a heterogeneous transregional health monitoring network. This hardware monitoring system integrates distributed transregional network transmission technology and multisensor fusion technology and has the characteristics of long communication distance, good network quality, high transmission rate, and wireless long-distance data transmission under the condition of ensuring communication quality [13]. The functions of each part are shown in Figure 1.

3.4. Software Design Scheme
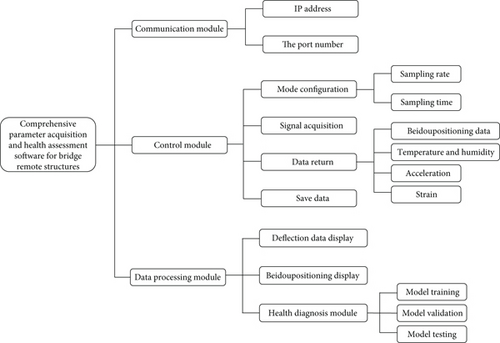
Qt is a set of cross-platform C++ development library, which encapsulates a large number of tool libraries; Qt is highly modular and reusable. The development and configuration of programs are not restricted by platform. Qt’s unique signal and slot mechanisms also facilitate program development. Therefore, this software is developed based on Qt5.9. The software function module mainly includes three modules, namely, communication module, control module, and data processing module.
The control terminal is located in the remote side of the operation, mainly composed of computers and software. The software converts the parameters collected by the hardware monitoring system into the information of bridge deflection, environment, and frequency. Meanwhile, the multiclassification network model of lightweight bridge monitoring and evaluation is embedded into the software. Through this network model, the bridge health status can be quickly evaluated. When the bridge loss occurs, the test node will send alarm signal to the monitoring terminal. And by the monitoring terminal for secondary accurate diagnosis, to improve the efficiency of bridge health monitoring, the system function block diagram of the comprehensive parameter acquisition and intelligent evaluation software for the remote structure of the bridge is shown in Figure 2.
3.5. Communication Module Design
Common communication protocols include TCP/IP and UDP. Because of the large amount of data collected by sensors in bridge test system and the complexity of data type, the module is the premise of normal interaction between software and hardware. The stability of communication links also directly affects the quality of interaction. At the same time, the reliability of the communication process also requires that the design of the module needs a high stability. If the communication protocol of the software uses UDP protocol, the above requirements cannot be guaranteed. Therefore, the software chooses the relatively reliable, byte-based TCP/IP protocol to communicate with the hardware monitoring system.
Qt encapsulates the traditional TCP/IP protocol, making it more convenient to use TCP/IP. Basic functions such as creating a TCP server and adding or deleting multiple clients are implemented through Qt’s QTcpServer class. Control instructions are issued through TCP/IP protocol to interact with the hardware monitoring system, and the sampling rate and sampling time are set to read the client data [14]. At the same time, the module also has the function of detecting the client connection state. When the client connection state is unstable, or there is an interruption, the software will have the corresponding warning information to prompt the operator. During communication, the software delivers the self-check command every 5 s to self-check the communication link to ensure the stability of the communication link and prevent the command delivery and data receiving failure caused by link interruption. If the link is interrupted, the current operation is stopped and the hardware monitoring system resends the handshake signal of the link request. Functions of the communication module are shown in Figure 3.

3.6. Control Module Design
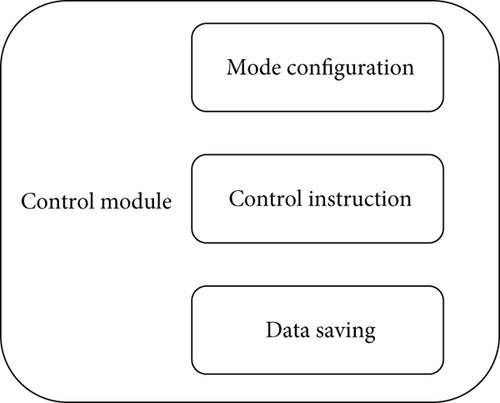
As shown in Figure 4, the design of this part is mainly to deliver corresponding instructions to the hardware system and control the hardware monitoring system to perform corresponding operations. The control module is an important part of the whole software design, which ensures that the hardware can work normally according to the established functions when the instruction is delivered correctly. The main functions of the control module include the following aspects: mode configuration, control instructions, and data storage.
3.6.1. Mode Configuration
- (1)
The sampling rates are 1 MHz, 512 kHz, 256 kHz, 128 kHz, and 100 kHz
- (2)
The sampling durations are 2 s, 1.5 s, 1 s, and 0.5 s. The sampling rate and sampling time are delivered through the combination of check boxes and buttons. After selecting the appropriate sampling rate and sampling duration, click the button to send the corresponding instruction to the monitoring system in the format of an eight-digit hexadecimal number [15]. The corresponding relationship between sampling rate, sampling duration, and instruction delivery is shown in Table 1
| Sampling rate sampling time/s | 1 MHz | 512 kHz | 256 kHz | 128 kHz | 100 kHz |
|---|---|---|---|---|---|
| 2 | 01 | 02 | 03 | 04 | 05 |
| 1.5 | 06 | 07 | 08 | 09 | 10 |
| 1 | 11 | 12 | 13 | 14 | 15 |
| 0.5 | 16 | 17 | 18 | 19 | 20 |
3.6.2. Control Function
This part is mainly to realize the acquisition and data transmission instruction. Put different QPushButton controls in the interface, and add corresponding instructions in each control. The instruction format is also an eight-digit hexadecimal number. After receiving the corresponding instructions, the hardware monitoring system will parse the corresponding characters according to the instructions and then perform the corresponding operations according to the obtained characters [16]. Set the QProcessBar control to display the corresponding data return progress, and set the QTextEdit control to store the data return. Table 2 lists the corresponding operation functions.
| Instruction | B0 | B1 | B2 | B3 | B4 | B5 | B6 |
|---|---|---|---|---|---|---|---|
| Functions | Start collecting | Acceleration data | Strain gauge data | Temperature and humidity data | Beidou data | ||
| Channel 1 | Channel 2 | Channel 3 | |||||
3.6.3. Data Preservation
- (1)
Data types received by the software include two types: octet hexadecimal data collected by acceleration sensor and strain sensor and character data collected by temperature and humidity sensor and Beidou positioning module, etc. Place the Qpush-button control to select the path to save the data. Select a proper storage mode based on different data formats. For example, the 8-bit hexadecimal data is saved in the binary BAT file format, and the character data is saved in the TXT file format
- (2)
The function of using log is mainly designed to facilitate the optimization and upgrade of software in the later stage and also to facilitate the use and maintenance of software by operators, so as to reduce unnecessary hidden dangers caused by operational errors and reduce the risk of data loss [17]. Software usage logs are automatically generated on the software background, and no operation is required. Usage logs include software operation processes and error messages

3.7. Data Processing Module Design
3.7.1. Deflection Data Display
QCustomPlot is an open source project based on the LGPL copyright agreement implemented under the Qt framework. It does not need further library dependence, has rich documents and is easy to use, and can mainly draw two-dimensional curves and visualize data, including graph, trend graph, coordinate graph, and bar graph [18]. Because Qt’s QChart library has low operation efficiency when drawing waveforms with large data volume, it cannot meet the requirements of complex large data volume processing in bridge monitoring. Therefore, the QCustomPlot library is used to draw waveform diagrams of deflection and other data.
In Formula (1), Ni(x) is the deformation data collected by strain gauges laid at different positions of the bridge, Xi is the amplitude of the bearing force at this position, and m is the number of deformation values collected.
3.7.2. Beidou Positioning Data Display
By unpacking the Beidou positioning data stored in 3.5.3, the location information of the hardware monitoring system, including the CLIENT IP address, longitude, latitude, UTC time, and collection date, is obtained. Create a QTableView control to add this information in turn to the table. At the same time, create QAxWidget control, load HTML file in the control, call Baidu offline map API interface to add longitude and latitude information obtained by unpacking to the map, and mark them in the map.
Baidu map can be convenient to view the location of the layout points, while using Baidu map display will be more intuitive and clear than the display effect of the table. The offline Baidu map will reduce the software’s dependence on the network and improve the application scenarios of the software.
3.8. Design of Health Diagnosis Module
This part mainly designs a multiclassification bridge health state recognition network based on shift convolution. The shift convolution operation and light point convolution are used to reduce the complexity of calculation, and the shift convolution operation provides flexible sensory field for time series, improves the accuracy of bridge identification, and thus completes the diagnosis of bridge health. When the diagnosis result is poorer, poor, or dangerous, the operator will be warned, and the software will make a second accurate diagnosis, thus improving the efficiency of bridge health monitoring.
3.8.1. Data Preprocessing
Twelve groups of sensors are used to collect the health status information of the bridge, and each group of sensors includes displacement, velocity, and acceleration information. The size of a single sample is 250000 × 3 × 12 (time length ∗ number of characteristic channels ∗ number of sensor groups). According to the Code for Maintenance of Highway Bridges and Culvert (JTG H11-2004), bridge health and bridge damage are divided into 5 grades (good, better, poor, bad, and dangerous), with 2000 samples for each grade and a total of 10000 samples. The evaluation standard of bridge strength is shown in Table 3.
| kbt | kbm | Intensity conditions |
|---|---|---|
| ≥0.95 | ≥1.00 | Good |
| 0.95 > kbt ≥ 0.90 | 1.00 > kbm ≥ 0.95 | Better |
| 0.90 > kbt ≥ 0.80 | 0.95 > kbm ≥ 0.90 | Poor |
| 0.80 > kbt ≥ 0.75 | 0.90 > kbm ≥ 0.85 | Bad |
| <0.75 | <0.85 | Dangerous |
3.8.2. Bridge Health Status Identification Network
The bridge health status recognition network layer consists of a shifted convolution layer, a global average pooling layer, and a softmax activation layer. The depth feature information of bridge health is firstly convolution by point element, then global average pooling, and finally processed by softmax activation function to output the prediction results of bridge health state. Its network structure is shown in Figure 6.

The size of the bridge health depth characteristic information is 16 × 128, and the size of the output characteristic graph is 16 × 5 after the convolution operation with the step size of 1, which is 3 × 1 × 5 (convolution kernel size × the number of convolution kernels × the number of convolution kernels). After global average pooling, the final output size is 5. After softmax activation layer, the final output of bridge health state prediction is realized, that is, multiclassification prediction of bridge health state [19].
3.8.3. Shifted Convolution Layer
The specific structure of the shifted convolution layer is shown in Figure 7. First, the input tensor is shifted to reallocate spatial information. Then, point by point convolution processing is carried out to realize cross-channel mixing information. There are batch normalization and nonlinear activation function (ReLU) before point-by-point convolution. When the input and output shapes are different, the input is evenly pooled and convolved, and the input and output feature information is fused by means of residual connection.

The conventional spatial convolution is replaced by shift operation and point by point convolution. Among them, the shift operation realizes no parameter operation and achieves the purpose of network lightweight.
The input data first goes through a shift operation, which constructs the convolution kernel as a shift matrix to shift the input data in different directions in different channels.
In Equation (6), the value of a certain position is specified as 1 in the shifted convolution kernel, and the other positions are all 0. After convolution, the original channel is translated.
4. Results Analysis
4.1. Hardware Monitoring System Layout
In Taiyuan Longcheng Bridge, a test area with a length of about 60 m was selected, and a hardware monitoring system was laid every 10 m. As a large number of sensors are needed to monitor each node of the bridge, the layout of the hardware monitoring system in the figure is only one of them. During the field test, the hardware monitoring system is glued to the deck of the bridge under test. Set the sampling rate of the hardware monitoring system to 1 MHz and the sampling time to 2 s.
4.2. Software Simulation Test Steps
- (1)
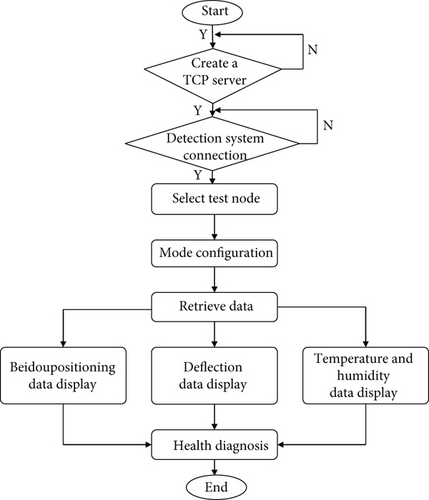
Fill in the appropriate IP address and port number, select “TCP mode,” create a TCP server, power on the hardware monitoring system, and wait for the connection between the hardware monitoring system and the software
- (2)
Select the client to be tested, and select the appropriate sampling rate and sampling time. Click the “Mode Configuration” button in the main control interface, and the software will issue instructions to configure the sampling rate and sampling time
- (3)
Click the “Start collection” button and wait for the hardware monitoring system to collect the acceleration data, strain data, Beidou positioning data and temperature and humidity data required by the bridge health monitoring
- (4)
Click the buttons of “Data Transfer,” “Strain Gauge,” “Location Information,” and “temperature and humidity” to send back the data collected in step 3, respectively. A progress bar will be displayed during the transfer process. Click “Save Data” button to select an appropriate path and data format to save data [20]
- (5)
Click the “Comprehensive Parameter Collection” button to perform steps 3 and 4 at one time to save operation steps
- (6)
Select the monitoring time (hour) drop-down list box and wait for the corresponding time to perform steps 3 and 4. This step can be repeated automatically when the corresponding time is reached. After the operation of this step, the purpose of regular monitoring can be achieved, and it is convenient to monitor the bridge for a long time
4.3. Analysis of Software Simulation Results
Follow the test steps in 4.2 to actually test the software. In the testing process, the software runs stably, and it is convenient and flexible to use with the hardware monitoring system, which preliminarily meets the requirements of software design.
Click the “Show Location” button to split the saved Beidou location data according to different client IP addresses, obtain the longitude, latitude, UTC time, and date of each node, and display these data in a table on the node location page. At the same time, Baidu map API is called to convert latitude and longitude into coordinates in the map and marked in the map. From the map, it can be seen that the actual location of the hardware monitoring system is consistent with the preset location.
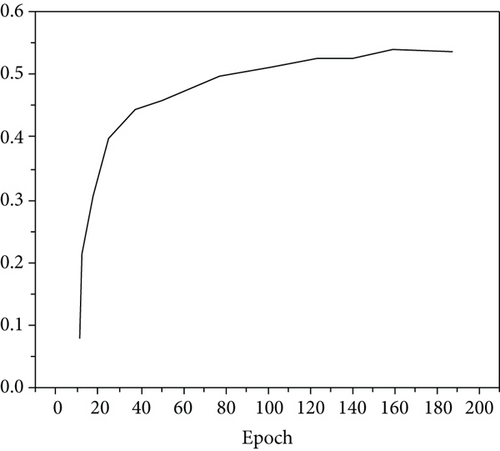
Through the data processing module, the acceleration and strain data collected by the hardware monitoring system are calculated and processed. According to formulas (1) and (2), the bridge deflection in the test area is calculated, and the waveform is drawn. After that, the preprocessed data were imported into the health diagnosis module for training, and the training accuracy and loss curve were obtained as shown in Figure 9. It can be seen that the training accuracy reached about 70%, and the loss curve was stable at about 0.5. After saving the trained network model, a new set of test areas were set up at different locations on the bridge. Then, steps 3 and 4 in the above test process were repeated, and the collected data were preprocessed and imported into the trained model for testing to obtain the health diagnosis results of the bridge [21].
In the actual testing process, some design deficiencies are also found. For example, the hardware monitoring system adopts the way of WIFI+5G to form superremote communication link, but 5G has not achieved full coverage so far, so the use of the hardware monitoring system will be limited. After the software is connected to a large number of clients, the communication link will be congested when the surrounding environment conditions are complex. When the background automatically saves the use log, there will be a lag phenomenon. When the software calls the health diagnosis module, it needs to carry out a lot of calculation, so there is also the situation of lag, and there is room for optimization of the training accuracy and loss degree of the health diagnosis module [22, 23].
The measured signals are shown in Figure 10, and the displacement characteristics of the bridge can be extracted from the time domain after adaptive filtering of the collected acceleration signals. The displacement signal can be obtained by the quadratic integration of the initial collected acceleration signal [24, 25].
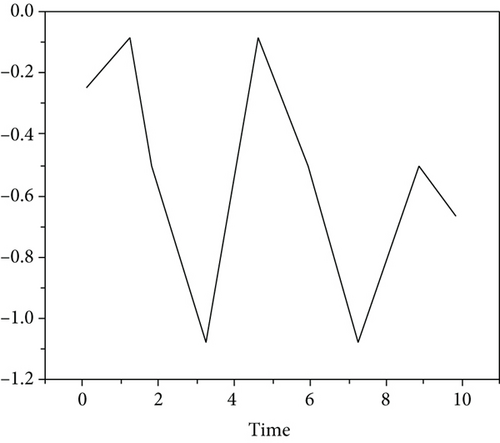
The deflection changes are shown in Table 4 and Table 5. After the test, the system completes the data collection and transmission well, and the deflection parameters are all within the range of the safety threshold, and the data between the measurement points have a good correlation.
| a/(m · s−2) | V/(m · s−1) | Deflection/m | t/s |
|---|---|---|---|
| 0.007506 | −1.441 × 10⁻⁷ | 4.808 × 10⁻⁸ | 1 |
| 1.17 × 10⁻⁵ | −6.004 × 10⁻⁶ | −8.028 × 10⁻⁸ | 2 |
| -0.000575 | −1.218 × 10⁻⁵ | −1.029 × 10⁻⁶ | 3 |
| -0.002942 | −1.113 × 10⁻⁵ | −2.111 × 10⁻⁶ | 4 |
| −3.63 × 10⁻⁷ | 8.594 × 10⁻⁷ | −2.67 × 10⁻⁶ | 5 |
| 4.49 × 10⁻⁵ | −7.036 × 10⁻⁶ | −3.06 × 10⁻⁶ | 6 |
| 1.31 × 10⁻⁵ | −9.745 × 10⁻⁶ | −3.779 × 10⁻⁶ | 7 |
| −5.33 × 10⁻⁵ | −9.367 × 10⁻⁶ | −4.567 × 10⁻⁶ | 8 |
| -0.000103 | −4.2 × 10⁻⁶ | −5.12 × 10⁻⁶ | 9 |
| 0.000365 | −7.149 × 10⁻⁶ | −5.794 × 10⁻⁶ | 10 |
| a/(m · s−2) | V/(m · s−1) | Deflection/m | t/s |
|---|---|---|---|
| 0.0002181 | −5.92 × 10⁻⁷ | −7.59 × 10⁻⁸ | 1 |
| -0.001401 | −4.795 × 10⁻⁶ | −3.173 × 10⁻⁷ | 2 |
| -0.000605 | −1.666 × 10⁻⁷ | −4.091 × 10⁻⁷ | 3 |
| 0.0003808 | 6.811 × 10⁻⁸ | −5.447 × 10⁻⁷ | 4 |
| -0.000197 | −6.192 × 10⁻⁶ | −5.842 × 10⁻⁷ | 5 |
| 0.0003281 | −9.386 × 10⁻⁶ | −1.288 × 10⁻⁶ | 6 |
| -0.003689 | −4.413 × 10⁻⁶ | −1.597 × 10⁻⁶ | 7 |
| 0.001922 | −7.743 × 10⁻⁶ | −2.286 × 10⁻⁶ | 8 |
| −4.4 × 10⁻⁵ | −2.661 × 10⁻⁶ | −2.979 × 10⁻⁶ | 9 |
| 0.001255 | −1.468 × 10⁻⁵ | −3.737 × 10⁻⁶ | 10 |
5. Conclusion
In this essay, the software of bridge remote structure comprehensive parameter acquisition and intelligent evaluation is designed. By combining with hardware monitoring system, the requirements of bridge health parameters acquisition and intelligent evaluation are fulfilled. In addition to ensuring the performance and function of the software, it can simultaneously monitor the multiple hardware monitoring systems on the bridge, obtain the data collected by the monitoring system, analyze the data and display, and get the current health status of the tested bridge according to the health diagnosis module in the software. The software addresses the time-consuming aspects of traditional monitoring and health assessment processes. The final experiment proves that the software has friendly interface, easy operation, and perfect function. It has the advantages of low difficulty in obtaining parameters, high precision, and accurate health assessment and solves the problems of long cycle, low efficiency, and difficult health assessment in the monitoring of old bridges for a long time. It provides reference value for bridge maintenance personnel and has practical significance.
Conflicts of Interest
The author declared that there are no conflicts of interest regarding this work.
Open Research
Data Availability
The experimental data used to support the findings of this study are available from the corresponding author upon request.


