AnoDFDNet: A Deep Feature Difference Network for Anomaly Detection
Abstract
This paper proposed a novel anomaly detection (AD) approach of high-speed train images based on convolutional neural networks and the Vision Transformer. Different from previous AD works, in which anomalies are identified with a single image using classification, segmentation, or object detection methods, the proposed method detects abnormal difference between two images taken at different times of the same region. In other words, we cast anomaly detection problem with a single image into a difference detection problem with two images. The core idea of the proposed method is that the “anomaly” commonly represents an abnormal state instead of a specific object, and this state should be identified by a pair of images. In addition, we introduced a deep feature difference AD network (AnoDFDNet) which sufficiently explored the potential of the Vision Transformer and convolutional neural networks. To verify the effectiveness of the proposed AnoDFDNet, we gathered three datasets, a difference dataset (Diff dataset), a foreign body dataset (FB dataset), and an oil leakage dataset (OL dataset). Experimental results on the above datasets demonstrate the superiority of the proposed method. In terms of the F1-score, the AnoDFDNet obtained 76.24%, 81.04%, and 83.92% on Diff dataset, FB dataset, and OL dataset, respectively.
1. Introduction
Anomaly detection (AD) is one of the core tasks in computer vision which has been well-studied within a wide range of research areas and application domains. Its critical idea is how to identify abnormal information that significantly deviates from the majority of data information [1, 2]. Depending on different application situation or data types, an anomaly is also known as outlier or novelty [3]. Approaches and applications of anomaly detection exist in various domains, such as fraud detection [4], video surveillance [5, 6], health-care [7], security check [8], fault detection [9, 10], and defect detection [11–20].
In the field of safety inspection of high-speed trains, AD is widely used to identify defects and anomalies. Due to the extreme importance of train safety inspection in ensuring the safe and reliable operation of high-speed trains and the development of machine vision, more and more applications based on AD task are used in train safety inspection to improve detection efficiency, reduce detecting cost, and realize intelligent detection [13–17]. In these methods, most of them focus on how to detect anomalies and identify surface defects of key components. Currently, inspired by the success of convolutional neural networks (CNNs) on image analysis, more and more AD algorithms are equipped with CNNs to meet the requirement of fast computing speed, high efficiency, and detecting accuracy [18–27]. According to the image analysis types, the popular AD methods for high-speed train safety inspection can be divided into four categories, unsupervised generated methods [7, 8, 11, 12], anomaly or defect classification [17, 22, 25, 28–30], abnormal object detection [9, 10, 18–21, 23, 26], and defect segmentation [29, 31–33].
- (1)
The “anomaly” generally represents an abnormal state instead of a specific object. As shown in Figure 1, we illustrated some abnormal samples taken from the bottom of high-speed trains. For samples (a), (d), (f), and (c), it is available that utilizing an object detection or segmentation model to detect “foreign body” and “scratch.” In this case, the region of interest (ROI) remains a specific abnormal object to be detected. Nonetheless, for samples (b) and (e), since the anomaly is caused by a missed component instead of an added abnormal object, object detection or segmentation method does not work on it. In other words, in this region, there are no extraneous abnormal objects that can be localized or identified. Consequently, the object-based detection methods are ineffective to identify anomalies if there are no abnormal objects
- (2)
Each object usually has obvious features that represent itself as belonging to a category. In AD tasks, different abnormal categories have different abnormal objects, and some of the objects in each abnormal category have very different feature representation. As samples (a), (d), and (f) shown in Figure 1, the category “foreign body” has different object types, such as tissue, packaging tape, or other unlisted abnormal objects. These abnormal objects have different sizes, shapes, and less structure features. This would make it difficult for a pretrained model to detect unseen abnormal objects whose geometric appearance is very different from training data. In addition, one thing we cannot ignore is that, due to the lack of abnormal samples, it is very difficult to train a powerful enough model that is able to detect all the potential abnormal objects
- (3)
During the train operation, it might have other foreign bodies, such as cables, tree branches, the bodies of animals or birds, stones, plastic bags, mud, or ice and snow which may threaten train operation safety, and so on. It is impossible to list all anomaly categories and abnormal object types. Therefore, there is no doubt that a pretrained model will fail to detect unseen anomalies and abnormal objects. For example, a “foreign body” dataset contains samples of stones, plastic bags, and tissues. The pretrained model will have the capacity of detecting these abnormal objects. For the unseen foreign bodies such as tree branches, animal, or bird bodies, as the model did not see them in the training phase and they have different representation features from trained objects, they would be misdetected
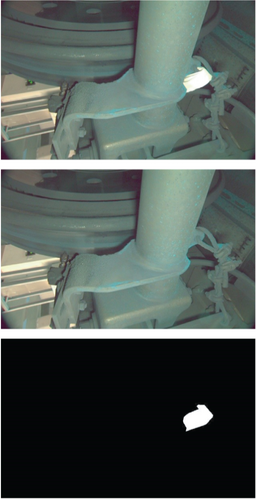
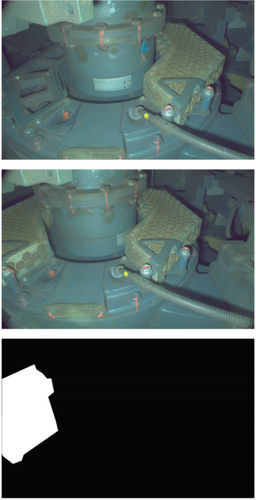
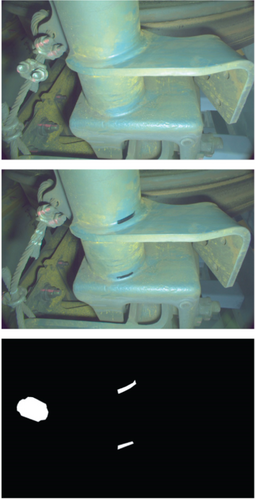
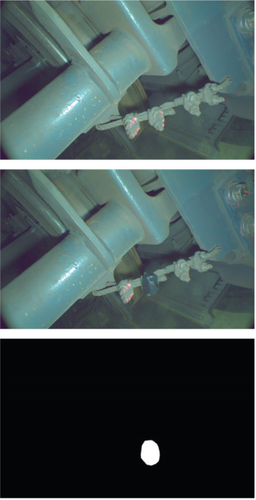
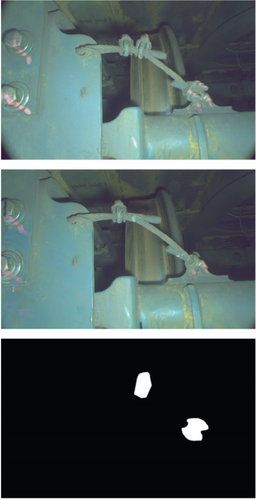
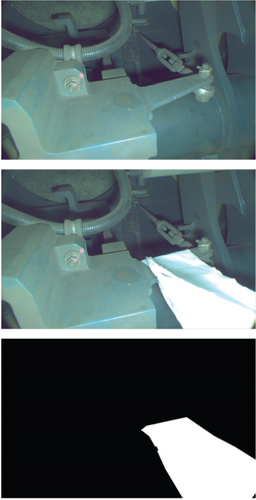
In this paper, we proposed a novel AD method. Unlike previous methods, we use two images taken at different times to detect anomalies by differentiating their features. To the best of our knowledge, the use of paired images and Siamese architectures for AD task is an area of research that has only been poorly studied. As shown in Figure 2, a pair of samples contain two images taken at different times in the same region of the same train. For convenience, the image acquired at the previous time is called as the “history image,” and the image acquired at the latest time is denoted as the “current image.” As we mentioned above, the “anomaly” describes a state instead of a specific object, and some anomalies can not be identified only from a single image only. Therefore, it is much easier to identify whether the ROI exists “anomaly” using two images’ comparison than only using a single image [25]. No matter what type of the abnormal object it is, there must remain a difference between the normal and abnormal images. This difference indicates the abnormal information. At this point, the AD task turns into a problem of detecting whether a pair of samples have interesting differences. Note that a preprint of the proposed method has previously been published [34]. Source code is available at https://github.com/wangle53/AnoDFDNet.
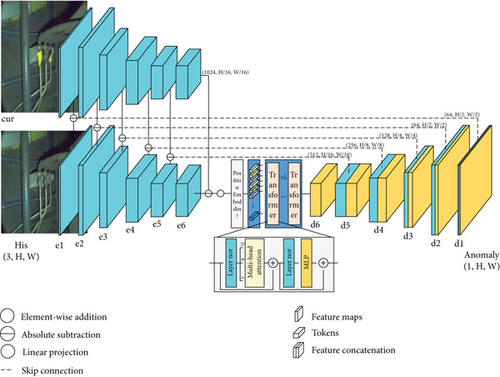
The overview of the proposed model can be seen from Figure 2. This model consists of four components: two CNNs are used to extract the input image features; a Transformer-based module is used to establish long-range relationships; a deep feature difference decoder is used to generate anomaly maps.
- (1)
This paper proposed a novel AD method that accepts two images as input to detect anomalies, which casts abnormal object detection problem to a difference detection problem. Transforming the problem of inexhaustibility of anomalies into a dichotomous problem of whether there exists a difference
- (2)
A deep feature difference AD model named AnoDFDNet is designed to deliver AD task, which sufficiently explored the potential of Vision Transformer and CNNs
- (3)
We collected three AD datasets of high-speed trains to evaluate the effectiveness of the proposed AnoDFDNet, a difference detection dataset (Diff dataset), a foreign body dataset (FB dataset), and an oil leakage dataset (OL dataset). The proposed AnoDFDNet achieved 76.24%, 81.04%, and 83.92% in terms of the F1-score, respectively
The rest of this paper is organized as follows: Section 2 explores other works that were used for inspiration or comparison during the development of this work. The proposed method is described in Section 3. The datasets and experiment configuration are described in Section 4. Section 5 shows the experimental results. Finally, the conclusion of this paper is drawn in Section 6.
2. Related Works
Recently, inspired by the high performance achieved by CNNs in image tasks, many CNN-based methods have been introduced in the AD task. In view of the lack of abnormal data, the unsupervised methods firstly train a model only on samples considered to be normal and then identify insufficiently abnormal samples which differ from the learned data distribution of normal data [7, 8]. Salehi et al. [11] used knowledge distillation to learn a cloner network from an expert network. This method detects and localizes anomalies using the discrepancy between the expert and cloner networks’ intermediate activation values. Bergmann et al. [12] proposed a student-teacher anomaly detection model. It detects anomalies according to the output difference between the student network and the teacher network. For anomaly classification, the task comes to directly classifying different types of anomalies or defects. Wang et al. [25] proposed three kinds of classification models to classify paired images. In their dataset, different anomalies are divided into six categories. As the same as [25], Giben et al. [29] represented a classification method to identify different material of railway track images. For abnormal object detection, it usually takes two steps: first localizing the key component or the region needing to be detected and second using a classifier to identify whether this region or key component is abnormal or which category it belongs to. Chen et al. [18] proposed a coarse-to-fine detecting method. Their networks consist of three subnetworks, two detectors sequentially localize the cantilever joints and their fasteners, and a classifier to diagnose the fasteners’ defects. According to different defect types, the fasteners are classified into three categories, “normal,” “missing,” and “latent missing”. Tu et al. [23] proposed a real-time defect detection method of track components. In this method, they take the influence of sample imbalance and subtle difference among different classes into consideration. Segmentation-based methods of AD task are usually used to segment defects. Further process is using a classifier to classify the segmented defects into different types. Cao et al. [32] proposed a pixel-level segmentation network for surface defect detection. To improve the model performance, the authors integrated feature aggregation and attention modules into the network. Their experiments demonstrated that this model achieved good performance. Li et al. [33] presented a semantic-segmentation-based algorithm for the state recognition of rail fasteners. In addition, the pyramid scene analysis network and vector geometry measurements are combined into the network to further improve its performance.
From the above works, it can be observed that the most existing approaches often focus on detecting specific anomalies. Therefore, these works cannot be applied to unseen anomalies which did not be studied by the network. As mentioned in Section 1, this is the motivation why we designed the proposed method. Since all anomalies can be identified by two image comparison, using a feature difference network can overcome above drawbacks and regardless of the specific categories of anomalies.
3. Proposed Method
The overview architecture of the proposed AnoDFDNet is presented in Figure 2. This model consists of four parts: two weight-shared CNNs used to extract image features; a Vision Transformer-based [35–37] module used to establish long-range relationships and reform feature representation; the deep feature difference decoder used to fuse differentiated features and generate final detecting results. The corresponding layers between CNNs and the decoder are connected using skip connection.
The decoder followed by Transformer layers is used to fuse the output features generated from the last layer and differentiated features from the previous layers.
3.1. Loss Function
4. Experimental Implementation Details
4.1. Datasets
To evaluate the performance of the proposed AnoDFDNet, we collected three challenging anomaly detection datasets, a difference detection dataset (Diff dataset), a foreign body dataset (FB dataset), and an oil leakage dataset (OL dataset).
4.1.1. Diff Dataset
As shown in Figure 1, this dataset contains 399 pairs of training and validation samples and 101 pairs of testing samples. All images are captured automatically by a robot with a camera. By walking under the high-speed train, it can take images of specific regions and components. The main anomalies of this dataset are foreign bodies, missing components, loose components, detached components, scratches, and other anomalies. The spatial resolutions of each image are all 1920 × 1200. Training dataset is split into training and validation sets with the ratio of 8 : 2. All images are scaled to 256 × 256 before being fed into network.
4.1.2. FB Dataset
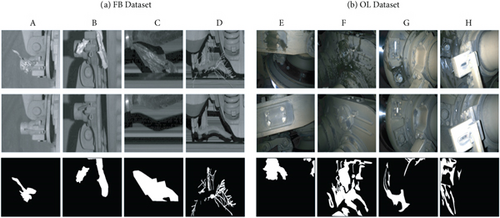
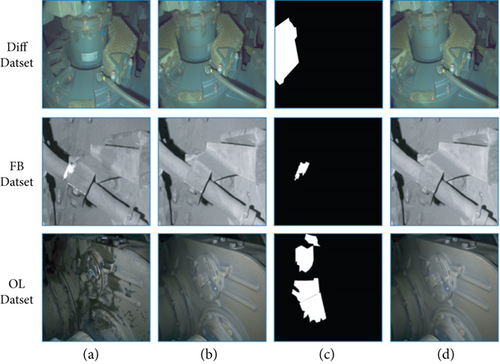
This dataset is a collection of foreign body anomalies and contains 180 pairs of training and validation samples and 39 pairs of testing samples; some of the samples are shown in Figure 3(a). Their spatial resolutions vary from 123 × 271 to 4247 × 1282. To be the same with Diff dataset’s operation, the dataset is split into training and validation with the ratio of 8 : 2, and all images are scaled to 256 × 256.
4.1.3. OL Dataset
This dataset is a collection of oil leakage anomalies, and some samples are shown in Figure 3(b). It consists of 1275 pairs of training and validation samples and 153 pairs of testing samples with the same resolution of 2048 × 1536. Follow the same operation of above two datasets, the dataset is split into training and validation with the ratio of 8 : 2, and all images are scaled to 256 × 256.
It is worth noting that all above datasets have many noisy differences, such as illumination variation, component rotation, and viewpoint variation. These noisy differences will have a certain impact on the anomaly detection. For an AD model, the critical idea lies in if it can detect true anomaly difference while rejecting noisy differences.
4.2. Optimization and Evaluation
In our experiments, all networks were trained using the Adam algorithm with a learning rate of 2e-4. All experiments were implemented using PyTorch 1.10.0 and with an Nvidia RTX2070 GPU of 8 G memory and Intel i7-8700 CPU. To evaluate the performance of the proposed AnoDFDNet, five evaluation measures are used, the precision (Pre), recall (Re), overall accuracy (OA), F1-score (F1), and intersection over union (IoU).
5. Experiments
5.1. Comparison Experiments
In this section, we compared the proposed model with several popular methods which can be used to detect anomalies of paired images. To the best of our knowledge, it does not receive much attention on detecting anomalies using paired images. Therefore, we compared AnoDFDNet with two popular segmentation methods, Unet [38] and DeeplabV3+ [39]. In our view, the purpose of AD task is to generate an anomaly map; it is similar to image segmentation task except the inputs are paired images. Note that the inputs are two images, the paired images are concatenated into a 6-channel image (in Table 1, “_cat” denotes that two images are concatenated into a 6-channel image as input) before being fed into segmentation networks. In addition, since change detection is a task that can also process bi-temporal images, we selected FCLNet [40] as a comparison. In the following, if no otherwise specified, the claimed AnoDFDNet denotes the one with 2 Transformer layers.
| Datasets | No. | Methods | Pre | Re | OA | F1 | IoU |
|---|---|---|---|---|---|---|---|
| Diff dataset | 1 | Unet [38] | 0.4867 | 0.1021 | 0.9878 | 0.1688 | 0.0922 |
| 2 | Unet-cat [38] | 0.3107 | 0.2707 | 0.9838 | 0.2893 | 0.1691 | |
| 3 | DeeplabV3+ [39] | 0.3834 | 0.2674 | 0.9863 | 0.3151 | 0.1870 | |
| 4 | DeeplabV3+-cat [39] | 0.3075 | 0.6135 | 0.9785 | 0.4097 | 0.2576 | |
| 5 | FCLNet [40] | 0.4938 | 0.5075 | 0.9881 | 0.5006 | 0.3338 | |
| 6 | AnoDFDNet | 0.7416 | 0.7584 | 0.9940 | 0.7499 | 0.5999 | |
| FB dataset | 7 | Unet [38] | 0.5667 | 0.5617 | 0.8572 | 0.5642 | 0.3930 |
| 8 | Unet-cat [38] | 0.7975 | 0.6452 | 0.9146 | 0.7133 | 0.5544 | |
| 9 | DeeplabV3+ [39] | 0.7624 | 0.5173 | 0.8940 | 0.6164 | 0.4455 | |
| 10 | DeeplabV3+-cat [39] | 0.6855 | 0.8604 | 0.9120 | 0.7630 | 0.6169 | |
| 11 | FCLNet [40] | 0.7777 | 0.7151 | 0.9206 | 0.7451 | 0.5937 | |
| 12 | AnoDFDNet | 0.8328 | 0.7891 | 0.9392 | 0.8104 | 0.6812 | |
| OL dataset | 13 | Unet [38] | 0.8118 | 0.7589 | 0.9518 | 0.7845 | 0.6454 |
| 14 | Unet-cat [38] | 0.8022 | 0.6111 | 0.9376 | 0.6937 | 0.5310 | |
| 15 | DeeplabV3+ [39] | 0.7674 | 0.8361 | 0.9507 | 0.8003 | 0.6671 | |
| 16 | DeeplabV3+-cat [39] | 0.8086 | 0.7921 | 0.9533 | 0.8003 | 0.6671 | |
| 17 | FCLNet [40] | 0.7951 | 0.8250 | 0.9563 | 0.8098 | 0.6804 | |
| 18 | AnoDFDNet | 0.8395 | 0.8227 | 0.9613 | 0.8310 | 0.7109 | |
As shown in Table 1, comparison experiments were demonstrated on three datasets. It can be observed that the proposed AnoDFDNet achieved superior performance over all datasets. On Diff dataset, the proposed model achieved 74.99% and 59.99% in terms of the F1-score and IoU, respectively. Compared with FCL, AnoDFDNet has improvements of 24.93% and 26.61% on the F1-score and IoU. On FB dataset, AnoDFDNet obtained 81.04% and 68.12% in terms of the F1-score and IoU and improved the performance by 6.53% and 8.75%. For OL dataset, the proposed model still achieved the superior performance with 83.10% in F1-score and 71.09% in IoU, which improved by 2.12% and 3.05%. On both of Diff and FB datasets, the performances of Unet_cat and Deeplabv3+_cat are better than Unet and Deeplabv3+. There are three main reasons for this; one is two images provide more information for feature extraction; more importantly, the difference information only can be detected using two images acquired at different times; the third one is that anomaly objects are inexhaustible and cannot be listed in their entirety; for some specific anomalies, such as foreign bodies, they do not have a particular geometrical characteristic. Therefore, it is difficult to detect anomalies using a single image.
Another important point here is that the overall performance of OL dataset is higher than Diff and FB datasets. The main reason is that Diff and FB datasets have larger viewpoint than OL dataset. As shown in Figure 4, we fused “cur” and “his” image into an image. As the existence of viewpoint difference, two images are unable to match with each other. In the other word, the two images are unregistered. This unregistered viewpoint difference makes detecting anomalies be more difficult. From Table 1, on Diff dataset, the proposed AnoDFDNet improved with a huge margin compared with FCLNet. It indicates that AnoDFDNet is good to overcome viewpoint difference.
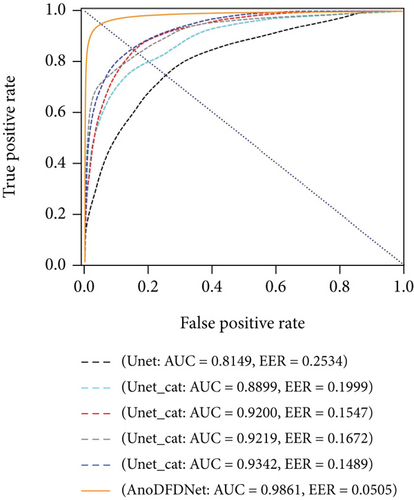
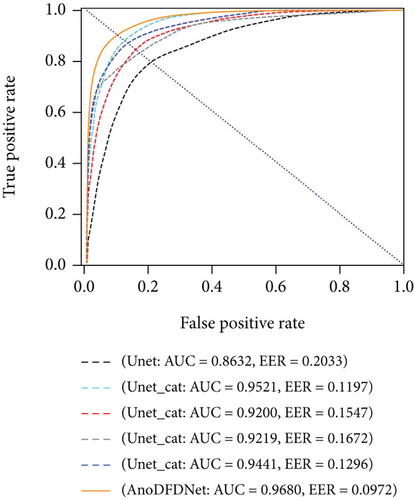
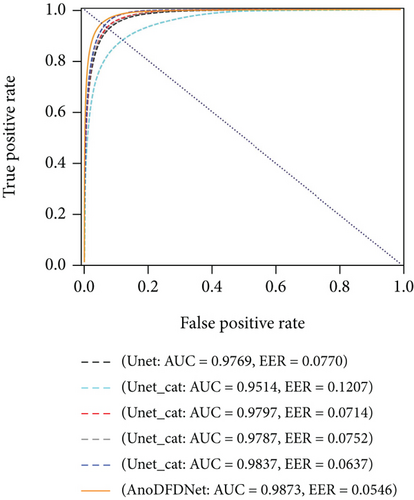
For further comparison, we figured out their receiver operating characteristic (ROC) curves. As shown in Figure 5, the proposed model obtained the highest AUC (area under curve) and the lowest EER (equal error rate). AnoDFDNet achieved 98.61%, 96.80%, and 98.73% in terms of AUC and 5.05%, 9.72%, and 5.46% in terms of EER, on Diff, FB, and OL datasets, respectively. Table 2 shows the inference speeds of the methods; we can observe that the proposed method has a good trade-off between detecting accuracy and computing complexity. From above comparison, it indicates that the proposed model has better capacity of detecting anomalies than other methods.
5.2. Visualization
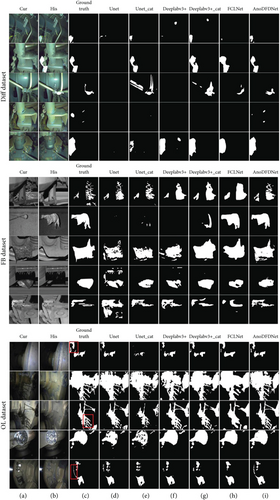
In this section, we have visualized anomaly maps of the selected methods to visually compare them. As shown in Figure 6, on Diff dataset, it is no doubt that the presented AnoDFDNet performed the best. As the existence of large viewpoint difference between two images, all selected methods seem incompetent to detect anomalies. For example, for the fourth pair of samples, all selected methods missed the missing anomaly and the scratch anomaly; for the third pair of samples, Unet_cat detected the unregistered pipe fitting as anomalies instead of the foreign body. As to FB dataset, although its viewpoint difference is smaller than Diff dataset, it still brings difficulties to anomaly detection. For the second pair of samples, both Unet and Deeplabv3+ missed the foreign body anomaly; Unet_cat and Deeplabv3+_cat just detected a little part of the anomaly. With regard to OL dataset, even though the performances of all methods are comparable, some difference can be found on closer observation. Unet missed the anomalies on the top left corner of the first pair of samples. For the third pair of samples, the anomaly map detected by FCLNet is not fine enough. In the last pair of samples, only our model did a good job of detecting the oil leakage anomaly in the box.
5.3. Ablation Studies
In the proposed AnoDFDNet, a significant module is the Transformer-based architecture. To investigate the influence of Transformer layers on model performance, we implemented a series of ablation experiments around the number of Transformer layers; here, “0” denotes without Transformer module in AnoDFDNet.
As shown in Table 3, on OL dataset, the results with different Transformer layers are similar; on FB dataset, the model with 2 layers of Transformer obtained the highest performance; on Diff dataset, the performance is superior to others when layer number is set to 8. More importantly, the results with or without Transformer are very different. For example, in terms of the IoU, experiment No. 5 improved by 10.28% when compared with No. 1; experiment No. 8 has an improvement of 2.49% over No 6; experiment No. 12 is 3.06% higher than No. 11. Form above results, it denotes that the designed Transformer-based module indeed improves the detecting performance. To some extent, the performance improvement benefits from the Transformer-based module especially on datasets with large viewpoint difference, because the Transformer is good at establishing global semantic relations and modeling long-range context which benefits to samples with large viewpoint difference. It is worth noting that, although experiment No. 7, No. 8, and No. 9 have superior performances than No. 6, experiment No. 10 has lower performance than No. 6 on FB dataset. One reasonable explanation is that the samples of FB dataset are not very enough to train a complicated Transformer-based model with 8 layers of Transformers.
| Datasets | No. | Layer number | Pre | Re | OA | F1 | IoU |
|---|---|---|---|---|---|---|---|
| Diff dataset | 1 | 0 | 0.6473 | 0.7124 | 0.9920 | 0.6783 | 0.5132 |
| 2 | 1 | 0.7027 | 0.7585 | 0.9934 | 0.7296 | 0.5743 | |
| 3 | 2 | 0.7880 | 0.7350 | 0.9945 | 0.7606 | 0.6136 | |
| 4 | 4 | 0.7867 | 0.7138 | 0.9943 | 0.7485 | 0.5981 | |
| 5 | 8 | 0.7735 | 0.7515 | 0.9944 | 0.7624 | 0.6160 | |
| FB dataset | 6 | 0 | 0.7952 | 0.7897 | 0.9319 | 0.7925 | 0.6563 |
| 7 | 1 | 0.8372 | 0.7731 | 0.9379 | 0.8038 | 0.6720 | |
| 8 | 2 | 0.8328 | 0.7891 | 0.9392 | 0.8104 | 0.6812 | |
| 9 | 4 | 0.8479 | 0.7562 | 0.9375 | 0.7994 | 0.6659 | |
| 10 | 8 | 0.8191 | 0.7537 | 0.9320 | 0.7850 | 0.6461 | |
| OL dataset | 11 | 0 | 0.8742 | 0.7689 | 0.9605 | 0.8182 | 0.6923 |
| 12 | 1 | 0.8532 | 0.8256 | 0.9634 | 0.8392 | 0.7229 | |
| 13 | 2 | 0.8395 | 0.8227 | 0.9613 | 0.8310 | 0.7109 | |
| 14 | 4 | 0.7979 | 0.8637 | 0.9590 | 0.8295 | 0.7087 | |
| 15 | 8 | 0.8235 | 0.8514 | 0.9617 | 0.8372 | 0.7180 | |
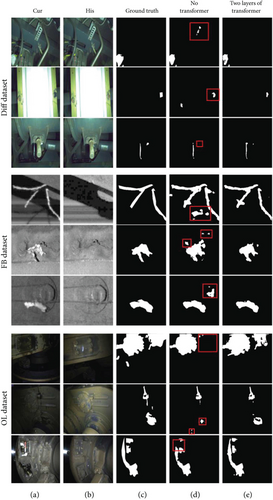
The anomaly maps generated by AnoDFDNet without Transformer and with two layers of Transformers are listed in Figure 7. From Figure 7, it shows that Transformer-based AnoDFDNet outperforms the one without Transformer. On Diff dataset, for the first and second pairs of samples, no-Transformer AnoDFDNet identified part of background into anomalies; for the third pair of samples, no-Transformer AnoDFDNet missed some anomalies. On FB dataset, different from no-Transformer AnoDFDNet which detected much false positive, the Transformer-based AnoDFDNet obtained good anomaly maps on three pairs of samples. On OL dataset, as to the first pair of samples, no-Transformer AnoDFDNet missed a large abnormal region. From the above experiment results, it verifies the superiority of the resigned AnoDFDNet.
5.4. Visualization of Feature Maps and Dimensionality
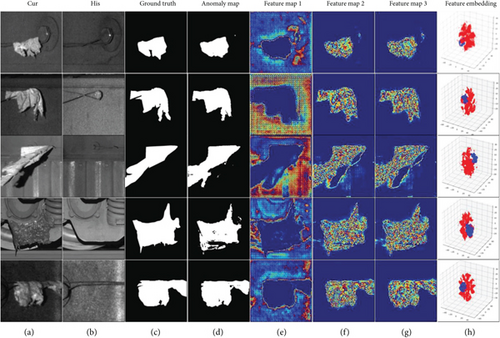
To interpret the proposed AnoDFDNet as a deeper level, we visualized the feature maps extracted from the “d2” layer (as shown in Figure 2). In addition, the T-SNE (T-distributed Stochastic Neighbor Embedding) [41] algorithm is used to embed the feature distribution.
As shown in Figure 8, we selected 3 typical feature maps for each pair of samples. The feature map 1 mainly focuses on the background and the abnormal region’s boundary. Feature maps 2 and 3 response for the anomaly itself. All of them allow the model focus training on more useful feature representations. The last column visualized the three-dimensional feature embedding; it shows that the proposed model obtained a good distinction between abnormal and normal feature information.
6. Conclusions
In this paper, we proposed a novel anomaly detection framework named AnoDFDNet based on the fusion of convolutional neural networks and the Vision Transformer. In view of the drawbacks of detecting anomalies with a single image, we introduce the idea that the “anomaly” describes an abnormal state instead of a specific object. Therefore, it is more reasonable that the anomaly detection should be operated upon a pair of images. By detecting the interesting image differences, the abnormal information can be identified. Following above idea, we established a deep feature difference anomaly detection model, in which convolutional neural networks and the Vision Transformer are fused together. Extensive experiments indicate that the proposed method outperforms other comparison methods. In addition, the integrated Transformer layers indeed improve detection performance and benefit to detecting such samples with large viewpoint difference. In terms of the F1-score, the AnoDFDNet obtained 76.24%, 81.04%, and 83.92% on Diff dataset, FB dataset, and OL dataset, respectively. This paper provided a novel method of both researchers and practitioners to further develop anomaly detection task.
Disclosure
A preprint version can be found from the link: https://arxiv.org/abs/2203.15195.
Conflicts of Interest
The authors declare no conflict of interest.
Acknowledgments
This work was supported in part by the National Natural Science Foundation of China under Grant No. 61771409 and the Science and Technology Program of Sichuan under Grant No. 2021YJ0080, for providing the project of research on high-speed train safety inspection. We gratefully acknowledge the arXiv for providing the opportunity of uploading our manuscript for peer communication.
Open Research
Data Availability
The data used to support the findings of this study are available from the corresponding author upon request.


