Exploration of Water-Saving and High-Yield Irrigation Model for Tomato under Microsprinkler Irrigation with Plastic Film in a Greenhouse Based on Spatial Analysis
Abstract
The purpose of this study was to analyse the suitability of the frequency and amount of microsprinkler irrigation under plastic film technology (MSPF) in a greenhouse. This study was aimed at determining the effects of different irrigation frequency and irrigation amount of the MSPF on the quality, yield (Y), and water use efficiency (WUE) of tomato, and the optimal irrigation period and irrigation amount of tomato with MSPF were determined by spatial analysis method. Irrigation frequency was set 3 levels, 3 d (F1), 5 d (F3), and 7 d (F3), respectively. Irrigation amount was set 3 levels, 0.7 Epan (I1), 1.0 Epan (I2), and 1.2 Epan (I3) (Epan is the diameter of 20 cm standard pan evaporation, mm), respectively. The results show that increase in the single fruit weight (SFW), transverse diameter (TD), vertical diameter (VD), total soluble solids (TSS), total soluble sugar (TSU), soluble solid content (SSC), sugar-acid ratio (SAR), soluble protein (SP), vitamin C (VC), lycopene (L), Y, and WUE of spring and autumn tomatoes was observed initially with decreasing irrigation frequency; however, decrease in all these variables was observed thereafter. Similarly, SFW, TD, VD, and SAR of spring and autumn tomatoes first added and then reduced with increasing irrigation amount, whereas TSS, SP, TSU, VC, L, and WUE exhibited an overall decreasing trend. On the basis of spatial analysis, the comprehensive score, Y, and WUE of F2I2 tomato were predicted to simultaneously reach more than 95% of the maximum, which is consistent with the earlier studies on comprehensive evaluation of yield and WUE.
1. Introduction
With improvement in the quality of life, the demand for good quality vegetables also increases [1]. Tomato (Solanum lycopersicum L.) is one of the main vegetables grown under protected cultivation system in Northwest China and possesses rich nutrition and health care value [2, 3]. The water requirement for the growth of facility crops mainly comes from irrigation. Although the rapid development of facility agriculture ensures the stable yield of vegetables, the irrigation of facility agriculture has also aggravates the water resource crisis in Northwest China [4, 5]. Studies have shown that changes in the irrigation frequency and irrigation amount of tomato in facility agriculture not only affected the water consumption of tomato but also changed the dry matter accumulation, fruit quality, and yield of tomato [6–8]. Therefore, under the premise of not increasing farmers’ input, optimizing the existing irrigation frequency and irrigation amount of greenhouse tomato to achieve the best balance of water-saving, yield-increasing and quality improvement of tomato is important for the efficient utilization and sustainable development of facility water resources in this area.
The MSPF has a significant effect of saving water and increasing yield, and it has a good prospect in the field of facility agriculture tomato planting [5, 9, 10]. The results show that irrigation frequency and irrigation amount can change soil water distribution and crop yield and quality [2, 11]. In terms of irrigation frequency, farmers often initiate irrigation after delayed drought stress on the crop physiological index. Decreased crop yield and poor quality are common due to untimely irrigation. Drip irrigation for 7–9 days has been found to improve the quality and yield of tomato [12]. In terms of irrigation amount, the actual amount of crop irrigation is much higher than the crop water requirement, resulting in a great waste of water resources, leading to a series of ecological environment and food production problems [13, 14]. Studies have shown that drip irrigation can improve the quality and yield of tomato when the irrigation amount is 0.7 Epan [2].
At present, there are few studies on the effects of single factor and interaction of irrigation frequency and irrigation amount of MSPF on the fruit quality, yield, and water use efficiency (WUE) of greenhouse tomato; at the same time, there are few reports on the guidance of greenhouse tomato irrigation based on pan evaporation. Tomato fruit quality, yield, and WUE are the 3 major indices constituting the comprehensive benefit of greenhouse tomato. It is difficult to meet the peak value of the 3 major indices at the same time by selecting the most suitable combination of irrigation frequency and irrigation amount. There are few studies on how to optimize the three main indexes. Therefore, this study sought to explore the quality, yield, and WUE of greenhouse tomato in response to different irrigation frequencies and irrigation amount of MSPF based on pan evaporation-controlled MSPF amount. Regression analysis of data based on the least square method using Mathematica 12.0 was performed by taking principal component analyses (PCA) for the comprehensive scores of spring and autumn tomato quality, yield, and WUE as dependent variables and irrigation frequency and irrigation amount as independent variables. The maximum confidence interval (CI) of 95% was used to screen the optimal irrigation frequency and amount. The most suitable irrigation frequency and irrigation amount combination model of MSPF for tomato quality, yield, and WUE in arid and semiarid sandy loam areas was obtained. This paper provides valuable data support for water saving, yield increase, and quality improvement of facility vegetables in this area through greenhouse experiments and multiobjective optimization data analysis.
2. Materials and Methods
2.1. Experimental Site and Management
The experimental greenhouse is located in the Modern Agricultural Science and Technology Exhibition Center of Xi’an City, Shaanxi Province. The test center has a warm temperate semihumid continental monsoon climate, located in the arid and semiarid regions of Northwest China, with an altitude of 435 m. The field water holding capacity of the soil in the greenhouse is 25.40% (mass water content), and its type is sandy loam, and the mass fractions of sand, silt, and clay are 63.9%, 29.63%, and 6.47%, respectively. The average bulk density of the 1.0 m soil layer was 1.48 g/cm3, the water holding capacity of field weight was 27.40%, and the depth of groundwater table on the site exceeded 30 m. The contents of organic matter, total phosphorus (P), total potassium (K), total nitrogen, available nitrogen, available P, and available K in the plough layer before sowing were 15.53 g/kg, 10.12 g/kg, 2.01 g/kg, 1.36 g/kg, 70.45 mg/kg, 112 mg/kg, and 85.23 mg/kg, respectively.
The greenhouse tomato variety in this experiment is “Jingfan 401” (Jingyan Yinong Seed Technology Co., Ltd., Beijing). The length of the ridge was 3.4 m and the width of the ridge was 1.2 m. Tomato was planted in one pipe and two rows on ridges. The plant spacing was 40 cm and the row spacing was 50 cm. A 1-meter block copolymer waterproof membrane was embedded in each treatment of the experimental plot to prevent the interaction of horizontal water transport among the plots. The field management measures, such as fertilisation, irrigation, and pesticides, were kept similar in all treatments. In this experiment, the spring and autumn tomatoes were transplanted on March 27, 2019, and August 23, 2019, irrigated on April 4, 2019, and August 30, 2019, stopped irrigation on July 15, 2019, and January 17, 2020, and reaped on July 25, 2019, and January 30, 2020. During the growth period of tomato, except for the different treatment factors, the other treatments were consistent. The microsprinkler hose selected for MSPF is Hebei Plentirain Irrigation Equipment Technology Co., Ltd. (Hebei, China). The thin-walled oblique hole in the microsprinkler hose has three microholes, and the diameter of the microhole is 0.7 mm. The diameter of the microsprinkler hose is 32 mm, and the working pressure is 0.6 bar. The white agricultural insulation film was produced by Hedong pastoral plastic product factory (Hebei, China).
2.2. Experimental Design
This paper mainly studies the effects of irrigation frequency and water amount of MSPF on the quality, yield, and water use efficiency of greenhouse tomato. Irrigation frequency and irrigation amount are set at 3 levels, in which the interval of irrigation frequency was 3 days, 5 days, and 7 days, respectively; the irrigation amount was controlled by the basis of the cumulative evaporation (Epan, a 20 cm diameter standard pan) [15], which was realised by a control coefficient (kcp). The kcp (the crop pan coefficient) was 0.7, 1.0, and 1.2. A completely randomized trial design was used, and the treatments are shown in Table 1. Each of the treatments was repeated 3 times, a total of 27 experimental plots.
| No. | Treatment | Irrigation frequency (d) | kcp | Irrigation amount (mm) | Irrigation times | ||
|---|---|---|---|---|---|---|---|
| Spring of tomato | Autumn of tomato | Spring of tomato | Autumn of tomato | ||||
| 1 | F1I1 | 3 | 0.7 | 247.12 | 152.73 | 33 | 47 |
| 2 | F1I2 | 3 | 1.0 | 353.03 | 218.19 | 33 | 47 |
| 3 | F1I3 | 3 | 1.2 | 423.64 | 261.83 | 33 | 47 |
| 4 | F2I1 | 5 | 0.7 | 247.12 | 152.73 | 21 | 28 |
| 5 | F2I2 | 5 | 1.0 | 353.03 | 218.19 | 21 | 28 |
| 6 | F2I3 | 5 | 1.2 | 423.64 | 261.83 | 21 | 28 |
| 7 | F3I1 | 7 | 0.7 | 247.12 | 152.73 | 15 | 20 |
| 8 | F3I2 | 7 | 1.0 | 353.03 | 218.19 | 15 | 20 |
| 9 | F3I3 | 7 | 1.2 | 423.64 | 261.83 | 15 | 20 |
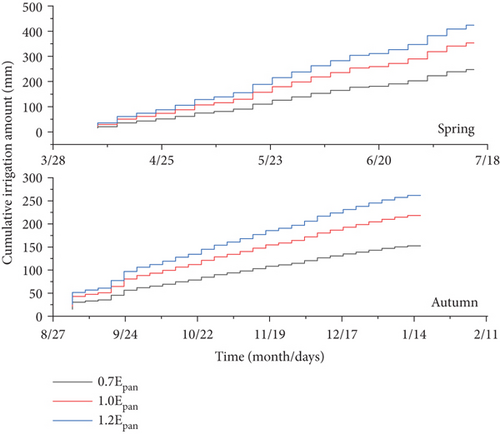
In the formula, W represents the irrigation amount and A represents the plot area.
2.3. Determination of Tomato Quality and Calculation of Related Indices
2.3.1. Measurements
The fruit shape indices (weight of single fruit, vertical diameters, and transverse diameters), tomato flavor indices (total soluble solids, soluble solid content, and sugar/acid ratio), and tomato nutrition indices (soluble protein, vitamin C, and lycopene) of spring and autumn tomatoes were determined. Three tomato fruits were randomly selected in each plot when the tomatoes were ripe at the first stage. Individual fruits were homogenized to determine the fruit flavor and nutritional indexes. The specific measurement method is as follows:
Weight of single fruit (SFW): the SFW was gauged by electronic scale (LQ-C20002 Kunshan Youkeweite Electronic Technology Co., Ltd., Jiangsu, China)
Vertical diameters (VD): the VD was gauged by vernier calipers [5]
Transverse diameters (TD): the TD was gauged by vernier calipers [5]
Total soluble solid content (TSS): the TSS was gauged by hand-held refractometer (PR-32α Atago, Tokyo, Japan)
Total soluble sugar content (TSU): the TSU was gauged by anthrone method [17]
Soluble solid content (SSC): the SSC was gauged by anthrone method [2]
Titratable acids content (TA): the TA was gauged by acid-base titration [18]
Sugar/acid ratio (SAR): SAR = SSC/TA [5]
Soluble protein content (SP): the SP was gauged using Coomassie brilliant blue assay [2]
Vitamin C content (VC): the VC was gauged by the classical titration method [19]
Lycopene content (L): the L was gauged by ultraviolet spectrophotometer [20]
2.3.2. Quality Comprehensive Evaluation
The above 9 indices are taken as variables of comprehensive quality evaluation. Firstly, standardisation and homogenisation were performed. Secondly, the principal component load matrix of each variable was obtained using principal component analysis (PCA) to evaluate the comprehensive concept quality of tomato, and a quantitative comprehensive score was derived for the comprehensive evaluation of tomato quality [5].
2.4. Determination of Tomato Yield and Water Use Efficiency and Calculation of Related Indices
2.4.1. Yield
When the fruits are ripe, 4 tomato plants are randomly selected in each plot, and the ripe fruits are collected every three days and weighed, and the weights are recorded separately and finally converted into hectare yield (Y, kg/hm2).
2.4.2. Water Use Efficiency
2.5. Data Analysis
Statistical analysis was performed by SPSS 22.0 (IBM Crop., Armonk, New York, NY, USA), and the contribution degree was obtained by the efficacy estimation in univariate analysis. The statistics was plotted by OriginPro 2019b (Origin Lab Corporation, Northampton, MA, USA). The Wolfram Mathematica 12.0 (Wolfram Research, New York, NY, USA) was used to return analysis of data.
3. Results
3.1. Effects of Different Irrigation Frequency and Irrigation Amount on Quality of Tomato
3.1.1. Shape Indices
As shown in Table 2, the SFW and VD of spring tomato and autumn tomato fruits were greatly affected by irrigation frequency (F, P ≤ 0.05). The F increased from F1 to F3, and the SFW, TD, and VD of spring tomato and autumn tomato were first added and then reduced. The SFW, TD, and VD of spring tomato and autumn tomato fruits were greatly affected by irrigation amount (I, P ≤ 0.05). With increase in I, the SFW, TD, and VD of spring tomato and autumn tomato were added.
| Treatment | Spring of tomato fruit | Autumn of tomato fruit | ||||
|---|---|---|---|---|---|---|
| SFW (g) | TD (mm) | VD (mm) | SFW (g) | TD (mm) | VD (mm) | |
| F1I1 | 85.79 ± 39.3b | 48.27 ± 9.2b | 50.97 ± 9.56d | 111.88 ± 18.74b | 42.64 ± 4.08c | 50.25 ± 6.47c |
| F1I2 | 114.03 ± 35.56ab | 52.94 ± 6.48ab | 59.88 ± 4.8bcd | 153.36 ± 30.81a | 49.68 ± 5.91ab | 59.96 ± 5.35ab |
| F1I3 | 134.88 ± 67.31a | 52.04 ± 11.79ab | 65.68 ± 12.62abc | 151.46 ± 51.12a | 49.26 ± 5.12ab | 60.06 ± 6.34ab |
| F2I1 | 106.16 ± 35.23ab | 48.69 ± 7.1b | 57.58 ± 9.94cd | 113.23 ± 36.48a | 45.23 ± 3.54bc | 50.25 ± 4.64c |
| F2I2 | 139.42 ± 25.75a | 57.86 ± 4.17a | 67.39 ± 3.17ab | 161.52 ± 31.06a | 51.75 ± 3.36a | 62.86 ± 3.54a |
| F2I3 | 146.37 ± 34.56a | 59.8 ± 6.2a | 71.01 ± 10.65a | 153.37 ± 30.21a | 51.47 ± 7.01a | 58.2 ± 3.04ab |
| F3I1 | 83.23 ± 48.65b | 47.72 ± 11.41b | 52.92 ± 10.31d | 125.43 ± 44.19ab | 48.78 ± 8.02ab | 56.85 ± 7.7b |
| F3I2 | 105.24 ± 28.54ab | 53.97 ± 8.38ab | 58.85 ± 4.94bcd | 149.29 ± 17.5ab | 51.09 ± 4.63ab | 61.33 ± 2.01ab |
| F3I3 | 118.7 ± 40.01ab | 54.46 ± 5.96ab | 62.94 ± 9.57abc | 157.17 ± 55.09a | 49.34 ± 6.12ab | 61.58 ± 4.28ab |
| F-value | ||||||
| F | 3.317 ∗ | 2.102 ns | 5.228 ∗∗ | 0.136 ns | 1.738 ns | 3.106 ∗ |
| I | 7.167 ∗ | 6.468 ∗∗ | 14.079 ∗∗ | 9.186 ∗∗ | 7.192 ∗∗ | 23.728 ∗∗ |
| F∗I | 0.113 ns | 0.463 ns | 0.214 ns | 0.268 ns | 0.930 ns | 1.798 ns |
3.1.2. Flavor Indices
As shown in Table 3, the TSS of spring tomato and autumn tomato were greatly affected by F. The TSS, TSU, and SAR of spring tomato and autumn tomato were greatly affected by I. The flavor index of the spring tomato and autumn tomato treated with F2I2 was not significantly different from that of F1I2. The TSS of the spring tomato and autumn tomato in F1I2 were significantly higher than that of F1I3 (approximately 22.53% and 29.80%, respectively) and F3I3 (approximately 13.95 and 17.80%, respectively). The TSU of the spring tomato and autumn tomato F1I2 were significantly higher than that of F1I3 (approximately 22.67 and 16.01%, respectively) and F3I3 (approximately 36.12% and 17.36%, respectively). The F increased from F1 to F3, the TSS, TSU, and SAR of spring tomato and autumn tomato were first added and then reduced, and the TSS, TSU, and SAR of spring tomato and autumn tomato were reduced and2 added from I1 to I3 for I.
| Treatment | Spring of tomato fruit | Autumn of tomato fruit | ||||
|---|---|---|---|---|---|---|
| TSS (%) | TSU (%) | SAR | TSS (%) | TSU (%) | SAR | |
| F1I1 | 5.22 ± 0.21ab | 7.6 ± 1.01abc | 6.87 ± 1.35ab | 4.85 ± 0.39a | 7 ± 1.14ab | 6.52 ± 0.9ab |
| F1I2 | 5.01 ± 0.16bc | 7.42 ± 1.29abc | 8.24 ± 1.94a | 4.58 ± 0.47a | 6.78 ± 1.54abc | 6.14 ± 1.17ab |
| F1I3 | 4.54 ± 0.06d | 6.32 ± 1.37cd | 6.87 ± 1.35ab | 4.19 ± 0.28b | 6.09 ± 0.89cd | 6.05 ± 1.14ab |
| F2I1 | 5.43 ± 0.26a | 8.7 ± 0.88a | 7.89 ± 0.96a | 5.17 ± 0.55a | 7.35 ± 0.87a | 6.89 ± 1.24a |
| F2I2 | 5.17 ± 0.66ab | 7.75 ± 1.6ab | 8.2 ± 1.61a | 4.94 ± 0.47a | 7.06 ± 0.84ab | 6.35 ± 1.18ab |
| F2I3 | 4.84 ± 0.42cd | 6.97 ± 1.37bcd | 6.25 ± 1.26b | 4.41 ± 0.81ab | 6.25 ± 0.98bc | 5.55 ± 0.75b |
| F3I1 | 5.23 ± 0.15ab | 7 ± 1.44bcd | 7.79 ± 1.74a | 4.54 ± 0.75ab | 6.99 ± 1.6bc | 6 ± 0.93ab |
| F3I2 | 4.9 ± 0.38bc | 6.8 ± 1.54bcd | 7.5 ± 1.53ab | 4.09 ± 0.44a | 6.71 ± 1.5abc | 5.89 ± 1.56ab |
| F3I3 | 4.22 ± 0.12e | 5.69 ± 1.22d | 6.16 ± 0.89b | 3.81 ± 0.24b | 6.02 ± 1.18d | 5.47 ± 0.63b |
| F-value | ||||||
| F | 8.714 ∗∗ | 6.609 ∗ | 0.286 ns | 12.215 ∗∗ | 0.538 ns | 0.597 ns |
| I | 38.232 ∗∗ | 8.416 ∗∗ | 8.217 ∗ | 12.800 ∗∗ | 4.931 ∗ | 3.473 ∗ |
| F∗I | 1.191 ns | 0.249 ns | 1.246 ns | 0.180 ns | 0.015 ns | 0.519 ns |
3.1.3. Nutritional Indices
As shown in Table 4, the SP and VC of spring tomato and autumn tomato were greatly affected by F. The SP, VC, and L of spring tomato and autumn tomato were greatly affected by I. No significant difference in nutritional index between F2I2 and F1I2 treatments was observed. The SP of F2I2 treatment was significantly higher than that of F3I3 treatment. The VC of F2I2 with spring and autumn tomato was significantly higher than that of F1I3 (approximately 26.02% and 17.02%, respectively), F2I3 (approximately 17.07% and 11.88%, respectively), F3I1 (approximately 9.43% and 10.63%, respectively), F3I2 (approximately 10.41% and 6.07%, respectively), and F3I3 (approximately 26.62% and 28.19%, respectively). The L of F2I2 with spring and autumn tomato was significantly higher than that of F1I3 (approximately 17.01% and 10.77%, respectively), F2I3 (approximately 14.56% and 8.76%, respectively), and F3I3 (approximately 34.00% and 18.31%, respectively). The F was added from F1 to F3, and the SP, VC, and L of spring tomato and autumn tomato were added initially and reduced thereafter, while these parameters decreased with increased from I1 to I3.
| Treatment | Spring of tomato fruit | Autumn of tomato fruit | ||||
|---|---|---|---|---|---|---|
| SP (mg/g) | VC (mg/g) | L (%) | SP (mg/g) | VC (mg/g) | L (%) | |
| F1I1 | 5.4 ± 0.35ab | 19.62 ± 1.55ab | 59.18 ± 7.33abc | 5.26 ± 0.5ab | 16.93 ± 2.89ab | 60.65 ± 8.86aab |
| F1I2 | 5.27 ± 0.63ab | 17.94 ± 1.28bc | 58.45 ± 4.53abc | 4.91 ± 0.38ab | 16.17 ± 2.12ab | 59.03 ± 8.91ab |
| F1I3 | 5.12 ± 0.71bc | 15.23 ± 1.53d | 53.4 ± 6.59c | 4.45 ± 0.63ab | 14.83 ± 1.91bc | 53.54 ± 8.69bc |
| F2I1 | 5.7 ± 0.51a | 20.85 ± 4.24a | 65.73 ± 7.15a | 5.2 ± 0.15a | 17.86 ± 1.82a | 61.3 ± 5.12a |
| F2I2 | 5.39 ± 0.39ab | 19.19 ± 2.44ab | 62.48 ± 8.15a | 5.10 ± 0.55ab | 17.36 ± 0.54ab | 59.31 ± 3.74ab |
| F2I3 | 5.07 ± 0.32bc | 16.83 ± 2.62cd | 54.54 ± 10.93bc | 4.87 ± 0.34ab | 15.51 ± 1.37abc | 54.53 ± 6.12abc |
| F3I1 | 5.31 ± 0.52ab | 17.54 ± 1.37bc | 61.45 ± 5.86ab | 4.83 ± 0.5ab | 15.69 ± 1.7ab | 58.14 ± 5ab |
| F3I2 | 4.95 ± 0.56bc | 17.38 ± 1.37bc | 58.29 ± 5.83abc | 4.96 ± 0.51ab | 16.36 ± 2.24abc | 56.9 ± 6.78abc |
| F3I3 | 4.73 ± 0.19c | 14.92 ± 1.1d | 46.63 ± 5.04d | 4.44 ± 0.2b | 13.54 ± 1.66c | 50.13 ± 6.86c |
| F-value | ||||||
| F | 4.400 ∗ | 7.979 ∗∗ | 4.292 ∗ | 3.440 ∗ | 5.475 ∗∗ | 1.758 ns |
| I | 6.924 ∗∗ | 20.392 ∗∗ | 16.757 ∗∗ | 10.041 ∗∗ | 11.005 ∗∗ | 8.314 ∗∗ |
| F∗I | 0.374 ns | 0.539 ns | 1.014 ns | 1.131 ns | 0.487 ns | 0.050 ns |
3.1.4. Comprehensive Evaluation of Tomato Quality Based on PCA
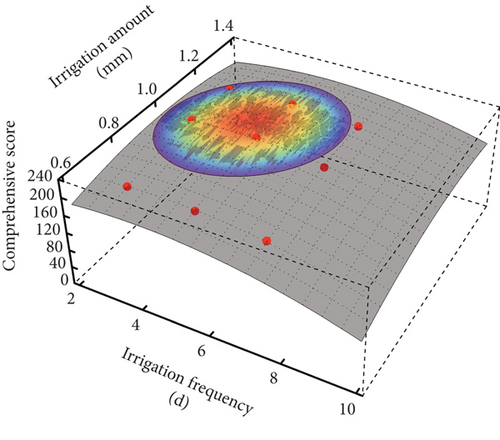
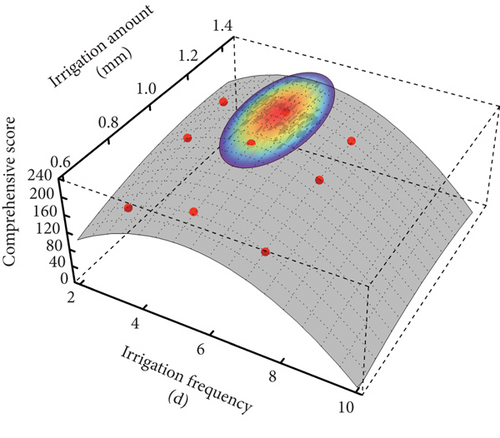
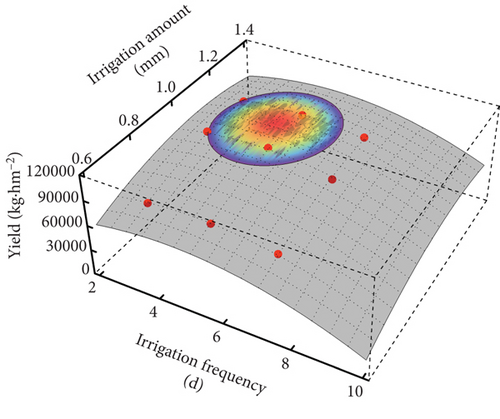
As shown in Table 5, the first PC1 mainly represents the appearance of fruit, and its cumulative contribution rate is more than 50%; the second PC2 mainly characterizes fruit flavor and nutrition, and its cumulative contribution rate is more than 32%. It can be seen from Figure 2 that the comprehensive quality score of F2I2 treatment is within 95% confidence interval of the peak value of spring and autumn tomato quality score, indicating that the quality of spring tomato and autumn tomato with F2I2 treatment can reach the best.
| Variables | Spring | Autumn | ||
|---|---|---|---|---|
| PC1 (55.00%) | PC2 (32.16%) | PC1 (50.92%) | PC2 (38.09%) | |
| X1 | -0.143 | 0.971 | -0.348 | 0.905 |
| X2 | -0.203 | 0.921 | -0.185 | 0.953 |
| X3 | -0.212 | 0.968 | -0.337 | 0.915 |
| X4 | 0.932 | -0.280 | 0.883 | -0.321 |
| X5 | 0.971 | -0.076 | 0.893 | -0.276 |
| X6 | 0.764 | -0.124 | 0.912 | -0.287 |
| X7 | 0.920 | -0.208 | 0.972 | -0.161 |
| X8 | 0.924 | -0.216 | 0.930 | -0.306 |
| X9 | 0.956 | -0.203 | 0.786 | -0.474 |
3.2. Effects of Different Irrigation Frequency and Irrigation Amount on Yield and WUE of Tomato
As shown in Table 6, the yield, ETa, and WUE of spring tomato and autumn tomato were greatly affected by F and I. The significantly higher tomato yield of F2I2 was compared with F1I1, F2I1, F3I1, and F3I2 yields (33.44% and 31.00%, 31.88% and 28.03%, 44.08% and 43.38%, and 27.49% and 16.73%, for spring and autumn tomatoes, respectively). The ETa of F2I2 was significantly lower in F1I3, F2I3, and F3I3 (12.63% and 15.98%, 18.15% and 9.50%, and 11.87% and 13.82%, for spring and autumn tomatoes, respectively). The WUE of F2I2 was significantly higher than F1I3, F2I3, F3I2, and F3I3 (26.44% and 25.97%, 23.36% and 12.27%, 23.05% and 12.33%, and 37.89% and 24.35%, for spring and autumn tomatoes, respectively). With decrease in F, the yield and WUE initially increased and then decreased; however, ETa exhibited an overall decreasing trend, in which the tomato yield of F2 (109.916.20 and 90368.06 kg/ha, for spring and autumn tomatoes, respectively) was higher than that of F1 and F3 by 5.27% and 3.24% and 19.31% and 11.30%, and the WUE was higher than that of F1 and F3 by 8.44% and 7.24% and 11.46% and 11.06%, for spring and autumn tomatoes, respectively. With the addition of I, the Y of spring tomato and autumn tomato was added at first and then reduced, in which I2 spring tomato and autumn tomato Y was higher than I1 by about 24.44% and 26.15% and also higher than I3 by about 1.64% and 3.06%. The WUE of spring tomato and autumn tomato was higher than that of I1 by about 8.44% and -5.21% and also higher than that of I3 by about 14.46% and 19.10%.
| Treatment | Spring | Autumn | ||||
|---|---|---|---|---|---|---|
| Y (kg/hm2) | ETa (mm) | WUE (kg/m3) | Y (kg/hm2) | ETa (mm) | WUE (kg/m3) | |
| F1I1 | 89898.31 ± 12173.48cd | 318.32 ± 16.73e | 28.26 ± 3.68bc | 74791.67 ± 10196.15cd | 206.26 ± 24e | 36.59 ± 5.92ab |
| F1I2 | 114602.01 ± 19370.81a | 364.43 ± 8.03cd | 31.47 ± 5.42ab | 95180.56 ± 17617.6ab | 275.01 ± 22.62c | 34.96 ± 7.84ab |
| F1I3 | 108739.06 ± 24907.83ab | 428.2 ± 10.58b | 25.43 ± 5.95cd | 92625 ± 11596.79ab | 317.75 ± 8.26a | 29.16 ± 3.7c |
| F2I1 | 90964.34 ± 14880.36cd | 265.59 ± 17.24f | 34.13 ± 4.15a | 76527.78 ± 13027.18cd | 198.19 ± 9.19e | 38.54 ± 5.95a |
| F2I2 | 119961.18 ± 15863.47a | 374.12 ± 15.82c | 32.16 ± 4.75ab | 97979.17 ± 12550.56a | 266.97 ± 7.57cd | 36.73 ± 4.83ab |
| F2I3 | 118823.08 ± 12774.65a | 457.08 ± 21.81a | 26.07 ± 3.12cd | 96597.22 ± 12447.91a | 294.99 ± 8.01b | 32.72 ± 3.85bc |
| F3I1 | 83258.23 ± 12514.06d | 267.46 ± 10.83f | 31.23 ± 5.25ab | 68333.33 ± 12007.99d | 195.36 ± 9.8e | 35 ± 6.07ab |
| F3I2 | 94097.43 ± 15084.14cd | 360.55 ± 8.52d | 26.13 ± 4.38cd | 83937.5 ± 10271.14bc | 256.91 ± 2.68d | 32.7 ± 4.21bc |
| F3I3 | 99024.6 ± 17708.7bc | 424.49 ± 8.34b | 23.32 ± 4.09d | 79638.89 ± 13283.92cd | 309.79 ± 9.94a | 25.77 ± 4.65c |
| F-value | ||||||
| F | 10.847 ∗∗ | 19.247 ∗∗ | 6.516 ∗∗ | 10.501 ∗∗ | 11.054 ∗∗ | 7.299 ∗∗ |
| I | 19.545 ∗∗ | 1089.676 ∗∗ | 18.539 ∗∗ | 23.832 ∗∗ | 610.180 ∗∗ | 18.901 ∗∗ |
| F∗I | 1.154 ns | 29.560 ∗∗ | 2.826 ∗ | 0.403 ns | 3.025 ∗ | 0.360 ns |
3.3. Optimization of Irrigation Frequency and Irrigation Amount Based on Tomato Quality, Yield, and WUE
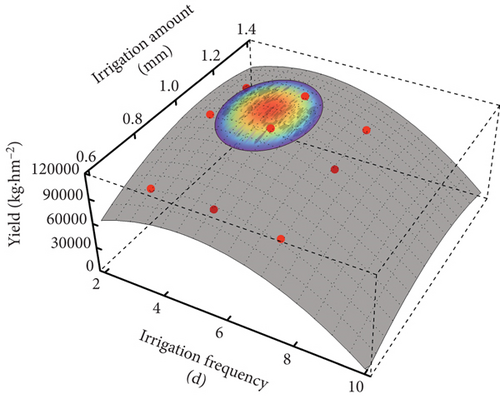
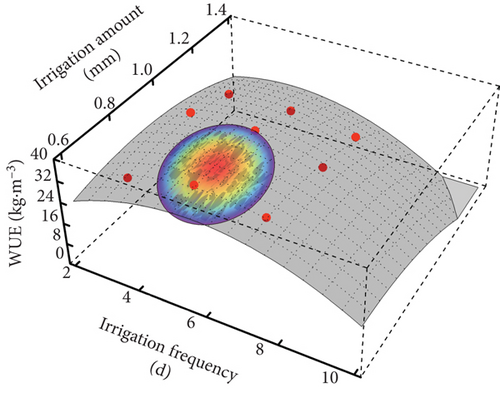
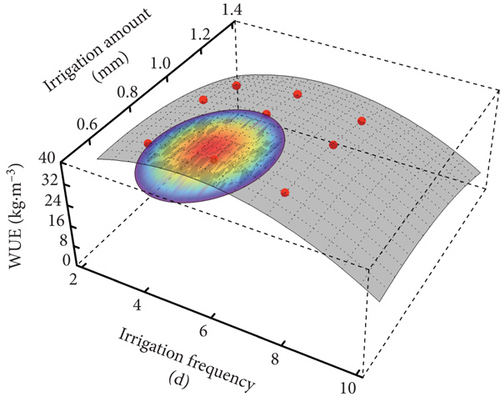
Considering the difference in irrigation frequency and irrigation amount of spring and autumn tomato, we used Mathematica 12.0 to analyse the experimental results of two tomato crops (Table 7). The quality of tomato was superior when it was irrigated once every 5 days, and the irrigation amount was approximately 0.8-0.9 Epan. Similarly, the yield reached its maximum value when it was irrigated once in 4–5 days, and the irrigation amount was approximately 1.1 Epan. Furthermore, the WUE reached the maximum when it was irrigated once in 5 days, and the irrigation amount was approximately 0.7-0.8 Epan. Thus, our study indicates that achieving the peak values of quality, yield, and WUE at similar irrigation frequency and amount is challenging. Further analysis indicated a 95% CI of the maximum ((comprehensive score of quality, 164.64-173.30 (spring) and 146.23-153.93 (autumn)), (yield, 113491.66-119464.90 (spring) and 93518.24-98440.25 (autumn)), (WUE, 32.02-33.70 (spring) and 36.91-38.85 (autumn)) of all 3 parameters as the acceptability interval to optimize all 3 parameters simultaneously. The shadow areas of quality comprehensive score, yield, and WUE overlap were found to increase gradually with increase in CI. The irrigation frequency and irrigation amount for the comprehensive score of quality, yield, and WUE at 95% CI of the maximum value have been shown in Figures 2 and 3, respectively. The comprehensive score, yield, and WUE of tomato were found to exhibit more than 95% of the maximum value simultaneously when treated with F2I2.
| Dependent variable | Regression equation | R2 | Combination of treatment for max z | |||
|---|---|---|---|---|---|---|
| x/d | y | zmax | ||||
| Spring | Comprehensive score | z = −33.17 − 3.48 x2 − 143.44 y2 + 37.72 x + 269.10 y − 4.85xy | 0.99 | 5 | 0.8 | 173.30 |
| Yield (kg/hm2) | z = −129210.31 − 2911.56 x2 − 150334.57 y2 + 28294.42x + 338919.45y − 2327.97xy | 0.93 | 4 | 1.1 | 119464.90 | |
| WUE (kg/m3) | z = −24.32 − 0.79 x2 − 41.25 y2 + 10.28x + 80.29y − 2.89xy | 0.89 | 5 | 0.8 | 33.70 | |
| Autumn | Comprehensive score | z = 37.88 − 1.98 x2 − 110.37 y2 + 18.57 x + 179.35 y − 0.08xy | 0.99 | 5 | 0.9 | 153.93 |
| Yield (kg/hm2) | z = −127690.85–1987.56 x2–155108.02 y2 + 2052.59x + 344115.78y − 3321.00xy | 0.99 | 4 | 1.1 | 99181.15 | |
| WUE (kg/m3) | z = −10.46 − 0.91x2–43.05 y2 + 9.33x + 71.19y − 0.87xy | 0.98 | 5 | 0.8 | 39.43 | |
- Note: x is the irrigation frequency and y is the irrigation amount, respectively.
4. Discussion
4.1. Effects of Irrigation Frequency on Greenhouse Tomato Quality and Yield
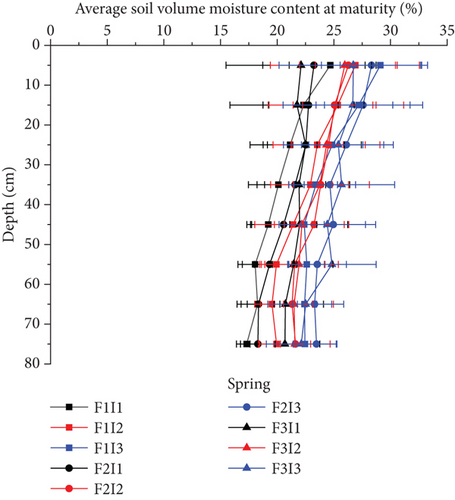
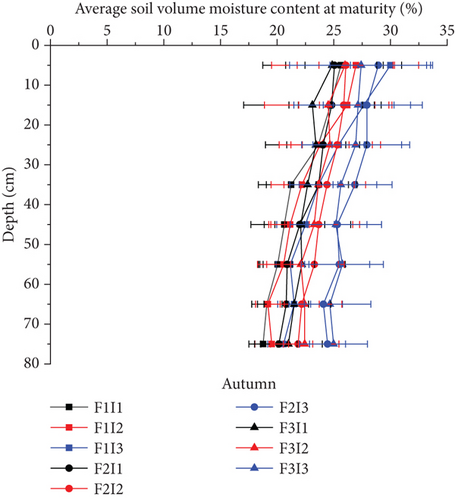
Many researchers believe that tomato grows ideally at high altitude, and the growth also requires constant soil water potential and high soil oxygen diffusion rate [22–24]. In this paper, the yield and WUE of tomato increased initially and decreased subsequently with decrease in irrigation frequency (Table 6) under similar irrigation amount. This fluctuation might be attributable to the fact that the high frequency small quota irrigation keeps water in a small soil volume, leading to water retention mainly concentrated in the shallow soil (0-20 cm) in MSPF. The shallow soil has high water-filled pore space (WFPS) and poor soil air permeability, which reduces the deep migration and distribution of deep crop roots, which is not conducive to the growth of tomato [25–27]. Low frequency and high quota irrigation increase the volume difference of soil dry and wet zone and prolong its duration, leading to persistent water stress in nonhumid area. Similarly, large quota irrigation easily increases soil compactness, reduces soil porosity and ventilation, and limits the increase in yield [27]. In this study, compared with the irrigation frequency of 3 and 7 days, the 5-day soil volume moisture content of the tillage layer was higher than that of 1.72% and 3.23% and 1.54% and 3.62% (for spring and autumn tomatoes, respectively, Figure 4) at during tomato maturity, indicating that irrigation once in 5 days effectively decreases unnecessary water evaporation and deep leakage. Wang et al. [28] showed that change in tomato yield with irrigation frequency occurs predominantly due to the change in SFW, which is inconsistent with our finding indicating that the change in SFW does not affect the yield (Table 2). This might be attributed to fruit thinning during fruit expansion. Difference in ETa in different irrigation frequencies was not found to be significant (Table 3). Furthermore, change in WUE caused by increase in irrigation frequency might be attributed to the change in yield (Table 6). Our findings are not consistent with those of a study by Jacob Fara et al. [12] that demonstrated superior yield and WUE of drip irrigation with 7-day irrigation compared with those of 5-day irrigation. The difference in our result may be attributed to the differences in physical and chemical characteristics of the soil [29]. In addition, the soil before planting tomato was treated with a 60 cm deep loosening tillage by Jacob Fara et al., which could have changed the physical properties of the soil, improved its aeration and water storage capacity, and reduced the effect of moisture stress on tomato growth [30, 31].
Liu et al. [2] demonstrated a decreasing trend in the tomato yield of drip irrigation with decrease in irrigation frequency, which is inconsistent with our finding indicating that the tomato yield of MSPF initially increases and subsequently decreases. The difference could be attributed to different methods used for controlling the irrigation frequency. In the study conducted by Liu et al., cumulative evaporation was used to control the irrigation frequency for tomato yield, in which the cumulative evaporation of the highest irrigation frequency was 10 mm, the irrigation frequency during the growth period was 30 times, and the irrigation amount was 210–250 mm. In this paper, the frequency was controlled by time, the highest irrigation frequency was 3 days, the irrigation frequency was 33 times during the growth period of tomato, and the irrigation amount was 150–240 mm. Soil moisture, as the medium of nutrient transformation in soil and nutrient uptake by plant roots, has a direct relationship with fruit quality [2]. When irrigation was based on cumulative evaporation, it was noticed that the higher the irrigation frequency, the smaller is the amount of single irrigation and the smaller is the soil wetting body. Soil drought stress could also be easily increased. However, when the irrigation frequency was properly reduced, the amount of single irrigation could be increased and the volume and duration of soil dry and wet areas could be adjusted. Further decreasing the irrigation frequency provides a disadvantageous place for microbial and enzyme activities, resulting in obvious and long dry and wet areas that last longer, which is not conducive to the growth of tomato. Previous studies have found that an appropriate irrigation frequency could effectively alleviate soil drought and water stress, promote the production of photosynthetic products in the form of sucrose and transfer to reproductive organs, and increase the TSU of tomato [2], which might be one of the reasons for superior TSU of tomato fruit with 5-day irrigation frequency in our study. Few researchers have found that the SFW of tomato increases with increase in irrigation frequency [32]. However, we found lesser tomato SFW with the 3 days compared with that of the 5-day irrigation frequency. The highest irrigation frequency in a study by Sensoy was based on cumulative evaporation of 6 d, while it was of 3 d in this study. Additionally, the soil moisture was small, which could have easily caused the soil drought stress to limit the elevated SFW of tomato. The content of TSS in tomato was found to be higher after 5 d irrigation frequency, which might be due to the fact that the TSS of tomato pulp is composed of 65% sugars (sucrose and hexose), 13% acids (citric acid and malic acid), and 12% other secondary components, including phenols, amino acids, soluble pectin, and ascorbic acid. The percentages of soluble sugars and organic and soluble solids were 55% and 11%, respectively. The TSS of tomato increased with an increase in irrigation frequency [2, 33, 34].
4.2. Effects of Irrigation Amount on Greenhouse Tomato Quality and Yield
Previous studies have found that soil water stress restricts crop root morphological development and reduces crop absorption and utilization of soil water and nutrients, and tomato fruit weight decreases significantly. Lower tomato fruit weight is also one of the main reasons for tomato yield reduction [35, 36]. In this study, the yield of spring and autumn tomatoes increased when the irrigation amount increased from I1 to I2, which may be due to the increase of moist body per unit irrigated area of soil tillage layer, which reduced the water stress of crop roots and increased the ability of crops to effectively absorb and utilize nitrogen. At the same time, tomato is most sensitive to soil water shortage during flowering and fruit expansion [37]. The existence of the above reasons may be one of the reasons for the reduction of tomato yield in this paper. However, when the irrigation amount increased from I2 to I3, the tomato yield did not increase but decreased slightly, which may be due to the excessive water in the soil, the increase of soil water-filled porosity, and the decrease of soil gas exchange. Limit the activities of soil microorganisms and enzymes and reduce the yield of tomato [23, 38]. In summary, the results showed that I2 treatment was a suitable irrigation amount for stable yield and yield increase of tomato in this region. In this study, it was found that the higher the irrigation amount, the higher the soil water consumption, probably because the higher irrigation amount was easy to increase the ineffective wetting body in the cultivated layer, the soil surface water content was also higher, and the soil water ineffective evapotranspiration increased; at the same time, irrigation directly increases soil water content, and soil moisture is the main factor for maintaining the best water driving force and leaf stomatal function. Plants with lower drought stress send signals to the aboveground parts, which can increase transpiration and thus increase plant water evapotranspiration [36]. Finally, the ETa of spring tomato and autumn tomato was added by 53.80% and 53.84% (Table 6) with the increase of irrigation amount from I1 to I3. It was consistent with the conclusion that there was a positive correlation between tomato irrigation and water consumption studied by Wu et al. [39]. The yield increase of spring tomato and autumn tomato was lower than the ETa added of spring tomato and autumn tomato by 56.08% and 48.49%, which may be one of the reasons why the crop water use efficiency of spring tomato and autumn tomato decreased by 20.07% and 16.99%. Sensoy et al. [15], Wu et al. [39], and Zhu et al. [40] studies found that the crop water use efficiency of tomato decreased when the irrigation amount under drip irrigation added from 0.5 times of evaporation to 1.0 times of evaporation, indicating that the effect of MSPF on the crop water use efficiency of tomato was the same as that of drip irrigation.
Agbna et al. [16] and Ouyang et al. [32] studies showed that the transverse diameters and vertical diameters of tomato under drip irrigation increased first with the increase of irrigation water, which was consistent with the conclusion of MSPF in this study. Previous studies have found that lower irrigation water is easy to cause soil drought stress, and the resistance of phloem sap transport to fruit in crop roots under drought stress reduces the flow from xylem to fruit and increases the solute concentration of fruit juice [5, 34, 41]. At the same time, drought stress could increase the activities of sucrose synthase and sucrose phosphate synthase and promote the conversion of sucrose to fructose and glucose [16] and further increase the sugar content of tomato fruit, which may be the reason why the TSS and TSU of tomato decreased with the increase in irrigation amount under MSPF. This conclusion is consistent with that of Xing et al. [42], Sensoy et al. [15], and Hao et al. [17], indicating that the effect of MSPF on the flavor and nutrition index of tomato fruit is the same as that of drip irrigation. The Wang et al. [43] study showed that the contents of TSS, SP, and VC in tomato fruits under drip irrigation increased at first and then decreased with the added of irrigation amount, which was not consistent with the conclusion of this paper, which may be due to the difference of crop varieties and the different ways of controlling irrigation during tomato growth period.
5. Conclusions
In this study, the Φ20 standard pan evaporation was used as a reference to monitor tomato quality, yield, and WUE under different combinations of irrigation frequency and irrigation amount in MSPF. Our results indicate initial addition and subsequent reduction in SFW, TD, VD, TSS, SP, TSU, VC, L, SAR, yield, and WUE of tomato with decrease in irrigation frequency. Similar increased trend was observed in SFW, TD, VD, SAR, and yield of tomato with increase in irrigation amount; however, TSS, SP, TSU, VC, L, and WUE exhibited an overall decreasing trend. Superior quality and significantly higher yield of spring and autumn of tomato in F2I2 were observed compared with F1I1 (approximately 33.44% and 31.00%, respectively), F2I1 (31.88% and 28.03%, respectively), F3I1 (44.08% and 43.38%, respectively), and F3I2 (27.49% and 16.73%, respectively). The WUE of F2I2 growing during spring and autumn was also significantly higher than F1I3, F2I3, F3I2, and F3I3 (approximately 26.44% and 25.97%, 23.36% and 12.27%, 23.05 and 12.33%, and 37.89% and 24.35%). On the basis of spatial analysis, the comprehensive score, yield, and WUE of F2I2 tomato were predicted to simultaneously reach more than 95% of the maximum, which is consistent with the earlier studies on comprehensive evaluation of yield and WUE.
Conflicts of Interest
The authors declared that they have no conflicts of interest to this work.
Acknowledgments
This work is supported jointly by the Key Research and Development Program of Shaanxi (2022NY-191), Ninth batch of key disciplines in Henan Province - Mechanical Design, Manufacturing and Automation (JG [2018] No. 119), Natural Science Foundation of China (No. 41807041), Science and Technology Program of Xi’an (20193052YF040NS040), Fundamental Research Funds for the Central Universities (GK202103129).
Open Research
Data Availability
The data used to support the findings of this study are available from the corresponding author upon request.


