Establishing Reliable Slope Stability Hazard Map Based on GIS-Based Tool in Conjunction with Finite Element Methods
Abstract
This paper describes the establishment of a slope stability hazard map based on a GIS-based tool in conjunction with the finite element method (FEM). In this regard, Advanced Space-borne Thermal Emission and Reflection Radiometer (ASTER) images were modeled using the Weight of Evidence (WOE) technique. The previous simulation was therefore validated using visual observations and FEM (Phase 2D and SLIDE). The above techniques made it possible to develop and validate the reliable slope stability hazard map with the use of a case study. The results show that the established hazard map correlates very well with visual observation and stability assessment performed using FEM models. The map categorises slopes based on their susceptibility to failure; however, it has been discovered that most of the slopes that rated highly susceptible were located along or closer to geological features (faults) or streams and were at high elevations. Similarly, the SLIDE model has been utilised to perform the safety factor of the identified slope and the model has shown that those slopes were not stable. Furthermore, the influence of geological features was further studied using the Phase 2D model and it was discovered that the features contributed largely to the displacement of the rock mass with time, and as a result, instability was expected. The overall conclusion of the study is that the combination of geotechnical and GIS-based tools appeared to provide an insight in categorising the hazard of slopes located within mountainous terrain.
1. Introduction
Rockfalls are the most common type of slope movement that makes rock cuts along transportation corridors in hazardous mountainous regions [1]. The analysis of the stability of rock slopes was therefore performed primarily to assess their safety [2–5]. However, the selection of the analysis tool depended on the conditions of the site and its expected mode of failure [6, 7]. The challenge has been in finding adequate tools that can describe failure as a nonlinear phenomenon involving solid-like and liquid-like behaviors. Traditionally, the analysis of rock slope stability revolves around the concept of the Factor of Safety (FoS). The FoS can be defined in three different ways: limit equilibrium, force equilibrium, and moment equilibrium [8]. It should be noted that the FoS of a rock slope is usually assessed through a detailed comparison of the calculated FoS against the acceptable FoS. Hoek and Bray [9] argued that the acceptable standard threshold value of FoS is 1.5 for road rock slopes before failure occurs. Indeed, limited equilibrium methods are known to suffer from the uncertainty associated with estimated input parameters among other factors. To overcome this, probability methods are usually resorted to [10]. Most of these methods replace FoS values with a probability of failure as a measure of slope stability (see [11–17]), but the probability methods were also denoted to present some errors.
To the best of our knowledge, studies that integrate both geotechnical techniques and GIS techniques are very rare. However, this study sought to combine the two techniques to solve geotechnical problems. ASTER satellite data have been successfully employed to evaluate slope instability. The following are the most relevant studies: Crowley et al. [18], Liu et al. [19], Santini et al. [20], Roy et al. [21], and Dou et al. [22]. Their studies are briefly summarised here in a chronological order. Crowley et al. [18] explored remote sensing techniques in the identification of potential rockfalls. A critical comparison of the remote sensing datasets was performed, and the study revealed the possibility of remotely sensed data in the evaluation of the altered rock masses that could result in potential volcanic debris flow sources. Liu et al. [19] have studied the Three Gorges of China—rating it as an area of high to low slope instability hazard. The study presented the use of ASTER imagery as a useful tool to extract the topographic and spectral data which could be used to develop a slope stability hazard map of the area. Santini et al. [20] conducted a critical investigation on the influence of varying terrain procedures techniques toward the final results of slope stability prediction using Terra ASTER, DEMs. The DEMs procedures were revealed to affect the implementation of the countermeasures against slope stability. Regardless of their findings, their study denoted remote sensing as a useful tool to predict slope instability. Roy et al. [21] were able to produce slope instability susceptibility maps with the help of remote sensing data. Four classes of susceptibility to slope instability occurrence were defined for the purpose: low, medium, high, and very high. The results of their study highlighted areas of the high probability of slope instability. Dou et al. [22] borrowed the analysis procedure initially performed by Roy et al. (2019). Their results also highlighted areas of high as well as medium to low slope instability susceptibility. The study by Dou et al. [22] complements that of Roy et al. [21] and in a sense builds confidence in the proposed LSM technique. Finally, Dou et al. [22] concluded that their processing technique for ASTER data can be extended to areas experiencing slope instability due to both rainfall and earthquake.
In this paper, FEM in conjunction with the ASTER was explored in the analysis of slope instability. The latter was to supplement FEM with actual data and enhance the understanding and prediction of the mechanism and recurrence of rock slope instability. Thulamela Municipality road in the Limpopo Province of the Republic of South Africa was identified as the case study for this research. The rationale for using Thulamela Municipality road in this study was cognisant of the background that the FEM- and GIS-based tools could bring value to the field of slope stability. The proposed joint techniques have the potential to describe the mechanism of slope failure on large scale and can be applied in any country. It is crucial to indicate that the combination of ASTER and FEM is not used widely in the field of rock mechanics. As such, there is enough room to explore the technique and attempt to provide a better description of the slope stability problems. The added value of the endeavor lies in the development of a reliable slope susceptibility hazard map based on the given case study. Much of contemporary slope stability analysis is based on GIS-based tools and yet relies on the large deformation and environmental conditions of the study that occurred in time series while neglecting the mechanical behavior of solid mass [23, 24].
The slope susceptibility maps are generally validated based on visual observation. However, there are limited studies that strive to combine the GIS-based tools with a geotechnical simulation incorporating mechanical behavior of the solid mass. Hence this study attempts to bridge this gap by combing FEM techniques with GIS-based tools to develop reliable slope stability hazard map using the Thulamela Municipality (R523) (see Figure 1) as a case study. The R523 road is situated in the rugged topography of the Soutpansberg Group. This geological group is partially buried beneath sedimentary and volcanic rocks of different thicknesses. The group is dominated by large faults and joints [25, 26] thereby creating a discrete [27] and blocky rock mass especially in Thulamela [28–30].
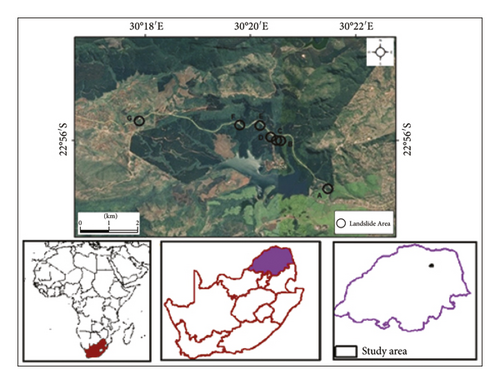
The scope of the study is proscribed to 2 national roads set within the Thulamela Municipality: R518 and R523. Thulamela Municipality is a class B municipality placed within the Vhembe District in the region of Limpopo Province (see Figure 1). The Kruger parkland forms its eastern boundary whereas the southern and south-western facet is bordered by the Makhado Municipality. As the smallest of the four municipalities in the district, Thulamela is spread over about 2 642 km2. It is, however, the largest in the province in terms of population size. The R523 road is situated in the rugged topography of the Soutpansberg Group. This geological group is partially buried beneath sedimentary and volcanic rocks of different thicknesses. The group is dominated by large faults and joints thereby creating a discrete and blocky rock mass especially in Thulamela [20–22, 31].
2. Research Approach
2.1. Visual Observations and Measurements
Field observation was one of the aspects used to identify the fundamental problems associated with slope instability within the selected study area. Nevertheless, the field observations were based on identifying soil types and the extent or dimensions of the slope instability along Thulamela Municipality roads.
2.2. Remote Sensing-Based Measurement
Rock slope instability is commonly noticed through the disturbance caused by the vegetation coverage. This can therefore be used as a proxy for the extent and recurrence of rock slope instability. The remote sensing techniques of Normalized Difference Vegetation Index (NDVI) and WOE were used in this paper. Relevant details of their implementation are described below.
2.2.1. Normalized Difference Vegetation Index
The NDVI involved two main procedures: the compilation on one hand as well as processing and classification of ASTER data on the other hand. The NDVI technique was used to detect the change in the vegetation of the study area with time. ASTER images were used to perform the analysis of the NDVI. These images are rendered with pixels of 15 m resolution capable of reproducing small change taking within the area.
The dataset was from the ASTER L1T which is a Precision Terrain Corrected Registered At-Sensor Radiance Product. Two ASTER scenes, from Path 169 and Row 76, acquired in November 2004 and 2017 were retrieved from https://lpdaac.usgs.gov. The database is maintained by the NASA Land Processes Distributed Active Archive Center (LPDAAC) at the USGS/Earth Resources Observation and Science (EROS) Center, Sioux Falls, South Dakota. Only the bands in VNIR spectral region were used in this study. The VNIR region was selected because its spectral resolution is capable of detecting vegetation conditions. Moreover, its spatial resolution is deemed appropriate for the level of spatial details required for the type of land in the study area (Table 1).
| Spectral region | Band number | Wavelength range (µm) | Spatial resolution (m) |
|---|---|---|---|
| VNIR | 1 | 0.52–0.60 | 15 |
| 2 | 0.63–0.69 | ||
| 3 | 0.78–0.86 |
2.2.2. Construction of the Slope Stability Susceptibility Maps
Firstly, the spatial analysis tool ArcGIS version 10.5 was used to reclassify the ASTER datasets in terms of slope, aspect, land cover types, and elevation on a scale of 1 to 5. The lithology, stream, road, and lineament were acquired as either polygons or polylines; therefore, their subsequent raster maps were reclassified to create ranked maps on a scale of 1 to 5. In other words, the subclasses of each thematic layer were assigned a value between 1 and 5. A subclass assigned a value of 5 was considered to be the most influential one and the least influential subclass was assigned a value of 1. For instance, the slope angles between 0 and 6°, 6 and 12°, 12 and 18°, and 18 and 68° were assigned values of 1, 2, 3, and 5, respectively. Each thematic layer was given a value based on its significance as far as its contribution to slope stability occurrence was concerned. Thematic layers that were deemed to be more significant were given a higher value. For example, the slope was given a weight of 8 because it was considered the most important out of the eight thematic layers used. The entire exercise is summarised in Table S1 (supplementary material S1) for the eight thematic layers. The weight of the causative factor (or thematic layer) was then multiplied by the rank of subclasses in that thematic layer (see Table S1). Finally, the intermediary result was summed for all eight thematic layers to produce the slope stability susceptibility index.
2.3. Validating Hazard Mapping Analysis
When validating the established hazard map across the study area, some of the factors which were documented to contribute largely to the high susceptibility of the slope were further analysed using numerical modeling techniques. In this regard, two numerical approaches which are all continuum approaches (Phase 2 and SLIDE 2D) were utilised. Detailed methodologies followed for each numerical model and are outlined in the following subsection.
2.3.1. SLIDE Model Procedure
It is noteworthy to state that SLIDE was utilised to estimate the FoS values of the slope for several scenarios. The FoS values can be computed following Bishop’s model [27]. In terms of model building, the exercise starts with the creation of a new project. Similar to other modeling platforms, the new project required the definition of the model limitation in XY coordinates. For that, various X and Y coordinates defining the region were entered. The ultimate goal of this step was to draw the model of the region. Upon generating the boundaries of the model, the actual initial conditions of the simulation are defined next for the project. Inputs such as the statistics associated with groundwater conditions, the computational methods, and the failure directions were captured. The correct values of input data and the appropriate selection of procedural approaches were of paramount importance. This is because the exercise determined how realistic the computer model of the actual rock mass associated with the study area would be. For a thorough interpretation of the results, several methods (Bishop simplified, Corps of Engineers’ #1 and 2, the GLE/Morgenstern Price method, Janbu’s simplified and corrected Lowe-K aralias, Ordinary, and Spencer) of analysis were considered (see studies such as [29, 30, 32–36]). The motivation was to compare various approaches to the problem while corresponding results were interpreted based on the performance of each approach.
2.3.2. Phase 2 Model Procedures
Phase 2 numerical model was utilised to simulate stress, strain, and shearing of the material as the road is being developed. Three stages of road development were generated and the above-mentioned parameters were simulated and compared as the stages progressed. Nevertheless, the model involves boundaries construction, mesh generation, boundary conditions, adding traction, field stress, excavating each stage, and lastly simulation. Like all the previous tools, a new project was launched for each simulation scenario. The next step was to generate the limits of the road excavation and rock face slopes using existing coordinates of the cross-sectional view of the road. The required coordinates were inputted based on information collected on the field and in the various archival maps of the region. Next was to define the project settings, that is, the initial and boundary conditions of the model to be used once the Phase 2 solver was launched. In addition to this, the number of iterations and the convergence criteria of the numerical computation were decided upon. Upon setting up the Phase 2 solver, it was necessary to enter the boundary geometry and conditions. This critical step was also the opportunity to define the boundary functions of the excavation. Boundary functions specifically refer to the loading conditions of the site.
At this point, model discretization and meshing were to follow. Based on the quantity of the parameters required of the FEM solution, graded meshing was used for the vicinity of the excavation to have finer meshes. The meshing element was a 3-noded triangle as this type tends to be numerically stable. The next step was to define the field stresses at play around and within the rock mass model. Since the model was a surface excavation, the gravity stress field needed to be defined. Then, the vertical and horizontal distribution of the stress field was set at 1.5 throughout. It is well established that surface excavation experiences high horizontal stresses than vertical stresses; therefore, the K-ratio (horizontal-to-vertical stresses ratio) was set as 1.5. The remaining entries were captured based on the measured properties of the corresponding type of material. The last step before the simulation model could be run was to assign appropriate properties corresponding to the various layers making up the road. A similar assignment could be done for the various stages of road construction. Finally, a choice of the type of outputs to be made available for later interpretation was made as indicated. Once the solver had converged, the results of the model could be analysed, refined, and reported for the various stages of road construction.
3. Results and Discussion
The results are divided into three main thematic sections excluding visual observations. The first section discusses the results of the NDVI. The next section identifies the causative factors of slope instability before the slope susceptibility maps are produced. The last section is centered on exploring the safety factor of identified slopes and further the analysis by looking into the effect of road construction on the stability of the road walls by means of the FEM simulation. The latter focused on the strength factor of the material as road construction progressed to analyse the effect of geological structures on the stability of the slope. The results of the paper are outlined below.
3.1. Visual Observations and Measurements
Based on the observational point of view, the study area was noted to be dominated by several slope failures that have occurred mostly along with the road cuts. However, most of this slope instability was pronounced by red clay soil moving from the upper section of the slope to the slope toe. Furthermore, the slope was observed to failures along with a similar wedge pattern in which two tension cracks were observed to govern the failure throughout. Several streams were also cutting across the affected area. Besides the natural processes, it appears that the road has been developed along the mountainous area in which the road has disturbed the topography and slope stability of the area. Several slope cuts have been left unsupported after road construction. Following that it has also been observed that the road was developed through the use of mechanical blasting in which blasting itself usually creates fractures along with the rock mass or solid mass while weakening the material. Soil properties of the study area were further studied for numerical inputs and classifications.
3.2. Normalized Difference Vegetation Indices in the Selected Areas
The NDVI values of nine pixels representing slope instability area A are presented in Figure 2(a). Based on literature review, high values for the year preceding slope instability occurrence (2004) are noted with an average value of 0.498. Slope instability area B attained NDVI values exceeding 0.400 for the year 2004 indicative of good vegetation condition. On the contrary, most pixels in 2017 showed the deterioration of vegetation health with the exception of two pixels in which the NDVI value was noted to increase between 2004 and 2017 (compare Figure 2(a) and 2(b)). Eight pixels in the slope instability areas C and D had high NDVI values in 2004 which subsequently dropped in 2017. As far as area E is concerned, low NDVI values are noted in 2017 relative to 2004. In 2004, area F was characterized by a very healthy and productive vegetation cover with an NDVI as high as 0.806. However, this pixel recorded the lowest NDVI of –0.578 in 2017 which suggests the prevalence of a land cover other than vegetation. Slope instability area G attained average NDVI values of 0.054 and 0.182 for the years 2004 and 2017, respectively.
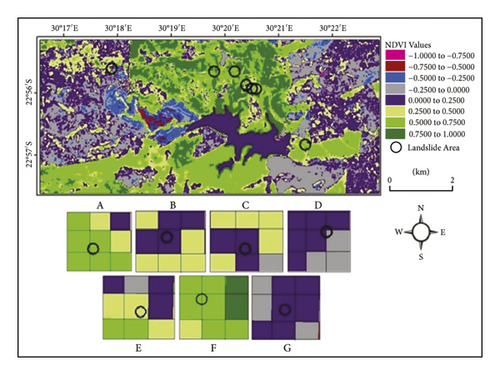
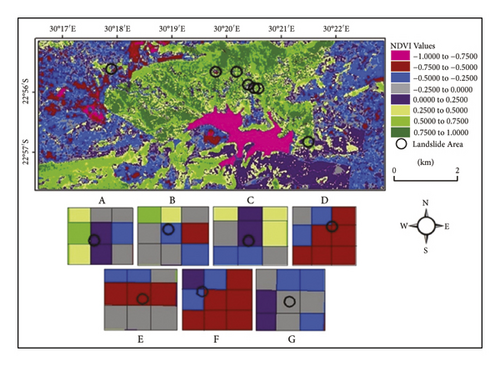
What is clear from the above analysis is that slope instability in the Thulamela Municipality is well pronounced as evidenced by the true-color satellite images of Figure 2(a) and 2(b). Furthermore, the NDVI values indicate a worrisome deterioration of the vegetation and an expansion of slope instability localities over time. The latter can be attributed to the annual reactivation of slope instability events in the active areas. The Western and Eastern parts of the study area have also shown a decline in NDVI values between 2004 and 2017 (Figures 2(a) and 2(b)). These parts coincide with pixels classified as built-up land and bare soil/rock. They are indicative of human activities such as deforestation, farming, and expansion of residential or commercial areas which can trigger slope failure [35, 36]. This is true of the region of the current case study in that small-scale farmers frequently employ slash-and-burn techniques before December. The preparation of the fields for farming corresponds to a period of heavy rainfalls. This, in turn, increases the likelihood of slope stability.
3.3. Causative Factors Influencing Slope Instability
The slope steepness within the study area was simulated using the WOE model. The results enabled the location of all active and postslope instability along the slopes of steepness greater than or equal to 18° (see Figure 3(a)). The next step was to analyse whether the orientation of the slope was a determining factor in the orientation of the slope collapse. Slopes were characterized to be oriented South-East, South-West, West, South, and North-West (see Figure 3(b)). The outputs also revealed that active slope instabilities are oriented randomly with no apparent pattern. Consequently, it was difficult to ascertain whether slope orientation influences slope instability. Following further analysis, it was noted that all active slope instabilities were located at the intersection of two slope orientations as evidenced in Figure 8. The geographical elevation was also analysed with the WOE modeling framework. The results demonstrated that the active slope instability happens at an elevation ranging from 900 m to 1100 m above sea level (see Figure 3(c)). This strongly suggests that the selected study area in the Thulamela Municipality is a high elevation or mountainous area. In addition to this, elevation and steepness contribute greatly to the stability of slopes.
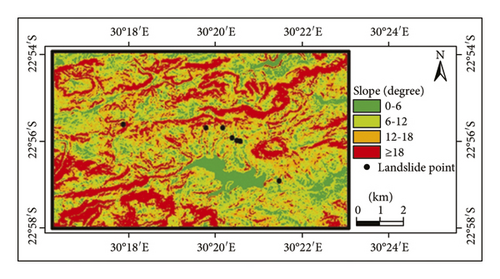
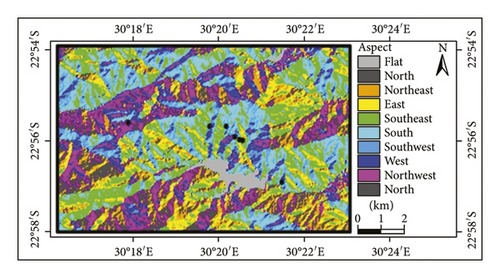
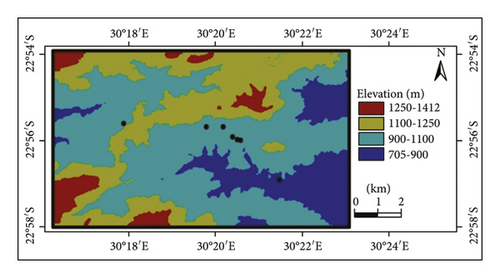
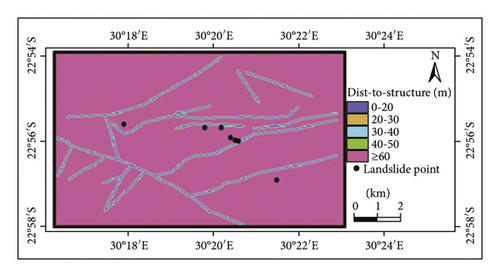
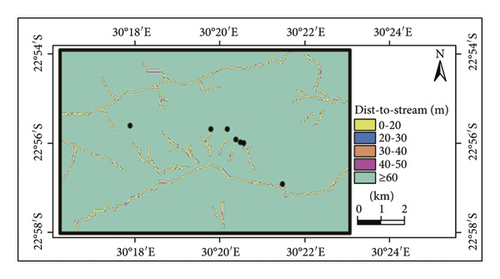
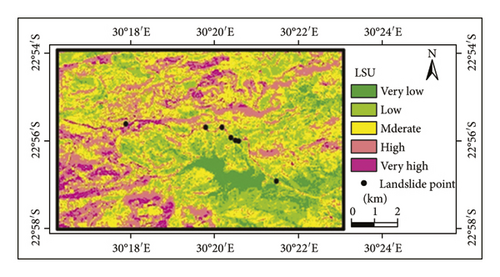
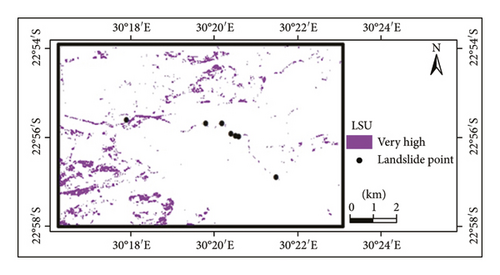
Remote sensing data were finally utilised to study the contribution of geological features and water streams to the occurrence of slope instability in the area. The results of the endeavor are illustrated in Figure 3(d) and 3(e). Figure 3(d) shows the evidence of several geological features of different sizes cutting across the study area. All active and postslope instability are either located along the boundary or on the geological feature. This finding now confirms the assumptions made in the previous section that geological features influence the recurrence of slope instability in the area. These geological features appear to generate weak zones and activate movement during the heavy rain season. Furthermore, the shear strength of the material and friction along the boundary of geological features are expected to gradually decrease during heavy rainfall and result in slope stability. It is often assumed that a geological feature cannot trigger slope instability alone. Water pressure or any other mechanism contributes to slope instability. In line with this, water bodies or streams cutting across the area were identified as shown in Figure 3(e). Here also, the presence of streams seems to suggest some correlation with the locations of slope stability, although the road constructed has disturbed the path and flow of streams that may only affect slope instability through the overlain existing geological features.
This raises the need to discuss slope stability susceptibility mapping. As already indicated in the literature, slope stability susceptibility mapping requires several input parameters. In this section, the following were included: slope angle, geological features, and rock types. Thus, the results show that indeed all selected active and postslope instability are highly susceptible to the occurrence of the slope instability (see Figures 3(f) and 3(g)).
The findings in Figure 3(f) and 3(g) supplement and consolidate the outcomes presented in previous studies conducted within this field of study. This gives enough ground to consider that steepness, geological features, streams, and improper road construction are causative parameters of slope stability in the region. It can be argued that geotechnical and remote sensing techniques can be used jointly for a richer understanding of slope stability.
3.4. Numerical Simulation on the Effects of Geological Features on the Stability of the Slope
The sections below discuss the results of the numerical simulation using two continuum approaches (SLIDE and Phase). In this regard, the SLIDE model was presented first and followed by Phase 2D. The SLIDE model was anticipated to simulate FoS of the selected slopes, while Phase 2D was anticipated to simulate the effect of geological structures on the stability of the slopes.
3.4.1. Slope Stability Analysis by Simulating Factor of Safety Using SLIDE 2D
Indeed, the FoS of the selected slope was conducted. Therefore, four methods were incorporated for the analysis. Such methods included Bishop’s simplified method, Janbu’s simplified method, Spencer’s method, and the Corps of Engineers’ Number One method. In Figure 4(a)–4(d), it was found that the FoS of the slope ranged between 0.949 and 1.19 for all computation methods considered. The simulated minimum and maximum FoS values rated slopes in the area as unstable or prone to failure. It appeared that the presence of geological structures and composition of the material as well as the steepness of the slope contributed largely to such unstable safety factors of the slope. Nevertheless, the results of the simulation correlated very well with the developed hazard rating map of the study area. This affirmed that the area modeled is one of the points denoted to be highly susceptible to slope instability. It could be concluded that the two techniques appear to provide similar results; however, these results were also validated in the study area wherein a portion of the slope has been experiencing slope instability (see Figure 5(a)–5(d)). The slope is dominated by loose rocks, fractured rock mass, bedded rock mass, and faulted rock mass. As a result, the composition of this rock mass reduces the stability of the material by lowering the strength and resistance between the rock units and also by allowing small wedges to be unlocked easily from the slope. Thus, it can be affirmed that the results of the model provided a certain degree of reliability.
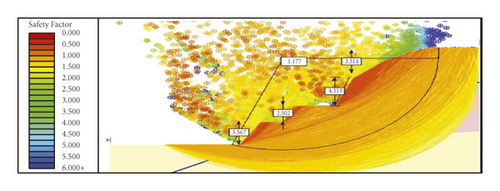
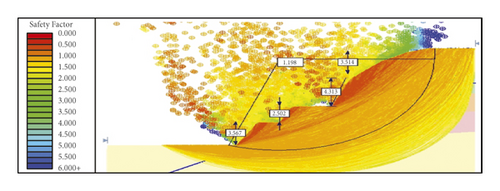
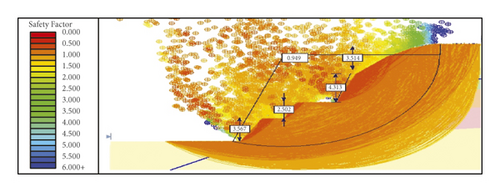
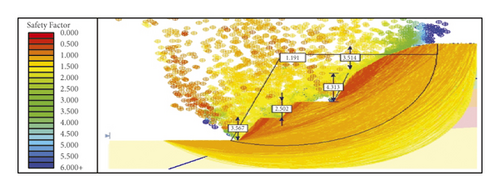
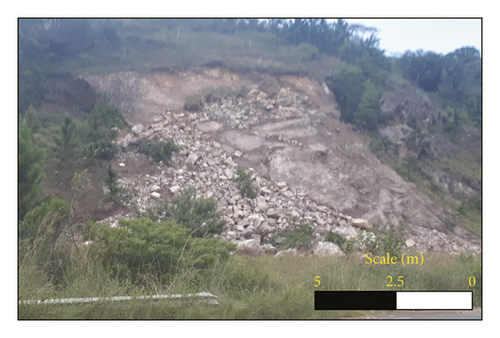
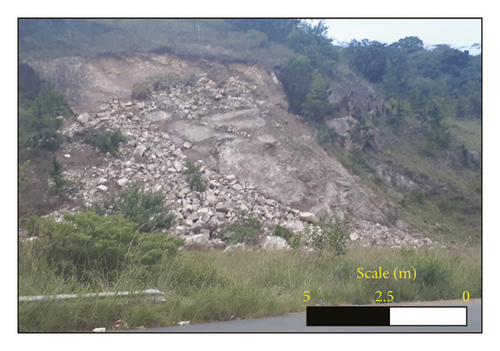
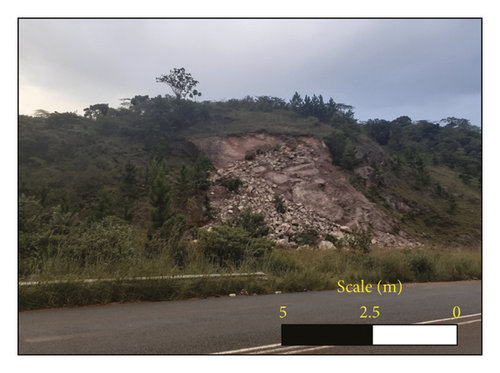
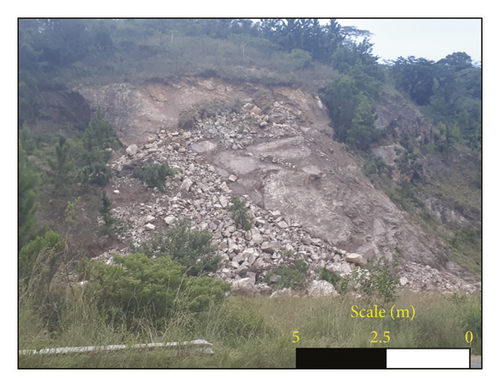
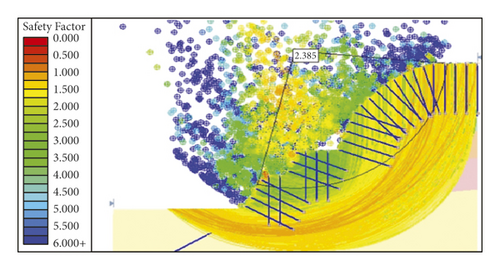
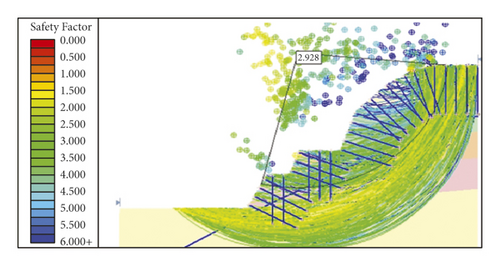
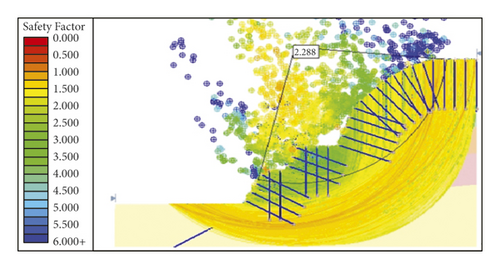
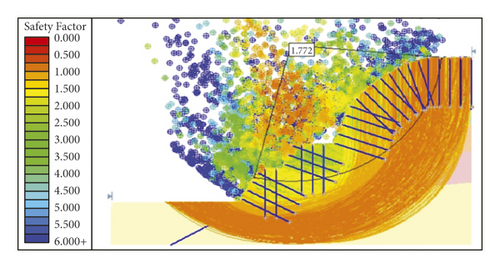
In Figure 5(a)–5(d), the slopes appeared to be unstable and governed by several geological features and disintegrated rock mass. It appears that the composition of the rock mass and slope properties could have been among the contributing factors towards the recurrence of slope instability in the study area. Simulation results also make sense when compared to empirical observations. More simulations were made with a support system installed across the slope and the primary purpose of this simulation was to suggest a method or technique that could reduce the recurrence of rockfall in the study area. Fair enough, the simulation has shown gradual improvement in the stability of the slope as support systems (roof bolts) are installed across the slope with the spacing of 1 m apart. In Figure 6(a)–6(d), FoS between 1.7 and 2.9 has been simulated. The simulated FoS factor suggested that the slope is stable immediately after the support system is installed. In practice, when the support system is installed across blocky and faulted rock mass, the support system usually generates a bond between rock units, and as such, the stability of the slope is increased.
Although the above-mentioned model can be used to assess the stability of the slope, it can also simulate the influence of geological structure on the stability of slope relative to road construction stages. Similarly, the first model cannot provide the impact of road construction on the stability of road cuts or slopes. Therefore, the Phase 2D model was suggested to complement the previous method and validate some of the suggestions denoted by the hazard map. Detailed results on the simulation of strength factor and effect of geological structures are discussed below.
3.4.2. Numerical Simulation on the Effects of Geological Features on the Stability of the Slope
The focus of this section was to simulate the strength factor and total displacement of the road material. The Phase 2 simulator was used to explore the influence of geological features on rock stability. The strength factor and the total displacement of the road slope were both simulated as the road excavation progresses. Simulations were implemented as a series of time steps as outlined in the sections below.
3.4.3. Strength Factor
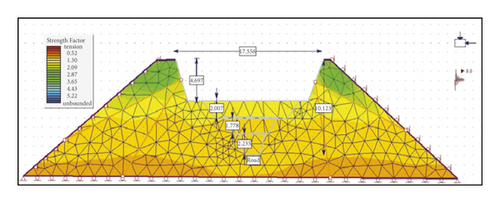
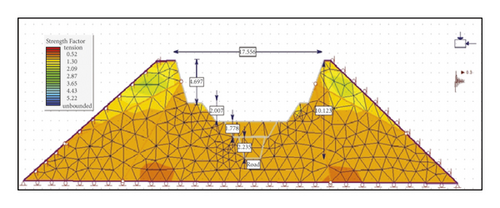
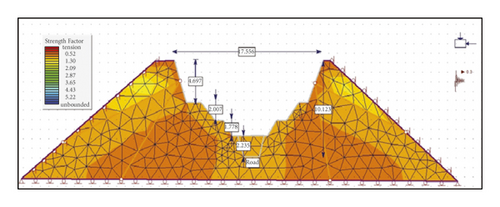
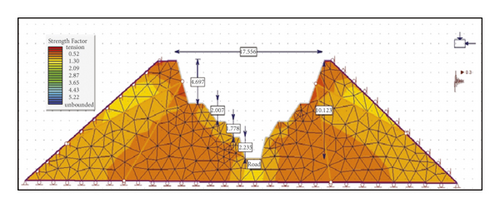
This section looks at the relationship between strength factor and slope instability susceptibility at various road construction stages. To proceed, four joints are created to cut across the rock mass and mimic the creation of cracks as a result of rock blasting. To capture the progress of road construction, the simulation model is set at different time steps corresponding to each stage as shown in Figure 7(a)–7(d). The numerical results in Figure 7(a)–7(d) suggest that the strength of the rock mass along the road wall is expected to drop as road excavation progresses. The strength of the rock mass also appears to decrease around the four joints cutting across the rock mass. As a result, the rock mass may disintegrate and generate blocks and unstable ground conditions. The observations and ASTER-based analysis finally support the fact that geological features play a major role in the stability of slopes. A close look into the relationship between the simulated strength factor and slope instability susceptibility shows that slope instability is most likely around the slope cuts and the four joints. The joints reproduce the effects of road construction on the steep mountainous areas characteristic of the Thulamela Municipality. So, as the road construction progresses, the computer model shows a gradual reduction in rock mass strength. At the same time, slope angle and depth increase and lead to an unstable rock face. The model finally shows that the presence of geological features along the slope has the potential to generate blocky and weak zones throughout the slope.
3.4.4. Total Displacement
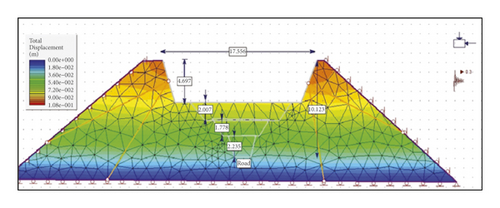
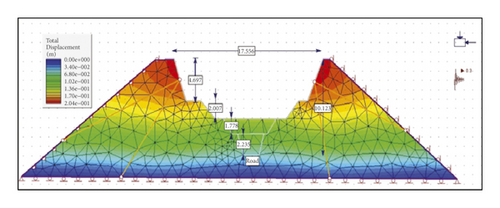
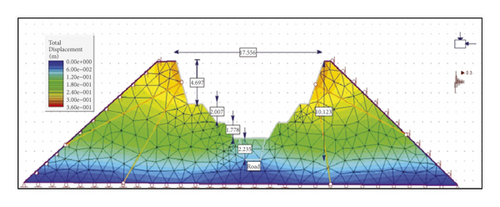
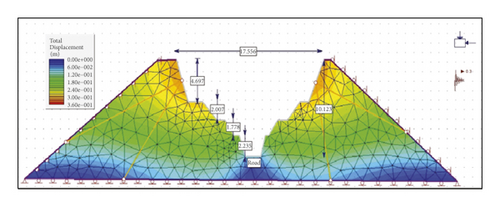
From the simulation outputs used to generate Figure 7(a)–7(d), it was possible to also produce Figure 8(a)–8(d) representing the total displacement or deformation of the rock mass. Here also, the effects of road construction and blasting (mimicked by the 4 joints) were analysed. Results of the simulation indicated much redistribution of the displacement field across the rock mass and through the construction stages. It can be seen that displacement rapidly increases as road construction progresses. Therefore, the increased deformation demonstrates that the development of the road has altered the morphology of the rock mass and subsequently contributed to unstable slopes in the area.
3.4.5. Influence of Joints on Slope Stability
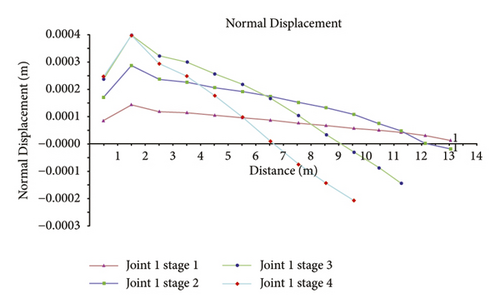
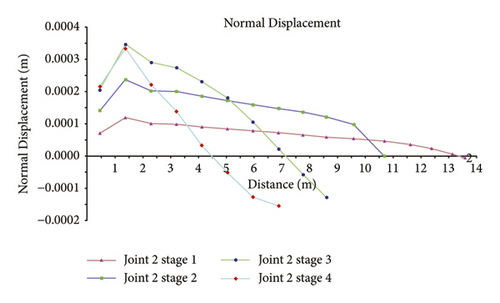
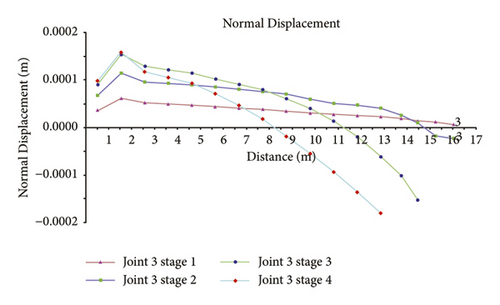
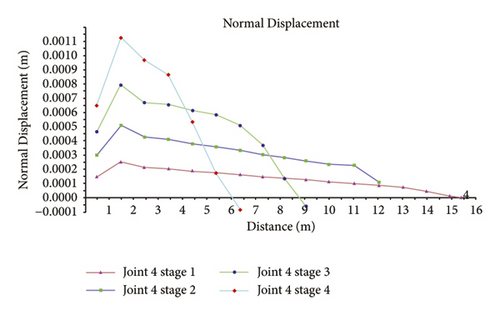
The effect of joints on slope stability is considered in this section. The idea is to look at the displacement generated by each joint separately as road construction progresses. The results of the simulation show a maximum relative displacement of 0.0011 for joint #4 at the fourth or final stage of road construction. Such displacement is noted specifically along the road sidewall. The magnitude of the displacement was therefore tracked along the rock face at all four stages of road construction. It can be seen that displacement sharply increases within the few first meters and then slowly reduces the distance of the solid mass to the increased feature (see Figure 9(a)). From Figure 9(a), one can see that the displacement generated by joint #4 gradually increases as construction progresses. This implies that the slope angle of the road wall changes also with the depth of the road. Similar predictions were made for joints #1 through joint #3 as shown in Figure 9(c), 9(b), and 9(d) also of lower magnitude. However, for all the 4 joints, the general observation was that both tension and compressive displacement were present. The tension displacement is shown as a positive value while the compressive displacement is negative. In summary, Figures 9(a)–9(d) show how geological features within the rock mass can affect slope stability. All four line charts display similar characteristics irrespective of joint orientation. Finally, displacement was much noted within the solid material closer to the joint than otherwise.
4. Comparison with the Existing Results, Discussion, and the Limits of the Adopted Approach
Although the encouraging results have been documented above, the studies did not recognise geotechnical methods to validate the findings of the study. It appears from the review covered that techniques used for the analysis of remote sensing data are still to gain momentum in rock mechanics. The picture is very different in fields such as agricultural engineering, environmental sciences, and related disciplines. This is evidenced by the very limited number of scientific articles dealing with remote slope stability susceptibility mapping, yet the underlying analysis protocols are well established. It is, therefore, our opinion that there is room for the exploration of LSM techniques to solve rock mechanics problems. Additionally, the present study could be an initial step in trying to fill the gap of knowledge within the field of study (rock mechanics).
In terms of the contribution outlined in this study, it has been noticed that the development of slope susceptibility maps or slope failure has been based on GIS-based tools only, yet the robustness of the models has been voiced out by several authors such as Ozturk et al. [31]. Therefore, the current study strived to bridge the gap by combining GIS-based tools with geotechnical techniques in studying slope failure with the use of R523 road as a case study. To bring some of the well-established studies in the field of slope stability using GIS-based tools, one may recognise studies such as those of Pittore et al. [37], Tanyas et al. [38], Behling and Roessner [39], Behling et al. [40], and Havenith et al. [41]. The previous authors have put efforts into creating systematic multitemporal slope susceptibility inventories using optical satellite time series, yet the structure and level of detail in inventories remain highly variable due to lack of information especially mechanical properties of the solid mass [42–44]. Therefore, the combination of geotechnical techniques with GIS tools has been resorted to with the purpose of addressing some of the limitations presented by slope susceptibility techniques that are based on GIS-based tools. Though the results of the study present a reasonable outcome, it is important to indicate that further analysis is still required using sophisticated tools such as 3D FEMs, lower and upper solutions of the limit analysis compared with GIS-based tools, and machine learning. Owing to that, in this study only a few case studies from one geological formation have been used; therefore, more formations with similar problems may be used and compared with this study to further validate the reliability of the approach. Lastly, finite elements are known to experience mesh distortion; therefore, other geotechnical numerical models may be used as alternatives to verify the reliability of the model.
5. Conclusions
The present paper aimed at applying both remote sensing and geotechnical techniques to establish the slope stability hazard map along the regional road in the northern part of South Africa. In this regard, ASTER images and continuum numerical models were utilised to achieve the objective of the study. Regarding ASTER images, WOE was used to analyse the data and, eventually, the hazard map was produced. On the other hand, continuum approaches such as SLIDE and Phase 2D were utilised to study FoS and the influence of geological features on the stability of the slope respectively.
Results showed that the selected study area consists of very steep slopes cut across by several geological features and multiple periodical streams. The developed slope stability hazard map has shown that most of the instability slopes are located along or closer to the geological features and streams and along a very steep slope. Indeed, the results of the remotely sensed data were validated using continuum approaches (SLIDE and Phase 2D). The results simulated by SLIDE have shown that indeed the selected slopes are considered to be unstable based on the simulated FoS using four approaches ((a) Bishop’s simplified method, (b) Janbu’s simplified method, (c) Spencer’s method, and (d) the Corps of Engineers’ Number One method). Nonetheless, the simulated results correlated very well with developing or established slope stability hazard map and the field observations. Further analysis on the strength and effect of geological structures on the stability of the slope relative to road construction has been conducted using Phase 2D. The results of the simulation also correlated with the hazard map established. It was found that geological features contribute largely to the stability of the slope by reducing the strength and the resistance of the rock mass with time.
Lastly, a slope stability hazard rating map was developed based on the above results. The map used several factors that were characterized by remote sensing and geotechnical techniques. The map was tested on existing data and demonstrated to be appropriate in predicting areas that are expected to experience slope instability along the regional road. It is believed that such a task can be implemented in any mountainous terrain and a hazard rating of slope instability can be developed based on the methodological process followed in this study. Perhaps the most important point is that from the developed map, all active slope instabilities of the Thulamela Municipality were found to be unstable in line with actual field observation.
Conflicts of Interest
The authors confirm that there are no known conflicts of interest associated with this publication.
Acknowledgments
The authors will like to appreciate the sponsorship given by the two Universities (the University of Limpopo and the University of South Africa).
Open Research
Data Availability
The data used to support the findings of this study are included within the article.


