Design of 3D Image Visual Communication System for Automatic Reconstruction of Digital Images
Abstract
In order to improve the visual communication effect of the 3D image visual communication system, this article combines the automatic reconstruction technology of digital images to design the 3D image visual communication system. Moreover, this article studies the shock stability of the shock capture scheme by combining entropy generation analysis, linear disturbance analysis, and numerical experiments. In addition to this, this article presents a general method that can be used to suppress numerical shock instabilities in various Godunov-type schemes. It can be seen from the experimental results that the proposed 3D image visual communication system for the automatic reconstruction of digital images has a good visual communication effect.
1. Introduction
There are three methods commonly used in 3D modeling technology. The first is to build a model on 3D production software, use AutoCAD to edit the spatial geometry of the survey area based on topographic map and vector data, and use 3DsMax texture mapping technology to perform texture mapping to generate a textured 3D model. This method is relatively simple, requires a lot of manual operations, has low efficiency, and is suitable for small-scale refined three-dimensional model production. The second method uses laser scanning technology to scan the object to be measured in all directions to obtain a large amount of point cloud data on the surface of the object, removes noise points, and splices the point clouds to obtain the 3D point cloud image of the object to achieve 3D model construction. The third method uses digital photogrammetry technology to obtain the original image of the ground object and uses the image information to restore the original ground object model to realize the reconstruction of the three-dimensional model [1]. The 3D modeling method based on oblique photography technology has become a mature and common method for urban 3D modeling and planning. It has the advantages of high degree of automation, high modeling efficiency, and no need for manual intervention. Moreover, it can quickly build digital products such as urban digital orthophoto (DOM), digital elevation model (DEM), digital orthophoto (DOM), and digital grid map (DRG), which is suitable for large-scale urban 3D model production [2].
When it comes to 3D technology, we have to mention computer graphics, because when we need to use 3D technology to create graphics, we often need to use 3D software to operate. Moreover, the development and progress of 3D software are developed along with the development of computer graphics [3]. Therefore, computer graphics technology is actually the basis for the development of 3D technology. Computer graphics is abbreviated as CG. Its content is very rich, and because it involves a wide range of fields and is closely related to many disciplines, it lacks a very clear definition. The most common explanation that can be found is generally that computer graphics is the science of using mathematical algorithms to convert two-dimensional or three-dimensional graphics into grid form on a computer display [4]. In simple terms, computer graphics mainly studies how to represent graphic elements in computers and how to use computers to perform graphics operations, and the development of algorithms and principles for graphics processing and display. At present, most CG is often considered to be the processing of three-dimensional images, and in fact, it also includes the production of two-dimensional images such as computer painting [5].
Through the development of computer graphics over the past few decades, the content it contains has exceeded the original content, and the current content is very extensive, including computer hardware, image algorithms, graphics standards, raster graphics generation algorithms, surface modeling, polygon modeling, virtual reality, computer animation, graphic interaction technology, augmented reality, mixed reality, natural scene simulation, and computer-aided design. In general, the content of computer graphics can be divided into four major parts: modeling, rendering, animation, and human-computer interaction [6].
When the created 3D models and scenes are available, these 3D models need to be visualized, that is, rendered. Only after rendering can a 3D model become a realistic image, rendering is also a very core existence in traditional computer graphics. In addition, with the different requirements of the final image quality, the rendering of the model is also divided into several levels. The more realistic it is, the higher the computer resources consumed [7]. Today’s computer hardware is becoming more and more powerful, and rendering has undergone great changes with the development. From the initial biased rendering, to the later physically-based rendering, to the recent popular GPU rendering and real-time rendering, computers can render various objects in reality, such as mountains, vegetation, fluids, hair, and skin, as real as the photos taken [8].
With the development of photogrammetry and computer vision, close-range photogrammetry has been used in reverse engineering, cultural relics protection, 3D reconstruction, and other fields. An image is the carrier of feature information in photogrammetry. In order to obtain high-precision measured object information, a high-precision camera is necessary. However, because professional cameras are relatively expensive, and ordinary digital cameras have relatively large distortion, they must be calibrated by the camera. After distortion correction, it can be directly applied to industrial production [9]. Camera calibration is a prerequisite for mapping from 2D to 3D. In recent years, many scholars in photogrammetry and computer vision have conducted in-depth research and proposed many mature methods. Generally, it can be divided into three categories: traditional camera calibration method, active vision camera calibration method, and camera self-calibration method. The traditional camera calibration method uses the known scene structure information, such as control field and calibration block, which is characterized by being suitable for any camera model and having high calibration accuracy, but the process is complicated and limited by the high-precision object information [10]. The active vision camera calibration method is a method of the camera self-calibration algorithm proposed in the field of computer vision using active vision technology. It can usually be solved linearly and has high robustness, but some motion information of the camera is required. Representative methods are based on planes. The orthogonal motion method of homography matrix and the orthogonal motion method based on outer pole are compared [11]; the camera self-calibration method was proposed by Faugeras, Luong, Maybank, etc., which does not require object control points but only needs to capture objects from different directions. It is more flexible to establish the relative relationship between the images, but because it is a nonlinear calibration, it is quite different from the actual results [12]. In order to make up for the shortcomings of the above methods, on this basis, subsequent scholars, combined with automatic coding recognition, use digital coding information to complete the automatic recognition of object square points and image square points and guide the establishment of relative models; representative algorithms are based on ring-shaped numbers. Code recognition, point-based digital code recognition, and digital color code recognition are different [13]. Regardless of the method, a set of information correspondence between the object side and the image side is established, which may be point information, that is, collinear equation, or other information, such as parallel, vanishing point, and other information. After the initial three-dimensional model is established, the calibration parameters are iteratively obtained by the beam method adjustment. The error equation established by the collinear equation is generally used. When there are enough redundant observations, the camera calibration parameters with high precision and reliability can be obtained [14].
The basic information is the corresponding information between the object side and the image side, which can be point or line information. In order to obtain high-precision object-side information and image-side information, the traditional method is to use high-precision control measurement and manual-guided semi-automatic positioning technology [15]; with the development and high integration of computer vision and photogrammetry, and digitally encoded targets, the automatic identification algorithm has gradually replaced the tedious work of traditional manual measurement and puncture, and has overcome the shortcoming that high-precision matching cannot be effectively achieved due to the influence of ground object texture, photographic conditions, and noise. Due to the unique coding and high robustness characteristics of digital coding markers, they are widely used in close-range photogrammetry [16]. The most representative ones are circular coding, dot coding, and color coding. Ring-shaped coding has the characteristics of high precision and simplicity, but has limited coding capacity and poor robustness; point-shaped coding has large coding capacity and high robustness, but because the dots that make up point-shaped coding are too small, it is easily affected by the environment, resulting in a great boundary extraction error; while color coding is more common than ordinary coding, it not only has the characteristics of high accuracy of ring coding, but also has the characteristics of high robustness of point distribution [17].
The acquisition process of oblique images is a multiview photography process, so it is necessary to recover the three-dimensional information of real objects through these two-dimensional images of multiple observation values, while considering the accuracy and effect factors and practicability [18]. The accuracy and effect are mainly affected by various noise and texture environments. For example, under the condition of low texture or repeated texture and high noise, the matching effect is directly affected; practicability is based on the accuracy and effect, considering the complexity of time. It is an objective issue of degree, which is often considered comprehensively with the former [19]. The final result of PMVS to achieve 3D model reconstruction is to use dense patches with normal vectors and center coordinates to approximate the surface of the object; the essence of the algorithm is the regional diffusion algorithm, and the core idea is to perform sparse matching first and then perform sparse matching. The matching results are expanded and error filtered, and iteratively iterates to a certain threshold condition to generate a dense point cloud; unlike other dense matching algorithms, it does not require rough initial values, such as visible convex hulls or bounding boxes, but needs to be based on the grayscale consistency constraints and geometric consistency constraints of the image points [20].
This article combines the automatic reconstruction of digital image technology to design the 3D image visual communication system to improve the 3D film and visual communication effect.
2. Automated Reconstruction Algorithms for Digital Images
2.1. Analysis of Entropy Generation in Godunov-Type Format
The ultimate goal of analyzing the digital image reconstruction algorithm is to enable the Riemann solver to capture shock waves stably without introducing any additional numerical viscosity of linear or nonlinear waves. In order to further study the relationship between entropy generation and shock instability, this article firstly analyzes the numerical entropy generation of a typical HLL-type scheme. Then, by modifying the viscous term of the HLLEM scheme, this article constructs two novel shock capture schemes to control the entropy generation inside the shock structure. In the study, the modified equations in discrete format play an important role, and the method is still applicable when there is a shock solution.
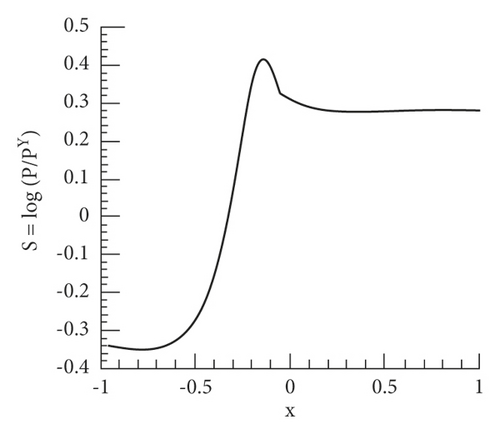
Considering the definition of the coefficient in formula (19), it is unreasonable to increase the coefficient . Therefore, this article adopts the method of modifying the viscosity term in the wave intensity to control the dissipation of the entropy wave, so as to realize the control of the entropy generation.
The corrected wave intensity in the formula is shown in formula (21).
The coefficients fρ and fP are used to control the numerical viscosity on the entropy wave. In order to elucidate their mechanism of action, the dissipative mechanisms of these Godunov-type schemes are analyzed [21].
The last term on the right side of (35) is the artificial viscosity term, which acts as a dissipative wave . Observing the last term on the right side of formula (35), we can see that if fp decreases, then also decreases. Combining formulas (31) and (32), it can be seen that the entropy generation will increase. Similarly, if fp increases, then the entropy production also increases. However, it should be noted that when fp is greater than unity, the stability condition (18) for contact discontinuity no longer holds. Therefore, the HLLEM-p format cannot be used for multidimensional flow field simulations because of the possibility of contact discontinuities in the flow field. However, for one-dimensional stationary shock problems, the scheme still works.
2.2. Quantitative Analysis of the Relationship between Entropy Generation and Shock Stability
The research shows that the dissipation corresponding to the entropy wave can be effectively weakened by increasing the density difference term Δp or decreasing the pressure difference term Δp in the wave intensity term . If these correction schemes are applied at the shock, the entropy generation inside the numerical shock structure will become larger. The coefficients fρ and fp play an important role in controlling the entropy generation. Since it is difficult to determine the values of the coefficients fρ and fp analytically, this article resorts to numerical experiments to determine these coefficients.
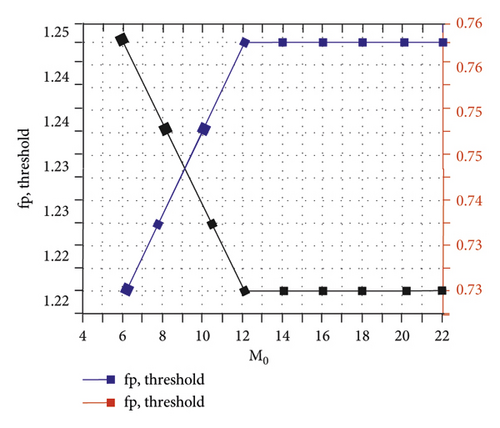
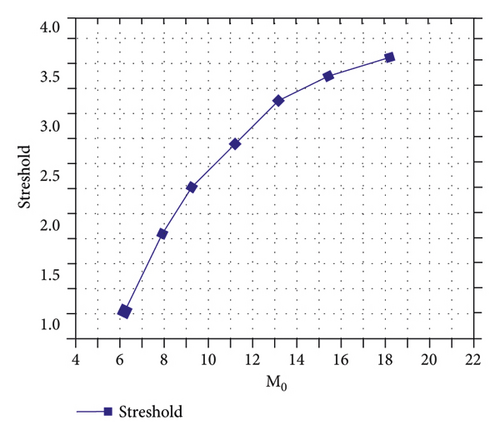
Considering the one-dimensional steady normal shock problem, the numerical calculation adopts the first-order HLLEM format. The three-step Runge–Kutta method with first-order accuracy is applied, the CFL number was set to 0.5, and the calculation process is carried out until 40,000 time steps. At the same time, the Mach number is set to M0 = 6.0, and the shock position is set to ε = 0.3. Numerical fluxes at the interface of grid M are calculated using the modified formats HLLEM-p and HLLEM-p to control entropy generation within grid M0. The HLLEM format will have a one-dimensional numerical phenomenon. Therefore, in order to obtain a stable and convergent solution, this article gradually increases the magnitude of the coefficient fρ or decreases the magnitude of the coefficient fρ to increase the entropy generation in the intermediate grid M. In Figure 2, under different values of fρ and fp coefficients, the entropy distribution curve of the stable solution is obtained. The corresponding residual value convergence curve is shown in Figure 3. It can be seen from the figure that as the coefficient fρ becomes larger or the coefficient fρ becomes smaller, the entropy (S = log(p/ργ) − log(pL/ρL)) in the numerical shock structure (the grid M) will increase. This result is consistent with the entropy generation analysis presented in subsection 1. These results suggest that if sufficient entropy can be generated inside the shock structure, the instability can be successfully removed. The convergence curves presented in Figure 3 show that more entropy production will allow the computation to converge to a stable solution at a faster rate. It should be noted that similar results can be obtained for other Mach numbers M0 and shock position parameter ε. In Figure 4, this article gives the stability thresholds of (fρ,threshold) and (fp,threshold) under different Mach numbers M0, and the corresponding entropy thresholds are shown in Figure 5.

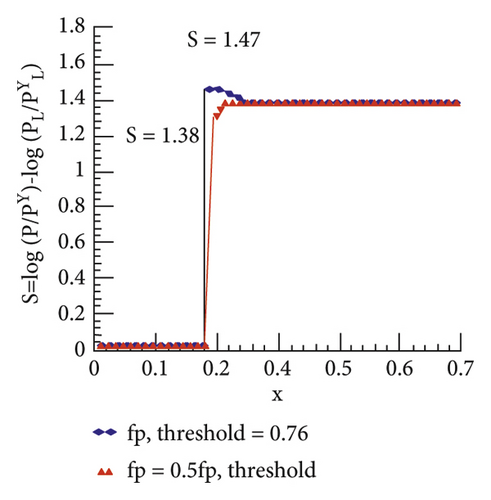
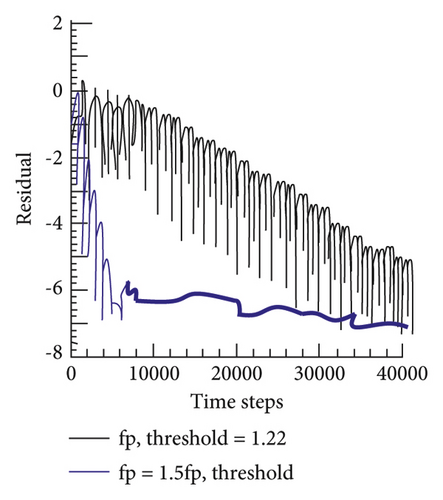
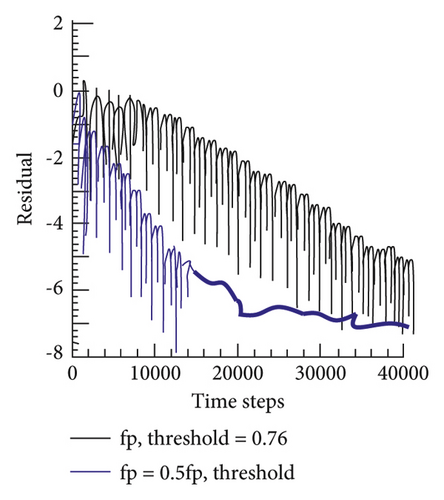
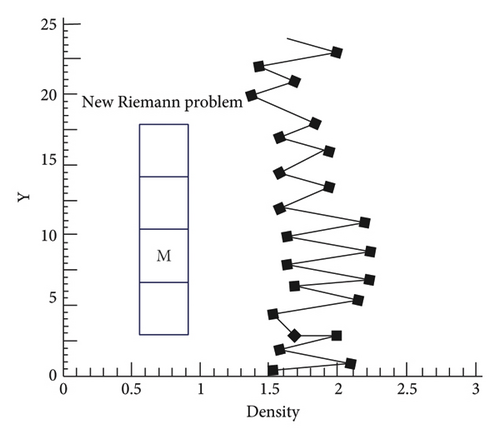
As shown in Figure 6, the conserved quantities inside the numerical shock structure suffer perturbation errors when crossing the shock. Due to the difference of physical quantities in the lateral direction of the shock wave, a new Riemann problem will arise in the lateral direction, as shown by the red solid line in Figure 6.
3. 3D Image Visual Communication System for Automatic Reconstruction of Digital Images
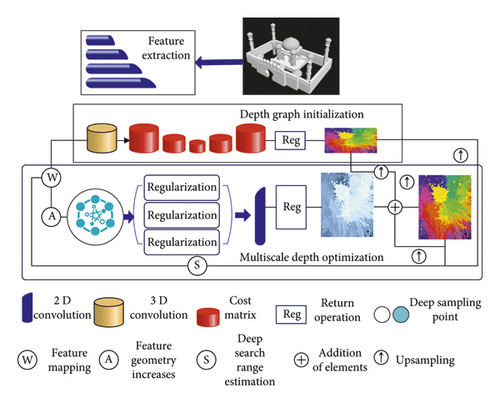
The structure of the depth estimation network constructed in this article is shown in Figure 7. For a reference image whose depth is to be estimated and several adjacent images, image features are extracted based on the pyramid structure, and then, the initial depth map is estimated. After that, based on the multiscale optimization strategy, residual depth estimation is performed on the initial results, and the optimized depth map is finally output.
- (1)
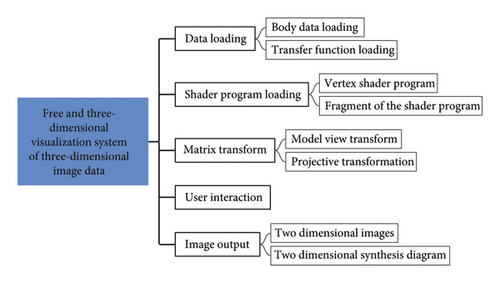
User interaction. It refers to the interaction between the user and the volume data, such as dragging, rotating, zooming in, and zooming out.
- (2)
Data loading. It includes the loading of volume data and the loading of transfer functions. Volume data loading loads volume data according to the size, format, and bit depth of the volume data, and encapsulates the volume data into a 3D texture for use by the fragment shader program. Transfer function loading generates a transfer function lookup table based on the transfer function curve for use by fragment shader programs.
- (3)
The shader program is loaded. Load different shader programs according to the different effects to be achieved (pre-interpolation shading classification, postinterpolation shading classification, pre-integration shading classification, etc.). Shader programs include vertex shader programs and fragment shader programs.
- (4)
Matrix transformation. Before rendering, the volume data model is subjected to necessary model-view transformation and projection transformation to prepare for rendering processing. Finally, the transformation matrix is sent to the GPU for use by the vertex shader program.
- (5)
Image output. According to the user's choice, the output mode of the controlled drawing result is two-dimensional image or three-dimensional stereoscopic image, and the three-dimensional stereoscopic image is output for autostereoscopic display.
On the basis of the above research, this article verifies the effect of the model proposed in this article, and quantitatively processes the algorithm proposed in this article and some other 3D reconstruction methods based on multiview images, statistical accuracy error, integrity error, and integrity error. The statistical error results are shown in Table 1.
| Num | Accuracy error | Integrity error | Global error |
|---|---|---|---|
| 1 | 0.81092 | 0.53835 | 0.67512 |
| 2 | 0.59364 | 0.91083 | 0.75272 |
| 3 | 0.33271 | 1.1543 | 0.74399 |
| 4 | 0.26578 | 1.15721 | 0.71198 |
| 5 | 0.4365 | 1.01171 | 0.72362 |
| 6 | 0.44232 | 0.62662 | 0.53447 |
| 7 | 0.37151 | 0.43844 | 0.40449 |
| 8 | 0.39382 | 0.42098 | 0.4074 |
| 9 | 0.35017 | 0.40837 | 0.37927 |
| 10 | 0.34241 | 0.39576 | 0.3686 |
From the above test results, it can be seen that the 3D image visual communication system for automatic reconstruction of digital images proposed in this article has a good 3D image reconstruction effect. On this basis, the visual communication effect of the 3D image visual communication system for the automatic reconstruction of digital images is evaluated, as shown in Figure 9.
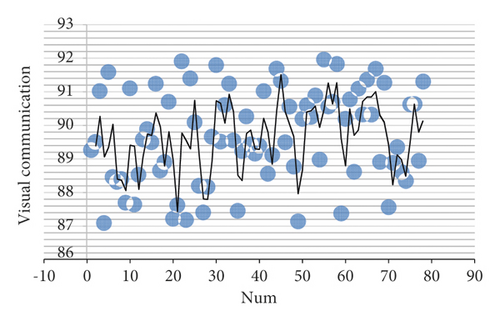
From the above test results, it can be seen that the 3D image visual communication system for the automatic reconstruction of digital images proposed in this article has a good visual communication effect.
4. Conclusion
As a classic problem in computer vision, 3D reconstruction has experienced a long process of development, produced rich results, and played an important role in people's life and production. In some traditional fields, such as in industrial manufacturing, reverse engineering based on 3D reconstruction technology can effectively improve the visual communication effect of 3D film and television. The 3D reconstruction technology using multiview image depth map has become one of the most mainstream research directions at present because of its high flexibility and good reconstruction accuracy. This article combines the automatic reconstruction of digital image technology to design the 3D image visual communication system to improve the 3D film and visual communication effect. It can be seen from the test results that the 3D image visual communication system for the automatic reconstruction of digital images proposed in this article has a good visual communication effect.
Conflicts of Interest
The author declares no conflicts of interest.
Acknowledgments
This study was sponsored by Xinyang Vocational and Technical College.
Open Research
Data Availability
The labeled dataset used to support the findings of this study is available from the corresponding author upon request.


