Detection of Weak Pulse Signal in Chaotic Noise Based on Improved Brain Emotional Learning Model and PSO-AGA
Abstract
A model for detecting weak pulse signals in chaotic noise was proposed. Firstly, based on the short-term predictability of chaotic signals, according to Takens’s theorem, the phase space of observed signal was reconstructed. Then, an improved brain emotional learning (BEL) model combined with PSO-AGA was proposed to predict chaotic signals, and the one-step prediction error was obtained. In order to optimize the parameters of the BEL model, an algorithm named PSO-AGA combined with particle swarm optimization and adaptive genetic algorithm was adopted to achieve the balance of global search and local search capabilities. Finally, the hypothesis testing method was used to detect whether there existed the pulse signal from the one-step prediction error. The experiments simulated the Lorenz system and the magnetic storm loop current system. In the Lorenz system, the MAD of BEL-PSO-AGA, BP-NN-PSO-AGA, and Wavelet-NN-PSO-AGA were 0.0022, 0.0142, and 0.0076; the MSE were 8.95 × 10⁻⁶, 0.00034, and 0.00016; the RMSE were 0.0029, 0.0187, and 0.0128; the running times were 410 s, 792 s, and 721 s; the ACC were 0.999, 0.972, and 0.997; the F1 were 0.984, 0.423, and 0.878. It could be seen that the BEL model had better performance, shorter running time and higher values of the ACC and F1, indicated that the BEL model ran faster and had a better predictive effect. The MAD of BEL-PSO-AGA, BEL-WOA, BEL-AGA, and BEL-PSO were 0.0022, 0.0065, 0.0135, and 0.0071; the MSE were 8.95 × 10⁻⁶, 0.00013, 0.00029, and 0.00014; the RMSE were 0.0029, 0.0115, 0.0173, and 0.0119; the ACC were 0.999, 0.992, 0.990, and 0.997; the F1 were 0.984, 0.733, 0.451, and 0.878. This indicated that the PSO-AGA also had better performance and higher prediction accuracy. In the magnetic storm loop current system, the experimental results were similar to the Lorenz experiment, which also indicated that the BEL-PSO-AGA model was better. To sum up, the detection results of simulations showed that the proposed model and algorithm could effectively detect weak pulse signals from the chaotic noise.
1. Introduction
A weak signal is a signal with low signal-to-noise ratio (SNR) that is overwhelmed by noises and is difficult to be detected by traditional methods. “Weak” is relative to the strength of the noise [1]. Chaos refers to a random or random-like phenomenon that appears in a deterministic system, which has two remarkable characteristics, the unpredictability for a long time and the predictability in a short term [2]. Due to its irregularity and long-term unpredictability, signal detection in chaotic noise has always been a difficult point in signal detection. With the development of scientific technology and the continuous maturity of chaos theory, the detection of weak signals in chaotic noise has gradually become a hot issue in signal detection. Researchers have proposed methods such as neural network, least squares support vector machine, and Duffing oscillator to extract weak signals in chaotic noise [3–5].
Pulse signal is a kind of common signal, often used in communication and fault diagnosis and other fields [6]. Improving the detection ability of pulse signal is of great practical significance [7]. The detection of weak pulse signal in chaotic noise has become a hot spot in the field of signal processing. Early detection methods include Boxcar Integrator and phase-locked amplifier, strongly coupled Duffing oscillator subsystem, Birkhoff-Shaw oscillator subsystem, and modern cross-spectrum estimation [8–11]. However, most of these methods have some defects such as low sensitivity, low adaptability, and slow operating speed. In order to improve the detection performance, some scholars have applied Jordan neural network, Elman neural network, empirical likelihood ratio method, support vector machine, local linear and Kalman filter hybrid algorithm, and double local linear model to detect pulse signal in chaotic noise [12–17].
It can be found from the above researches that the detection performances depends on the prediction effect of chaotic signal. The higher prediction accuracy of chaotic signal, the better detection effect of target signal. Therefore, it is crucial to improve the prediction accuracy of chaotic signal for the detection of weak pulse signals. In recent years, many methods such as fractional maximum correlation entropy algorithm, GRNN neural network, hybrid neural network and attention mechanism, extreme learning machine, robust extreme learning machine, support vector machine, and deep learning have been applied to the prediction model of chaotic time series, which improved the prediction accuracy of chaotic time series [18–24]. Mei et al. [25] applied the method based on brain emotion learning (BEL) model and adaptive genetic algorithm (AGA) to chaotic time series prediction, which achieved great prediction accuracy. Yang [26] applied the method proposed by [25] to detect the pulse signal, but the detection performance was poor due to the convergence instability of GA. What we do technically in this paper is to improve the detection performance of pulse signal in chaotic noise. The BEl model is improved, and the PSO-AGA is proposed to optimize the parameters of the BEL model. The algorithm inherits the characteristics of fast search speed and high efficiency of particle swarm optimization; meanwhile, it has the characteristics of strong global search ability of GA and introduces dynamic crossover and mutation parameters to make the optimization effect better.
The rest of this paper is organized as follows. In Section 2, as the signal detection problem in chaotic noise has been abstracted as a hypothesis testing problem, the phase space is reconstructed. An improved BEL model is established to predict the reconstructed observation signal, and the pulse signal detection model is proposed from the one-step prediction error. In Section 3, the PSO-AGA is established and used to optimize the parameters of BEL. Then, the problem of signal detection is explained. The simulations are shown in Section 4, which validates the applicability of the proposed model and algorithm. Finally, Section 5 gives concluding remarks. The idea diagram of this paper is shown in Figure 1.

- (1)
The signals in the afferent sensory cortex, orbitofrontal cortex, and amygdala are activated, and the hyperbolic tangent function is used as the activation function
- (2)
On the basis of AGA algorithm, the PSO algorithm is added. Using the characteristics of PSO with fast convergence and high efficiency, then use the advantages of GA global search for population screening and improve the diversity of population
- (3)
In order to verify the effectiveness of the proposed BEL-PSO-AGA model, the BEL model is compared with the BP neural network and wavelet neural network to determine the advantages of fast running and high precision. Then, on the basis of the BEL model and compared with WOA, AGA, and PSO optimization algorithms, it is found that the BEL-PSO-AGA has the best prediction effect
2. Detection of Weak Pulse Signal in Chaotic Noise
2.1. The Problem of Signal Detection in Chaotic Noise
Thus, the next work is to separate the chaotic noise c(t) from the observed signal y(t). Fortunately, according to Takens’s theorem [27], the chaotic signals can be predicted by phase space reconstruction.
2.2. Phase Space Reconstruction
For the observed signal, a m dimensional phase space of the original system can be constructed by introducing the embedding dimension m and the delay time τ. The reconstructed phase space is expressed as Y(t) = (y(t), y(t − τ), y(t − 2τ), ⋯,y(t − (m − 1)τ))′, where t > (m − 1)τ. According to Takens’s theorem [27], the mapping of a phase point to the reconstructed space is an embedding and can be expressed as f : Rm⟶R, such that y(t + 1) = f(Y(t)). If the mapping f has been found and the appropriate embedding dimension m and delay time τ are selected, the next point y(t + 1) should be predicted.
According to Mei et al. [25], a BEL model has a good prediction effect in chaotic time series. Therefore, an improved BEL model is constructed to predict the reconstructed observation signals.
2.3. Improved BEL Model
Emotion is an advanced function of the brain that ensures the organism’s adaptation and survival. Emotional neuroscience research shows that the brain mechanism of emotion is mainly prefrontal cortex and limbic system. The core part of the limbic system is composed of amygdala and hippocampus, used for emotional learning and memory. After the sensory stimulation reaches the thalamus, it can be directly sent to the amygdala through the lower channel or sent to the sensory cortex first through the upper channel, where the sensory stimulation is processed carefully, and then the signal is sent to the amygdala [28].
Inspired by neurobiological studies, Balkenius and MorÉn [29] proposed a neural network-based emotional learning model of the brain, which consists of thalamus, sensory cortex, orbitofrontal cortex, and amygdala. Based on the model in [29], Mei et al. [25] proposed a BEL model combined with AGA to predict the chaotic signal. The BEL model proposed by Mei et al. is a neural network with two hidden layers, i.e., orbitofrontal cortex and amygdala. In order to improve the accuracy of the prediction of BEL model, an improved BEL model with three hidden layers, i.e., sensory cortex, orbitofrontal cortex, and amygdala, is proposed in this paper. The improved BEL model’s network structure is shown in Figure 2.

In Figure 2, SI = [S1, S2, ⋯, Sn], represents the input signal received in the thalamus, where n denotes the dimension of the input signal. The input signal SI was transmitted from thalamus to sensory cortex while the maximum value of input signal Smax = max(SI) was transmitted from thalamus to amygdala directly.
To sum up, the improved BEL is a neural network model between sensory cortex, orbitofrontal cortex, and amygdala. There are some parameters including weights wi, vi and biases b0, ba that need to be optimized. In the below, PSO-AGA will be introduced into the model to optimize the weights and biases.
3. PSO-AGA
The AGA has a large space of improvement in search ability, while the convergence speed is slow. The PSO algorithm has certain memory function, while it is easy to fall into local optimum. Combining AGA with PSO, it will not only improve the convergence speed but also enhances the global search ability [30]. The particle can be searched in a larger space, instead of being limited to the previous optimal position, which will improve the flexibility of the algorithm and enhance the optimization ability. The flow chart of BEL model and PSO-AGA is shown in Figure 3.
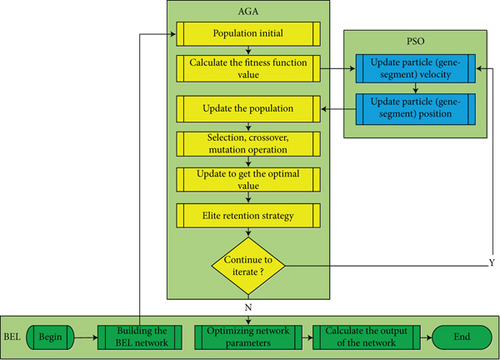
In the PSO-AGA algorithm, firstly, the genetic parameters are initialized, such as maximum and minimum crossover probability, maximum and minimum mutation probability, and iteration times. Secondly, the population and chromosomes are initialized; then, the PSO algorithm is used to update the population, and the AGA algorithm is used to further update the population. Then, the optimal chromosomes are preserved into the next generation until the maximum number of iterations is reached. Finally, the optimal chromosomes, namely, the optimal weight and threshold value, are substituted into the BEL model to output the final prediction results.
3.1. Adaptive Genetic Algorithm (AGA)
The genetic algorithm (GA) is a common intelligent optimization algorithm, which draws on the random search method of natural selection mechanism in biological world and can be applied in various fields. It has higher global performance and a more mature convergence analysis method [31]. However, the general genetic algorithms have some defects such as the crossover and mutation probability are fixed, converged slowly, and too subjective. In order to improve the flexibility and performance of GA, an adaptive genetic algorithm (AGA) is proposed in which the adaptive crossover and mutation probability are designed. The operation of AGA is shown below.
3.1.1. Chromosomal Coding
3.1.2. Fitness Function
3.1.3. Select Operation
3.1.4. Crossover Operation
3.1.5. Mutation Operation
3.1.6. Elite Retention Strategy
If the fitness value of the optimal individual in the current population was greater than that of the optimal individual in the next generation, the optimal individual in the next generation should be replaced by the optimal individual in the current population. This strategy, which called elite retention strategy, could effectively prevent the loss or destruction of the optimal individuals and would be a basic guarantee for the population convergence to the optimal solution [33].
AGA can improve the diversity of the population and has a large space of improvement in search ability, while the convergence speed is slow. In this paper, particle swarm optimization (PSO) is used to improve the convergence performance of AGA.
3.2. Particle Swarm Optimization (PSO)
Particle swarm optimization is also used to optimize the parameters, which can improve the prediction ability and performance of the model [35]. However, particle swarm optimization is easy to fall into the problem of local optimization, so combining the AGA algorithm can expand the particle search space, increase the diversity of the population, and make the model performance better and the prediction accuracy higher.
3.3. Detection of the Target Signals
Construct statistic , for a given 0 < α < 1, P = P(|z| ≥ zα/2) is obtained, when P < α, the null hypothesis is rejected, and it can be considered that the observed signal contains the weak signals. Two simulation experiments are used to test the applicability of the model and algorithm.
4. Simulations
In the experiment, Intel CPU Core I5-10210U processor, main frequency 2.11GHz, 16GB memory, 64-bit Windows10 operating system, and Python programming environment are adopted.
In order to verify the feasibility and effectiveness of PSO-AGA, the prediction accuracy of the BEL model, and the pulse signal detection performance, two simulation experiments are carried out. In experiment 1, the Lorenz system is used to generate the chaotic noise signal, while geomagnetic storm loop current Index (Dst) is used in experiment 2.
4.1. Index of Performance Evaluation
and are the mean values of s(t) and c(t), respectively. is the variance of white noise N(t). is the predicted value, while y(t) is the true value of the observed signal sequence. n is the number of samples. FP, FN, TN, and TP, which come from machine learning, denote the false positive, false negative, true negative, and true positive, respectively. P is accuracy rate and R is recall rate.
4.2. Data Processing and Parameter Setting
Before the simulation experiment, it is necessary to explain the setting of the pulse signal and processing of observed signal and white noise.
4.2.1. Setting of Pulse Signals
4.2.2. Processing of Observed Signal
4.2.3. Parameter Setting
In this paper, the embedding dimension m = 4 and delay time τ = 1 are determined by the method of saturated correlation dimension and mutual information function [36]. According to the phase space reconstruction method, the observed signal is reconstructed to a 4-dimensional vector which could be expressed as [y(t), y(t − 1), y(t − 2), y(t − 3)]T. Thus, the input data of BEL model is a 4-dimensional vector. There are 9 weights, and 2 biases need to be optimized. The initial values of weights range from 0 to 1 and initial values of the biases range from -1 to 1.
In PSO-AGA, the population size, maximum iteration number, and length of chromosome (particle) are set to be 1000, 100, and 11, respectively. The learning factors are set to be c1 = c2 = 2. The maximum and minimum crossover probabilities are set as pcmax = 0.8 and pcmin = 0.5, and the maximum and minimum mutation probabilities are set as pmmax = 0.1 and pmmin = 0.001. PSO-AGA is carried out according parameters set above. The output data is processed by inverse normalization, and the predicted value is finally obtained.
4.3. Experiment 1: Test Pulse Signal in the Lorenz System
4.3.1. Prediction Result of BEL Model in the Lorenz System
In experiment 1, the observation signal y(t) is composed of c(t), N(t) and s(t), i.e., y(t) = c(t) + N(t) + s(t). The chaotic noise signal with white noise is shown in Figure 4, while the observed signal y(t) which contain pulse signal s(t) is shown in Figure 5.

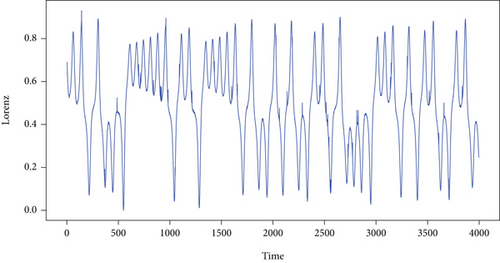
Figures 4 and 5 show that the two signals are very similar. It is hard to differentiate directly. It seems that the influence of weak pulse signal in chaotic noise is very weak and has been submerged in chaotic noise. So the weak pulse signal cannot be detected directly, where SNR is -71.147 dB.
The BEL model is used to get the one-step prediction of observed signal. The PSO-AGA is used to optimize the parameters of BEL model. The performance and convergence situation of PSO-AGA determines the performance of BEL model. Figures 6 and 7 show the convergence situation of PSO-AGA and the performance of BEL model, respectively.
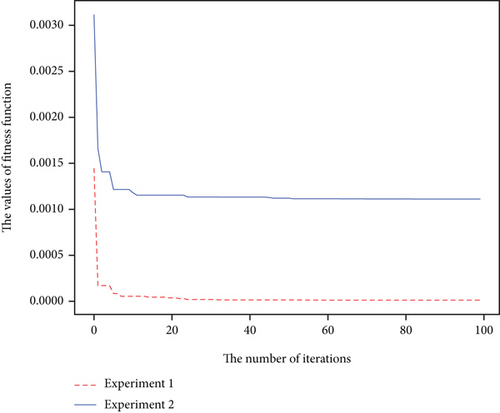
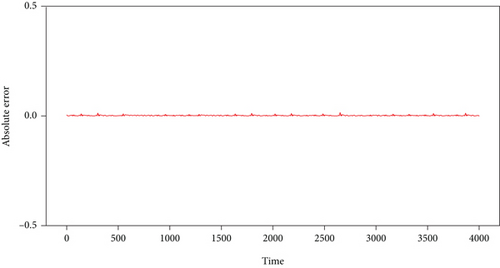
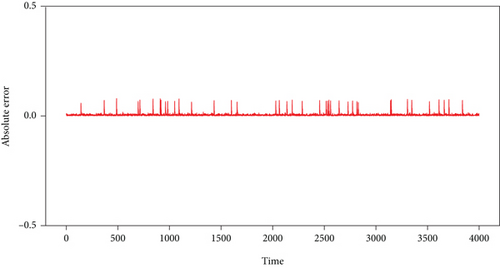
In Figure 6, it is shown that the convergence speed of PSO-AGA is fast in both experiments which means the proposed PSO-AGA is stable and effective. Figures 7(a) and 7(b) show the absolute one-step prediction error of the observation signal without and with pulse signal, respectively. The one-step prediction error of the observation signal without pulse signal is very small in Figures 7 (a). Comparing the two absolute errors, there is an obviously larger error value that appears in Figures 7(b), indicating the possible existence of pulse signals. The correlation coefficient of the predicted value and actual value is shown in Figure 8.
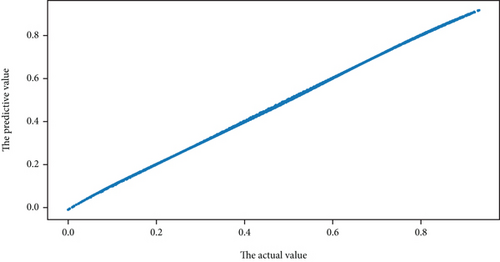
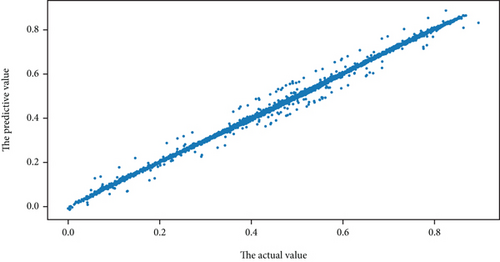
Comparing Figures 8(a) and 8(b), it can be seen that there are obviously some points deviating from the straight line in Figures 8(b), which indicates that there must be some pulse signals. The method of hypothesis testing will be used to detect the pulse signal form prediction error below.
4.3.2. Detection of Pulse Signal in the Lorenz System
Figures 7(b) and 8(b) show that there must be some pulse signals in the observation signal, which is subjective and inaccurate. As shown in Figure 7(a), it is reasonable to suppose that μ = 0 when there is no pulse signal in the observation signal. According to the Section 3.3, the z-test is applied. The variance σ2 of prediction error e(t) must be given in advance in the z-test. In this paper, the sample variance is used to instead of σ2. For each point of the prediction error e(t), there is a z-test for pulse signal. It is 4000 times test in total, and there are 40 pulse signals. The ACC and F1 are used to measure the performance of the test. Given significance level as α = 0.1, the detection performance of test with different q, i.e., q = 3,2.5,2, 1.5,1, 0.5, are shown in Table 1.
| q | SNR (dB) | ACC | F1 |
|---|---|---|---|
| 3.0 | -67.501 | 1.000 | 1.000 |
| 2.5 | -71.147 | 0.999 | 0.984 |
| 2.0 | -75.610 | 0.999 | 0.984 |
| 1.5 | -81.364 | 0.995 | 0.947 |
| 1.0 | -89.473 | 0.990 | 0.139 |
| 0.5 | -103.33 | 0.990 | 0.000 |
In Table 1 that SNR keeps decreasing with the decreasing of q. Overall, the BEL model and PSO-AGA have ideal detection performance when q ≥ 2. However, as the SNR keeps decreasing, although the accuracy rate is very high, the value of F1 keeps decreasing. When the SNR ≤ −89.473 dB, the detection ability is very poor. This is because the pulse signal is too weak; it has been completely submerged in the chaotic noise.
4.3.3. Compared with Different Models
In order to verify the effectiveness of the BEL, under the PSO-AGA algorithm, the performance of the BEL model is analyzed by comparing the traditional neural network model, such as BP neural network and wavelet neural network. The comparison results are shown in Table 2.
| Model | MAD | MSE | RMSE | Time (s) | ACC | F1 |
|---|---|---|---|---|---|---|
| BP-NN | 0.0142 | 0.00034 | 0.0187 | 792 | 0.972 | 0.423 |
| Wavelet-NN | 0.0076 | 0.00016 | 0.0128 | 721 | 0.997 | 0.878 |
| BEL | 0.0022 | 8.95 × 10⁻⁶ | 0.0029 | 410 | 0.999 | 0.984 |
It can be seen from the results in Table 2 that the MAD, MSE, and RMSE of the BEL model are 0.0022, 8.95 × 10⁻⁶, and 0.0029, which are the smallest. At the same significance level α = 0.1, the ACC and F1 values are the highest. Most importantly, the BEL model has shorter computation time than the traditional neural network model. In general, the BEL model has obvious advantages in prediction accuracy, running speed, and stability.
4.3.4. Compared with Different Optimization Algorithms
After comparing the different models, on the basis of the BEL model, it is compared with different optimization algorithms. The comparison results are shown in Table 3 and in Figure 9.
| Algorithm | MAD | MSE | RMSE | Time (s) | ACC | F1 |
|---|---|---|---|---|---|---|
| WOA | 0.0065 | 0.00013 | 0.0115 | 218 | 0.992 | 0.733 |
| AGA | 0.0135 | 0.00029 | 0.0173 | 302 | 0.990 | 0.451 |
| PSO | 0.0071 | 0.00014 | 0.0119 | 198 | 0.997 | 0.878 |
| PSO-AGA | 0.0022 | 8.95 × 10⁻⁶ | 0.0029 | 410 | 0.999 | 0.984 |
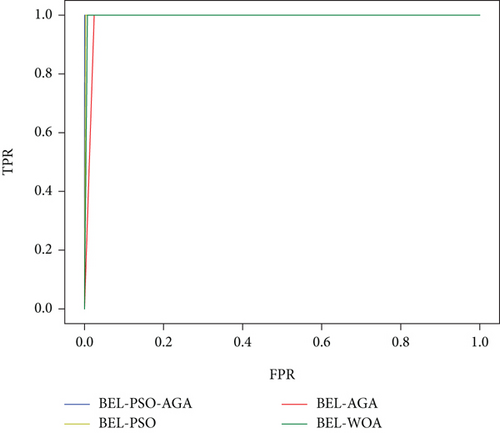
It can be seen from the results in Table 3, on the basis of BEL model, comparing with other optimization algorithms. Although the running time of the PSO-AGA algorithm is longer than other algorithms, the MAD, MSE, and RMSE of PSO-AGA are the smallest. Moreover, at the same SNR and the same significance level α = 0.1, the ACC and F1 of PSO-AGA are superior to other optimization algorithms. Figure 9 shows that the ROC curves of different optimization algorithms. It is observed that the BEL-PSO-AGA has the largest area covered by ROC curve and the value of AUC is 0.999. The AUC values of the other three optimization algorithms are 0.998, 0.987, and 0.996, respectively. Therefore, it seems that the proposed BEL-PSO-AGA model has good fitting ability and better model performance in the Lorenz system.
4.4. Experiment 2: Test Pulse Signal in Dst
Geomagnetic storm loop current Index (Dst) is a geomagnetic index that indicates the intensity of a geomagnetic storm. A geomagnetic storm is a violent movement of the earth’s magnetosphere lasting from ten to dozens of hours, which is complex and changeable. According to the level of magnetic storm, it can be divided into weak storm, medium storm, strong storm, and great storm, among which the strong storm and great storm will form serious disaster weather [37]. Therefore, signal detection in the harsh environment of magnetic storms is of great significance which would avoid disaster. Signal detection in Dst has played an important role in the research of signal processing.
The Dst indices collected in this paper are from the World Geomagnetic Data Center [38]. 2000 Dst indices occurred in 2020 are selected as chaotic noise, which is a typical chaotic time series with a time interval of 1 hour. The pulse signals are generated as in Section 4.2 with q = 8.
4.4.1. Prediction Results of BEL Model in Dst
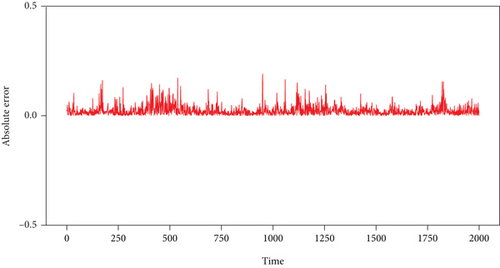
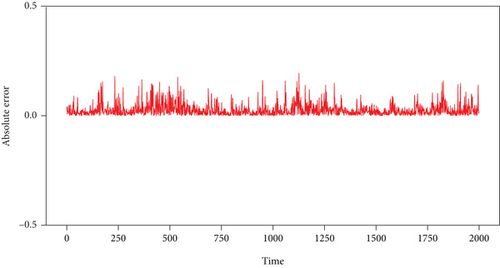
The purely magnetic storm loop current Dst signal c(t) is shown in Figure 10(a), while the observation signal y(t) which contains pulse signal s(t) is shown in Figure 10(b). Figures 10(c) and 10(d) show the absolute one-step prediction error of purely magnetic storm loop current Dst signal and the observation signal with pulse signal, respectively.
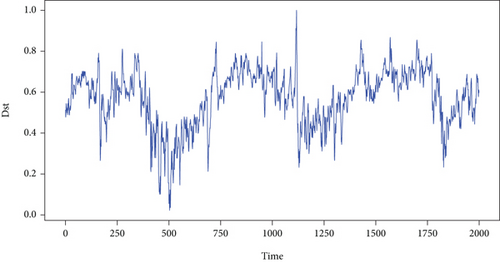
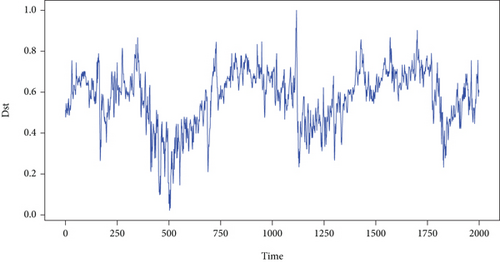
Figures 10(a) and 10(b) show that the two signals are very similar. It is hard to differentiate directly. It seems that the influence of weak pulse signal in chaotic noise is very weak and has been submerged in chaotic noise, where SNR = −55.864 dB.
In Figure 6, it is shown that the convergence speed of PSO-AGA is fast in experiment 2. Figures 10(c) and 10(d) show the absolute one-step prediction error of the observation signal without and with pulse signal, respectively. Comparing with the two errors in Figure 10, both of them fluctuate within a small range near zero. The error in Figure 10(d) seems a little greater than that in Figure 10(c). Comparing with the prediction error in Figures 7(b) and 10(d), it is more difficult to determine whether the pulse signal exist in Dst. The hypothesis testing will be used to detect the pulse signal as in the Lorenz system.
4.4.2. Detection of Pulse Signal in Dst
The detection of pulse signal for each detected error could be abstracted as hypothesis testing problem (18) just as experiment 1. The sample variance is used to instead of the variance of the population. There are 2000 times tests in total, and there are 40 pulse signal. The ACC and F1 are used to measure the performance of the test. Given the significance level as α = 0.4, the detection performance of test with different q, i.e., q = 9, 8, 7, 6, 5, 4, are shown in Table 4.
| q | SNR (dB) | ACC | F1 |
|---|---|---|---|
| 9 | -53.509 | 0.978 | 0.933 |
| 8 | -55.864 | 0.958 | 0.931 |
| 7 | -58.535 | 0.941 | 0.651 |
| 6 | -61.618 | 0.952 | 0.720 |
| 5 | -65.264 | 0.966 | 0.823 |
| 4 | -69.727 | 0.934 | 0.627 |
In Table 4, when SNR ≥ −55.864 dB, the values of ACC and F1 are very high, which indicates that the model has the strong signal detection ability. However, when SNR ≤ −55.864 dB, the values of ACC and F1 are relatively low, which indicates the detection ability of the model is also gradually weakened and which indicates that in the complex magnetic storm loop current system, the pulse signal is submerged and the signal is difficult to be detected.
4.4.3. Compared with Different Models
Same as the detection of pulse signals in experiment 1, under the same environment and PSO-AGA optimization algorithm, the comparison results with the traditional neural network models are as follows:
It can be seen from the results in Table 5, the MAD, MSE, and RMSE of BEL model are the smallest. Not only the computation time is less than that of the traditional neural network models, but also the value of F1 is higher. Therefore, the BEL model is better in all aspects.
| Model | MAD | MSE | RMSE | Time (s) | ACC | F1 |
|---|---|---|---|---|---|---|
| BP-NN | 0.0265 | 0.00145 | 0.0382 | 561 | 0.981 | 0.889 |
| Wavelet-NN | 0.0271 | 0.00151 | 0.0387 | 493 | 0.979 | 0.817 |
| BEL | 0.0242 | 0.00104 | 0.0323 | 374 | 0.958 | 0.931 |
4.4.4. Compared with Different Optimization Algorithms
Under the same experimental conditions, BEL-WOA, BEL-AGA, BEL-PSO, and the proposed BEL-PSO-AGA model are used to detect the pulse signal in Dst. The comparison results are shown in Table 6 and in Figure 11.
| Algorithm | MAD | MSE | RMSE | Time (s) | ACC | F1 |
|---|---|---|---|---|---|---|
| WOA | 0.0244 | 0.00118 | 0.0343 | 124 | 0.956 | 0.889 |
| AGA | 0.0292 | 0.00171 | 0.0413 | 211 | 0.952 | 0.816 |
| PSO | 0.0259 | 0.00141 | 0.0375 | 116 | 0.957 | 0.911 |
| PSO-AGA | 0.0242 | 0.00104 | 0.0323 | 374 | 0.958 | 0.931 |

In Table 6, comparing with other algorithms, the MAD, MSE, and RMSE values of PSO-AGA are the smallest, which indicates that the proposed PSO-AGA has high prediction accuracy and stability. Moreover, the ACC and F1 of the PSO-AGA algorithm are superior to other algorithms. Figure 11 shows the ROC curves of different optimization algorithms. As you can see from the picture, the BEL-PSO-AGA has the largest area covered by ROC curve and the value of AUC is 0.819. The AUC values of the other three optimization algorithm models are 0.807, 0.804, and 0.806, respectively. Thus, there are good reasons to believe that the BEL-PSO-AGA could detect the pulse signal from the complex environment of magnetic storm ring current.
5. Conclusions
Combining the characteristics of BEL model, AGA, and PSO algorithm, a new method for detecting weak pulse signals in chaotic noise is proposed. Comparing with other models, the BEL model has faster convergence speed, shorter running time, and higher accuracy than traditional neural network. The PSO-AGA improves the detection accuracy; stability as PSO-AGA could achieve the balance between global search and local search ability. Comparing with other optimization algorithms, the PSO-AGA has better performance and prediction accuracy. The experimental results show that the BEL model and PSO-AGA have wide application values and could effectively detect weak pulse signal from chaotic noise.
Conflicts of Interest
The authors declare that they have no conflicts of interest.
Acknowledgments
This work was supported by Science Foundation of The Chongqing Education Commission (Grant KJQN202101125), the Natural Science Foundation of Chongqing Science and Technology Bureau (Grant No. cstc 2019jcyj-msxmX0020), the Natural Science Foundation of Chongqing (No. cstc 2021jcyj-msxmX0388), and Chongqing Postgraduate Research and Innovation Project Funding (Project No. gzlcx20222081).
Open Research
Data Availability
The Lorentz data comes from the Lorentz equation, and the magnetic storm ring’s data are from the World Geomagnetic Data Center (http://wdc.kugi.kyoto-u.ac.jp).


