[Retracted] Topological Optimum Approach for Improving Indicators for Agricultural Sustainability
Abstract
Background. The goal of this study is to improve the topological efficiency of agricultural production in Saudi Arabia’s allocated agriculture area. Method. The data envelopment analysis (DEA) topology was adopted to efficiently identify agricultural land utilization from 2009 to 2013. Results. According to the constant return to scale (CRS) topology, the area may be reduced by 8.7831667 percent in 2009, resulting in a given optimal crop yield scenario. Similarly, the area may be reduced by 3.9425506 percent in 2010 to attain a given optimum crop production topology, by 4.0198591 percent in 2011 to achieve the same amount of crop production, and by 1.0621519 percent in 2012 to attain the desired level of crop output. The topology of crop production could increase by 5.1334182 percent while retaining quality, according to the variable return to scale (VRS) topology while maintaining the same assigned area. Conclusion. Also using the linear programming approach to reproduce the results of CRS and VRS models.
1. Introduction
The topology of data envelopment analysis (DEA) is a method for estimating the efficiency of DMUs, which are homogenous organizational units that employ the same inputs to achieve the same outputs. The observed input and output topological indices are used to create a production possibility space, which is then compared to the individual units to determine their efficiency. Data envelopment analysis (DEA) has evolved into a valuable quantitative and analytical tool for assessing and evaluating performance. DEA has been successfully applied to a wide range of entities engaged in a wide range of activities in a number of situations around the world. This research covers the fundamental DEA models as well as some of their extensions. It has been used to examine active, conservational, and energy aspects of outcome [1], as well as estimating agriculturalist proficiency and numerous causes of crop [2–5]. This practice has gained widespread recognition and acceptance as a result of its nonparametric approach, which includes assisting with effective supply distribution, identifying effective operational procedures, expressing effective regulations, and tracking proficiency changes through time [6–8]. Farrell [9] made the first statement regarding determining the issue of dynamic productivity. Later, Charnes et al. [10] proposed topology of DEA as a standardized organizational strategy for identifying potential insufficiencies in output units that consume a variety of inputs and generate a numerical eruptivity.
The most important applications for topology of DEA technique are benchmark DMUs, the location and distribution of competent active rehearsals, specific credentials targets, the progress of successful policies, the ability to identify effectiveness changes over time, and supply distribution [11–15]. The most important use of DEA is its use in the banking sector. They mostly employ this DEA technique as a means of observing performance [16–19]. Logistics (see [20]) and renewable energy (see [21]) are two further areas where DEA can be useful. Assessment of school decision-making units has used the similar methodological approach [15, 22–25].
Recently, this technique has been utilized as an agricultural tool of multiset inputs and outputs for crop production [26], and water scarcity is a severe issue for irrigation systems; thus, it has been applied to estimate the productivity of irrigated assets [3, 27–32].
In this study, agriculture area (ha) is used as an input and crop productivity (ton) is used as an output. We evaluate the efficiency of decision-making units (DMUs) for benchmark/peer using CRS and VRS topological indices. The topology of scale efficiency was the most important efficiency indicator determining the overall productivity of agricultural inputs and outputs. The relative efficacy of CRS and VRS topological indices is also explored. The findings of the topological sustainability of crop water requirements and irrigation scheduling could be useful in guiding Saudi Arabia’s long-term agricultural progress [33]. The effectiveness with which a given set of inputs is used to produce an output is known as technical efficiency. If a company produces the most output from the least amount of inputs, it is said to be technically efficient (TE). Pure technical efficiency (PTE) metric assesses how much a company can reduce its inputs (in a set proportion) while staying within the VRS frontier. As a result, technical efficiency assesses the DMU’s overall success in making use of its inputs. Scale Efficiency (SE), a unit is scale efficient when its operational size is optimal, and any changes to its size will make it less efficient. Divide the aggregate efficiency by the technical efficiency to get the scale efficiency number. The purpose of this study is to determine what is causing low agricultural area usage skills (TE, PTE, and SE).
2. Topology of Material and Approach
This research region is a quadrilateral land mass that occupies a large chunk of the Arabian Peninsula, with an approximate area of 225000000 square kilometers (hectare). Mounts, dusty and rock-strewn meadows, saltern land and slag areas, and other habitats abound throughout the vast landscape. KSA can be divided into two distinct topographical regions: the western and southwestern parts, and the second waterless and extra waterless section in the KSA heartland. The interior of Saudi Arabia (Najd area) is located on the eastern side of the western and southwestern parts of the country. Its topography is varied and abandoned, with huge sandy oceans, plateaus (dissected and volcanic), minor peaks, plains, and so forth. From Taif to Yemen’s border, the peaks of the southwest create a nonstop pattern of cliffs. The highest points are over 2000 meters at Taif and in the south and over 3000 meters in the Abha region. Similarly, high peak sequence of climbs descends from the west, eventually joining the interior regions of the KSA. Saudi Arabia has a total area of 2150000000000 (m2) and a population of 266630303 million in 2009 and 30052518 million in 2013, according to World Bank data. In 2009, the total agriculture land was 1734350 (m2), which has gradually decreased due to population growth each year. In 2013, the total agriculture land was 1732950 (m2).
3. Topological Findings and Results Discussion
Table 1 shows the relative efficiency scale of input orientation.
| Numbers | DMUs | Input | Output | Ratio | Relative efficiency scale (RES) |
|---|---|---|---|---|---|
| Years | Agriculture area (ha) | Agriculture production (ton) | Out/input | ||
| DMU1 | 2008-2009 | 160356 | 2974368 | 18.54852952 | 0.912168333 |
| DMU2 | 2009-2010 | 184462 | 3603068 | 19.53284687 | 0.960574494 |
| DMU3 | 2010-2011 | 187078 | 3651225 | 19.51712655 | 0.959801409 |
| DMU4 | 2011-2012 | 194808 | 3919257 | 20.11856289 | 0.989378481 |
| DMU5 | 2012-2013 | 195605 | 3977539 | 20.33454666 | 1 |
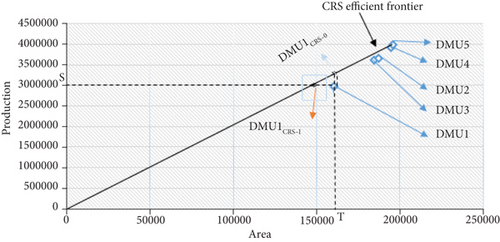
Figure 1 depicts the CRS efficient frontier beginning at the origin and passing through unit DMU5 (2012-2013). The opinion with the steepest gradient, or the largest output ratio (Agriculture Production/Agriculture Area), is DMU5 (2012-2013).

Between 2012 and 2013, one hectare of agricultural land produced 20.33454666 tons of crops, according to all decision-making units (3977539/195605 = 20.33454666). DMU5 is on the cutting edge, with a 100% efficiency rate. DMU1 (2008-2009), DMU2 (2009-2010), DMU3 (2010-2011), and DMU4 (2011-2012) are below the frontier, with RES below 100%. This means that DEA calculates relative efficiency rather than absolute efficiency.
In case of output orientation, see Table 2. The minimum productivity ratio is Agriculture Area/Agriculture Production.
| Numbers | DMUs | Input | Output | Ratio | Relative efficiency scale (RES) |
|---|---|---|---|---|---|
| Years | Agriculture area (ha) | Agriculture production (ton) | Input/output | ||
| DMU1 | 2008-2009 | 160356 | 2974368 | 0.05391263 | 0.912168333 |
| DMU2 | 2009-2010 | 184462 | 3603068 | 0.051195814 | 0.960574494 |
| DMU3 | 2010-2011 | 187078 | 3651225 | 0.051237051 | 0.959801409 |
| DMU4 | 2011-2012 | 194808 | 3919257 | 0.04970534 | 0.989378481 |
| DMU5 | 2012-2013 | 195605 | 3977539 | 0.049177393 | 1 |
3.1. Topology of Constant Return Scale (CRS) Efficient Frontier
When an increase in input leads to a corresponding increase in output, this is known as a constant return to scale (CRS). When the output grows at a faster rate than the input, this is known as increasing returns to scale. When all production variables are increased by a particular percentage, decreasing returns to scale occurs, resulting in a less-than-proportional increase in output.
Case 1. Input orientation with constant returns to scale.
DMU1 TES is equivalent to distance S(DMU1CRS-I) divided by distance S(DMU1). DMU1CRS-I is forecast of point DMU1 situated on the efficient frontier. Note that technical efficiency score (TES) of DMU1 (2008-2009), DMU2 (2009-2010), DMU3 (2010-2011), and DMU4 (2011-2012) are 91.2168333%, 96.0574494%, 95.9801409%, and 98.9378481%, respectively.
This means that DMU1 (2008-2009) could reduce the area of agriculture (input) by 8.7831667% (100-91.2168333) and still be able to produce the same quantity crop production (2974368 ton). Similarly, DMU2 (2009-2010) could reduce the area of agriculture (input) by 3.9425506% and produce the same quantity of crop production (3603068 ton). DMU3 (20010-2011) could reduce the area of agriculture (input) by 4.0198591% and produce the same quantity crop production (3651225 ton). DMU4 (20011-2012) could reduce the area of agriculture (input) by 1.0621519% and produce the same quantity crop production (3919257 ton).
Case 2. Output orientation with constant returns to scale.
DMU1 TES is equal to distance T(DMU1) divided by distance T(DMU1CRS-O). DMU1CRS-O is forecast of point DMU1 situated on the efficient frontier. This means that DMU1 (2008-2009) could increase the production quantity of crop (output) by 8.7831667% (100-91.2168333) and still have the same allocated area (160356 hectare). Similarly, we can find the TES for remaining inefficient decision-making units.
Hence, Cases 1 and 2 show that TES under CRS output and input orientation are same in Figure 2.
3.2. Topology of Variable Return Scale (VRS) Efficient Frontier
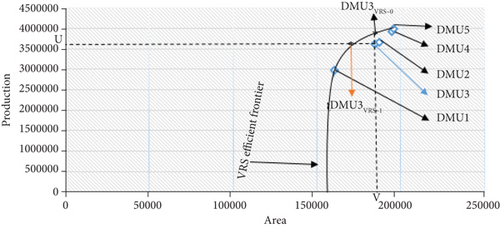
In DEA, variable returns to scale (VRS) is a type of frontier scale. If an increase or reduction in inputs or outputs does not result in a proportional change in outputs or inputs, it is easier to estimate efficiency. Both growing and diminishing returns to scale are included in this strategy. Figure 3 show the VRS efficient frontier is formed by enveloping of all the DMUs. DMU1 and DMU5 are on the frontier and have 100% efficiency. On other side, DMU 2, DMU 3 and DMU 4 are below the frontier and inefficient DMUs.
Case 1. Input orientation with variable returns to scale.
DMU3 TES is equivalent to distance U(DMU3VRS-I) divided by distance U(DMU3). DMU3VRS-I is forecast of point DMU3 situated on the VRS efficient frontier. Note that technical efficiency score (TES) of DMU3 (2010-2011) is 93.0927207%.
This means that DMU3 (2010-2011) could reduce the area of agriculture (input) by 6.9073% and produce the same quantity of crop production (3651225 ton). Similarly, we can find out the TES of DMU2 and DMU4.
Case 2. Output orientation with variable returns to scale.
DMU3 TES is equivalent to distance V(DMU3) divided by distance V(DMU1VRS-O). DMU3VRS-O is forecast of point DMU3 situated on the efficient frontier. This means that DMU3 (2010-2011) might escalate the production quantity of crop by 5.1334182% and still have the same allocated area (187078 hectare). Similarly, we can find the TES for the remaining inefficient decision-making units of variable return to scale.
3.3. Scale Efficiency, CRS, and VRS
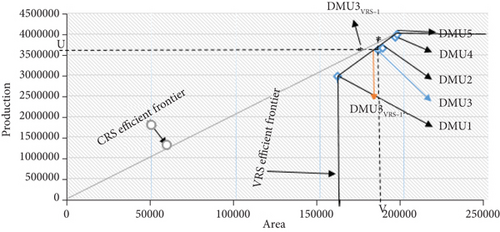
The CRS and VRS efficient frontiers are combined in Figure 3. As shown in Figures 3 and 4, DMU5 is efficient in both the CRS and VRS methods and lies on both frontiers. In the VRS supposition, DMU1 and DMU5 are both efficient, while DMU1 is inefficient in the CRS supposition. Finally, in both cases, DMU2, DMU3, and DMU4 are inefficient and do not reside on the frontiers. The gap between the CRS and VRS frontiers exists due to a scale problem; for example, DMU1 is efficient under VRS. Should DMU1 be as productive as point DMU5, which is only efficient under CRS decision-making unit, unit DMU1 must revise its scale by operating at point DMU1CRS-I to become efficient under CRS. In Figure 4, some decision-making units (DMU2, DMU3, and DMU4) are not located on the VRS frontier. These decision-making units are not just undersized but also underperforming; e.g., DMU3 must transfer to point DMU3VRS-I situated on VRS frontier in direction to convert VRS efficient. Furthermore, DMU3 must transfer from point DMU3VRS-I to point DMU3CRS-I to make CRS efficient.
- (i)
Pure efficiency (or VRS efficiency)
- (ii)
SE
The input-oriented efficiency shows the three relationships in Table 3.
| TE of DMU3 with CRS | TE of DMU3 with VRS | SE of DMU3 |
|---|---|---|
|
|
|
|
3.4. Topology of Nature of Return of Scale (NRS)
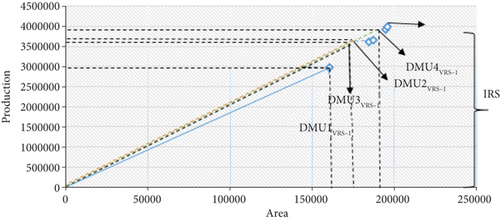
The NRS of decision-making units is inefficient scale under the CRS frontier. In Figure 5, CRS efficient DMU1CRS−I of point DMU1 is originally inefficient under CRS but efficient under VRS. Figure 5 shows that the decision-making unit points DMU2CRS−I, DMU3CRS−I, and DMU4CRS−I are efficient under CRS method and the points DMU2VRS−I, DMU3VRS−I, and DMU4VRS−I are efficient under VRS method. Similarly, points DMU2, DMU3, and DMU4 are inefficient under both methods.
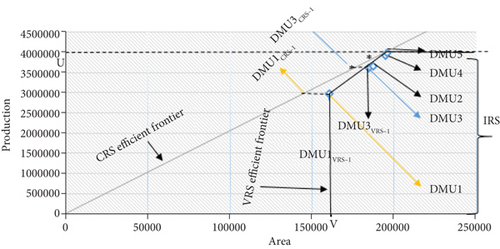
To recognize the NRS, one has to emphasis gradient of the well-organized units DMU1, DMU3VRS−I, DMU2VRS−I, DMU4VRS−I, and DMU5.
- (1)
DMU5 situated on both CRS and VRS efficient frontiers. DMU5 takes the maximum yield (3977539/195605 = 20.3345466) under VRS. It works best at a point where the size of the area has no bearing on efficiency. This occurs when the average agricultural area usage is minimized, and agricultural crops reach their optimal state. In the CRS technique, however, the change in output is proportional to the change in input
- (2)
Projected point of a decision-making units DMU1, DMU3VRS−I, DMU2VRS−I, and DMU4VRS−I are situated at a position where the scale has a positive influence on efficiency (see Figure 6). The efficiency of DMU1 (2974368/160356 = 18.54852952) is lesser to the output of DMU3VRS−I. The ratio of efficiency is growing with the scale. This condition happens until reaching the DMU5, which has an efficiency of 20.33454666, and DMU1, DMU3VRS−I, DMU2VRS−I, and DMU4VRS−I are therefore facing IRS. In this condition, the average agricultural area ingesting drops while agricultural production escalations. DMU1, DMU3VRS−I, DMU2VRS−I, and DMU4VRS−I have not yet touched their optimum value. To escalate their scales output, they have to increase their outcomes. In a condition of IRS, the difference in output is 1%; the results in a difference in input is less than 1%.
3.5. Benchmarks/Peers
For each inefficient decision-making unit, the DEA recognizes the nearest efficient decision-making unit on the border. Benchmarks/peers are a form of decision-making unit that is efficient. To increase their performance, inefficient decision-making units must choose the optimum performance indicator depending on their benchmarks. Only the DMU5 unit, according to CRS, is in the optimum location. As a result, it serves as a benchmark for any remaining nonoptimal DMUs.
DMU1 and DMU5 are the only units in VRS assumption that lay in the optimal position, while DMU2, DMU3, and DMU4 are inefficient units. DMU1 and DMU5 are benchmarks for DMU2, DMU3, and DMU4 in Figure 5.
4. Mathematical Approach of Methodology
We first defined key parameters before using equations to demonstrate the DEA technique. Two decision-making units (DMUs) were chosen, each with two inputs and outputs. The technical efficiency of the CRS DEA model vs the VRS DEA model may now be compared using the following linear programming tasks.
4.1. CRS-DEA Linear Programing Model
In this model, m is the number of input criteria; s is the number of output criteria; xik is the value of ith input criterion for kth alternative; yjk is the value of jth output criterion for kth alternative; vi and uj are the nonnegative weight variable to be determined by the solution of the minimization problem.
4.2. VRS-DEA Linear Programing Model
In this model, k is the number of input criteria; s is the number of output criteria; xik is the value of ith input criterion for kth alternative; yrk is the value of rth output criterion for kth alternative; and λj is nonnegative weight variable to be determined by the solution of the minimization problem, where v is a scalar and λ is a vector of constants each value is 1. The efficiency value, v, of each year can be obtained, and it satisfies v ≤ 1. If v = 1, DMU is a technically efficient institution. Otherwise, it suggests that the DMU is inefficient from a technological standpoint. If the efficiency value v in a given year equals 1, the DMU is a very good practice area and can be used as a standard for other DMUs with a score proficiency value less than 1.
Using the DEA-Solver LV8.0/CCR-I, we apply the input-oriented CRS-DEA model (1). With five DMUs, this problem has two inputs (clover area and other area) and two outputs (clover production and other production) (2008-2009, 2009-2010, 2010-2011, 2011-2012, and 2012-2013). Tables 4–6 exhibit the statistics and correlations for input/output data.
| Clover area (ha) | Other area (ha) | Clover production (ton) | Other production (ton) | |
|---|---|---|---|---|
| Max | 126611 | 69125 | 2659449 | 691251318090 |
| Min | 102106 | 58250 | 1999703 | 974665 |
| Average | 120160 | 64301.8 | 2474597 | 1150484.2 |
| SD | 9136.307613 | 4214.333323 | 242487.4802 | 130576.4794 |
| Correlation | ||||
| Clover area (ha) | 1 | 0.812875941 | 0.998399751 | 0.776184712 |
| Other area (ha) | 0.812875941 | 1 | 0.842111564 | 0.993182224 |
| Clover production (ton) | 0.998399751 | 0.776184712 | 1 | 0.808762168 |
| Other production (ton) | 0.776184712 | 0.993182224 | 0.808762168 | 1 |
| No. | DMU | Score | Rank | Clover area (ha) Data |
Projection | Diff. (%) | Other area (ha) Data |
Projection | Diff. (%) | Clover production (ton) Data |
Projection | Diff. (%) | Other production (ton) Data |
Projection | Diff. (%) |
|---|---|---|---|---|---|---|---|---|---|---|---|---|---|---|---|
| 1 | 2008-2009 | 0.9324 | 5 | 102106 | 95201.82434 | -6.762 | 58250 | 51878.23071 | -10.939 | 1999703 | 1999703 | 0 | 974665 | 991103 | |
| 2 | 2009-2010 | 1 | 1 | 122563 | 122563 | 0 | 61899 | 61899 | 0 | 2528441 | 2528441 | 0 | 1074627 | 1074627 | 0 |
| 3 | 2010-2011 | 0.9959 | 4 | 123837 | 123329.131 | -0.41 | 63241 | 62981.64181 | -0.41 | 2550789 | 2550789 | 0 | 1100436 | 1109992 | 0.868 |
| 4 | 2011-2012 | 0.998 | 3 | 125683 | 125428.1321 | -0.203 | 69125 | 68349.42102 | -1.122 | 2634603 | 2634603 | 0 | 1284603 | 1305776 | 1.648 |
| 5 | 2012-2013 | 1 | 1 | 126611 | 126611 | 0 | 68994 | 68994 | 0 | 2659449 | 2659449 | 0 | 1318090 | 1318090 | 0 |
| Average | 0.9853 | 2.8 | 120160 | 118626.6175 | -1.475 | 64301.8 | 62820.4586 | -2.4942 | 2474597 | 2474597 | 0 | 1150484 | 1159918 | 0.8406 | |
| Max | 1 | 5 | 126611 | 126611 | 0 | 69125 | 68994 | 0 | 2659449 | 2659449 | 0 | 1318090 | 1318090 | 0 | |
| Min | 0.9324 | 1 | 102106 | 95201.8243 | -6.762 | 58250 | 51878.2307 | -10.939 | 1999703 | 1999703 | 0 | 974665 | 991103 | 0 | |
| St dev | 0.0296 | 1.78889 | 10214.7024 | 13194.1335 | 4711.7679 | 4711.7679 | 6879.1252 | 4.743 | 271109 | 271109 | 0 | 145989 | 145395 | 0.834 |
- DMU2 (2009-2010) and DMU5 (2012-2013) are efficient DMUs, and the remaining three DMU1 (2008-2009), DMU3 (2010-2011), and DMU4 (2011-2012) are inefficient. Table 5 also displays the data of the problem’s average value, maximum value, minimum value, and standard deviation (1). These findings show that reducing the average clover and other area by -1.475 (ha) and -2.4942 (ha), respectively, yields the same amount of average clover output while simultaneously increasing the average of other production by 0.8406 ton.
| Clover area (ha) | Other area (ha) | Clover production (ton) | Other production (ton) | |
|---|---|---|---|---|
| Max | 126611 | 69125 | 2659449 | 1318090 |
| Min | 102106 | 58250 | 1999703 | 974665 |
| Average | 120160 | 64301.8 | 2474597 | 1150484.2 |
| SD | 9136.307613 | 4214.333323 | 242487.4802 | 130576.4794 |
| Correlation | ||||
| Clover area (ha) | 1 | 0.812875941 | 0.998399751 | 0.776184712 |
| Other area (ha) | 0.812875941 | 1 | 0.842111564 | 0.993182224 |
| Clover production (ton) | 0.998399751 | 0.842111564 | 1 | 0.808762168 |
| Other production (ton) | 0.776184712 | 0.993182224 | 0.808762168 | 1 |
The results of input-oriented VRS-DEA model (2) are obtained by using the DEA-Solver LV8.0/CCR-I. This problem is consistent with the two inputs (clover area and other area) and two outputs (clover production and other production) with five numbers of DMUs (2008-2009, 2009-2010, 2010-2011, 2011-2012, and 2012-2013). Table 5 shows that DMU1 (2008-2009), DMU2 (2009-2010), DMU4 (2011-2012), and DMU5 (2012-2013) are efficient DMUs, and DMU3 (2010-2011) is inefficient DMUs. The statistics and correlation on input/output data are shown in Tables 6 and 7.
| No. | DMU | Score | Rank | Clover area (ha) Data |
Projection | Diff. (%) | Other area (ha) Data |
Projection | Diff. (%) | Clover production (ton) Data |
Projection | Diff. (%) | Other production (ton) Data |
Projection | Diff. (%) |
|---|---|---|---|---|---|---|---|---|---|---|---|---|---|---|---|
| 1 | 2008-2009 | 1 | 1 | 102106 | 102105.7215 | 0 | 58250 | 58250 | 0 | 1999703 | 1999703 | 0 | 974665 | 974665 | |
| 2 | 2009-2010 | 1 | 1 | 122563 | 122563 | 0 | 61899 | 61899 | 0 | 2528441 | 2528441 | 0 | 1074627 | 1074627 | 0 |
| 3 | 2010-2011 | 0.9979 | 5 | 123837 | 123253.9725 | -0.471 | 63241 | 63108.55025 | -0.209 | 2550789 | 2550789 | 0 | 1100436 | 1116121,895 | 1.425 |
| 4 | 2011-2012 | 1 | 1 | 125683 | 125682.7272 | 0 | 69125 | 69124.16984 | -0.001 | 2634603 | 2634603 | 0 | 1284603 | 1284625.663 | 0.002 |
| 5 | 2012-2013 | 1 | 1 | 126611 | 126611 | 0 | 68994 | 68994 | 0 | 2659449 | 2659449 | 0 | 1318090 | 1318090 | 0 |
| Average | 0.9996 | 1.8 | 120160 | 120043.2842 | -0.0942 | 64301.8 | 64275.096 | -0.042 | 2474597 | 2474597 | 0 | 1150484 | 1153635.915 | 0.2854 | |
| Max | 1 | 5 | 126611 | 126611 | 0 | 69125 | 69125 | 0 | 2659449 | 2659449 | 0 | 1318090 | 1318090 | 1.425 | |
| Min | 0.9979 | 1 | 102106 | 102105.7215 | -0.471 | 58250 | 58249.76 | -0.209 | 1999703 | 1999703 | 0 | 974665 | 991103 | 0 | |
| St dev | 0.0009 | 1.7889 | 10214.7024 | 10165.5281 | 0.2106 | 4711.768 | 4719.452 | 0.0934 | 271109 | 271109 | 0 | 145989 | 144813.4601 | 0.6371 |
- These findings demonstrate that reducing the average of clover area by -0.0942 ha and the average other area by -0.042 ha yields the same amount of average clover production while increasing the average other production by 0.2854 ton.
5. Conclusion
In this research, data envelopment analysis (DEA) is used to assess the effectiveness of land utilization for irrigation in KSA crop production from 2009 to 2013. The data envelopment analysis technique will become more important in the future as a measure of research input-output efficiency. The purpose of this study was to take steps to improve Saudi Arabia’s agricultural land efficiency. By comparing crop production competence to results from other studies, we were able to answer the agriculture land-related questions that had arisen in this research area, as this technique has the advantage of being able to accurately estimate the indigenous crop production problem using data from studies or official sources. Computational techniques are also employed to solve linear programming problems to ensure the validity of these findings. These LP solutions are what makes this research study unique.
Abbreviations
-
- DEA:
-
- Data envelopment analysis
-
- CRS:
-
- Constant return to scale
-
- VRC:
-
- Variable return to scale
-
- DMU:
-
- Decision-making unit
-
- DMU1:
-
- Decision-making unit (2008-2009)
-
- DMU2:
-
- Decision-making unit (2009-2010)
-
- DMU3:
-
- Decision-making unit (2010-2011)
-
- DMU4:
-
- Decision-making unit (2011-2012)
-
- DMU5:
-
- Decision-making unit (2012-2013)
-
- IRS:
-
- Increase return scale
-
- TES:
-
- Technical efficiency scale
-
- RES:
-
- Relative efficiency scale
-
- TECRS:
-
- Relative efficiency under CRS
-
- TEVRS:
-
- Relative efficiency under VRS
-
- PTE:
-
- Pure technical efficiency
-
- SE:
-
- Scale efficient
-
- NRS:
-
- Nature of returns to scale.
Conflicts of Interest
The authors declare that they have no conflicts of interest.
Acknowledgments
The author extend their appreciation to the Head of Department, Majmaah University, Saudi Arabia.
Open Research
Data Availability
The data that support the findings of this study are available from the corresponding author upon reasonable request.


