A Small Target Detection Method Based on the Improved FCN Model
Abstract
Traditional object detection is mainly aimed at large objects in images. The main function achieved is to identify the shape, color, and trajectory of the target. However, in practice, small target objects in the image must be detected in addition to large targets. Common small target detection (STD) is mainly used in intelligent transportation, video surveillance, and other fields. Small targets have small size, few pixels, and low resolution and are easily blocked. Small object detection has emerged as a research problem and a hotspot in the field of object detection. This study proposes an improved FCN model based on the full convolutional neural network (FCN) and applies it to the STD. The following is the central concept of the proposed method. Small targets are prone to occlusion and deformation in the image data. The deformation here is mainly reflected in the larger shape obtained by shooting at different angles. Therefore, it is a challenge to fully and accurately obtain the characteristics of small targets. The traditional method based on multilayer feature fusion cannot achieve ideal results for STD. This study is based on FCN and introduces a spatial transformation network. The network can optimize the handling of problems such as partial occlusion or deformation of small objects. The use of a spatial transformation network can alleviate the problem of poor feature extraction caused by partial occlusion or deformation of small targets, improving final detection accuracy. The experimental results on public datasets show that the proposed method outperforms other deep learning algorithms (DLA) in the detection accuracy of small target objects. Furthermore, the model’s training time is reduced. This study’s research provides a good starting point for the detection, recognition, and tracking of some small objects.
1. Introduction
STD technology is widely used in real-life production, such as intelligent transportation [1–3], medical image diagnosis in medicine [4–6], image retrieval [7–9], remote sensing image analysis [10–12], and military applications [13–15]. Target detection is mainly used to identify the target object from the data to be detected, including the position, shape, size, and color of the object. Traditional object detection-related research mainly focuses on large objects. In recent years, people have begun to focus on STDs. The detection of small objects is more difficult than the detection of large objects. For example, in unmanned scenarios, vehicles need to avoid in time, and small objects also need to be correctly identified [16]. In medical image detection, when small tumors appear in the body, STD can assist doctors in making a diagnosis [17]. In remote sensing images, there are many elements, such as buildings, bridges, vehicles, and so on. The identification of these contents is of great significance [18]. STD is very difficult because the size and resolution of the data obtained are low. The accuracy of STD has gradually improved as computer vision technology has matured. On the other hand, the need for STD in various application scenarios also increases simultaneously. Therefore, it becomes very urgent to find a general STD method with a good detection effect and insensitive to data.
Target detection mainly includes two categories, detecting specific target objects and detecting specific categories of target objects. The so-called specific target objects usually refer to specific target object instances such as landmarks or faces. The specific categories of objects refer to different categories of target objects as research objects, such as people, cars, bicycles, and other different categories of target objects. Initially, people only focused on the detection of a specific category or categories of objects. Later, with the gradual improvement of target detection technology and the continuous in-depth research of scholars, a single category of target detection can no longer meet people’s needs. Therefore, the construction of complex, complete, and general target detection models has become the direction of scholars’ continuous in-depth research and exploration. The core idea of target detection based on machine learning is to input an image and calibrate the area where the target object is located. Feature extraction for the target object. The extracted features are input into the trained classifier for object recognition. References [19–21] are typical machine learning-based object detection-related research. The problem with this method is that the hand-designed features have a poor generalization and poor robustness, and cannot cope with complex detection tasks well. Therefore, STD based on DLA [22] were born one after another. Reference [23] introduces R–CNN to object detection. The core idea of this method is to extract multiple candidate frames after inputting image data. The candidate regions are input into a convolutional neural network (CNN) to obtain candidate features. Finally, the candidate features are input to the support vector machine (SVM) for target object recognition. Reference [24] is based on reference [23], and the STD results obtained are significantly improved. Reference [25] proposes an improved CNN, the Faster R–CNN algorithm.
Through comparative analysis of the above studies, it is found that although the success rate of STD is getting higher and higher, there are still some difficulties that need to be solved. In the detection process based on deep learning, there are still the following problems. First, the features extracted by each convolutional layer in the model are different. After the convolutional layer extracts the features, they are fed to the prediction layer. Since the proportion of small objects in the entire image is very small, the information is more dispersed after feature extraction through multiple convolutional layers, which eventually leads to the model being unable to accurately predict the type or location of small objects. Second, due to the small proportion of small objects in the image data, the proportion of positive and negative samples is unbalanced, which easily leads to the overfitting of the trained model. Typically, the number of negative samples far exceeds the number of positive samples. Third, most models improve detection rates by deepening the network. Although this method can upgrade the detection accuracy of the model, the large model will lead to a decrease in the detection rate. To address the aforementioned issues, this study combines Spatial Transformation Network (STN) and FCN. The proposed network spatially transforms and aligns the input image and output feature maps, respectively, during training. Thus, the problem of difficult feature extraction and poor feature learning effect caused by the angle of the shooting of small objects is improved.
2. Knowledge about STD
2.1. Traditional STD
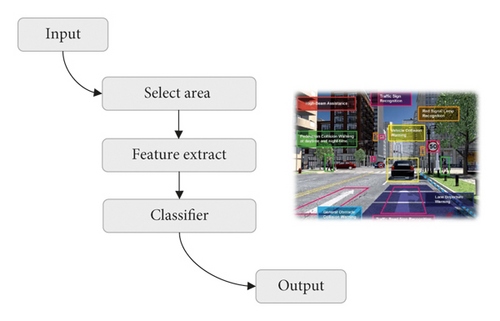
Dimensions are further divided into relative dimension definitions and absolute dimension definitions. The relative size is calculated based on the width and height of the original image. Objects less than or equal to one-tenth the width or height of the original image are considered small objects. Absolute dimensions are based on standards established by the international organization SPIE. In N × N images, objects smaller than 0.12% of the overall image are identified as small objects. The traditional target detection algorithm uses a preset window to perform sliding traversal on the input image to extract candidate frames. The obvious flaw of this method is that it does not capture the unique characteristics of the target. Methods are inefficient and difficult to execute. Figure 1 depicts the flow of the traditional target detection method.
2.2. STD Based on DLA
The hand-designed features in traditional target detection algorithms have the problems of weak generalization and poor robustness. Therefore, traditional methods cannot efficiently deal with complex detection tasks. In this context, STD based on DLA emerges as the times require. DLA can automatically extract features. The extracted feature information is rich, which can effectively improve the precision of STD. The progress of STD based on DLA is shown in Figure 2.
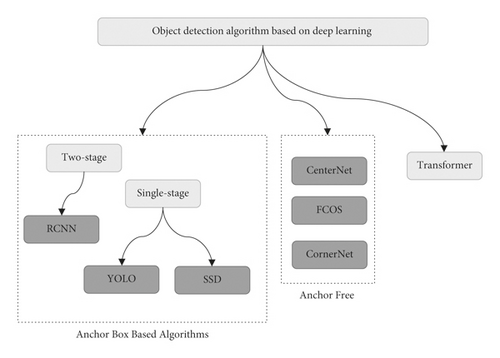
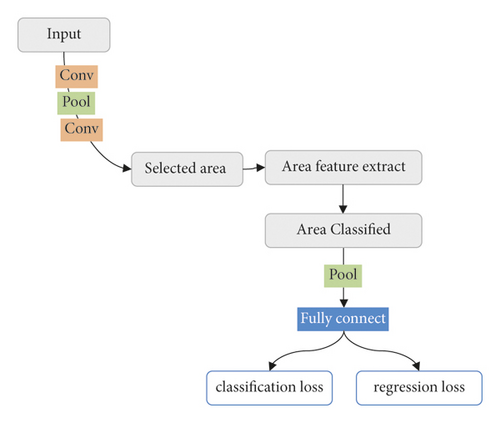
The two-stage algorithm shown in Figure 2 is the most widely studied. The structure of the two-stage class algorithm is shown in Figure 3. After extracting the sample features, the training is divided into two steps. First, while training the network, the feature map will be classified into regions, so as to make a preliminary prediction of the target location. Second, perform precise positioning and correction for the predicted position.
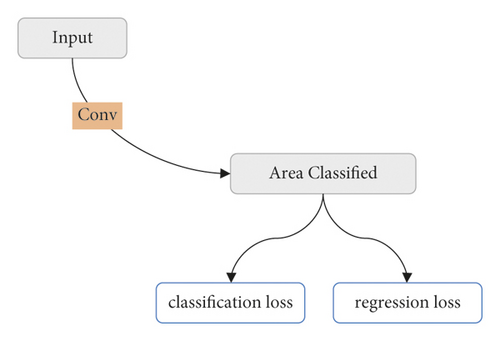
In addition to the two-stage algorithm, some scholars have also proposed STD based on the single-stage algorithm. Compared with the Two-stage algorithm, the single-stage algorithm mainly gives the category and location information of the small target through the backbone network. Although this method sacrifices the accuracy of detection, it improves the training speed of the algorithm. Figure 4 shows the structure of the Single-stage class algorithm. First, the image to be detected is input to the convolutional layer. Second, directly perform probabilistic detection on the category of the object and locate the area where the object is located. The Single-stage algorithm abandons the candidate region generation stage when performing STD, and only needs a single detection to obtain the detection result.
3. Improved FCN Model
3.1. R-FCN
In traditional convolutional neural networks, due to the excessive use of pooling layers, the translation-invariance performance of the network is improved when performing image classification tasks. However, translation variance is required when performing object detection tasks, requiring the model to be position-sensitive. In order to solve the above problems, R-FCN specially encodes the position information, and additionally outputs a position-sensitive score map after the traditional full convolution layer, so as to maintain the entire frame volume. The structure of the product also realizes the “translational changeability”. To emphasize position sensitivity, R-FCN adds a position-sensitive RoI pooling layer on top of the entire fully convolutional network. In this way, the entire fully convolutional layer can both share computation and encode positions.
R-FCN includes an object detection module, which has a significant effect on the localization and classification of object detection. The network training process mainly includes two stages: region proposal and region classification. The purpose of the region proposal stage is to select candidate regions. The region classification stage performs classifier operations on candidate regions. Figure 5 shows the R-FCN structure. As can be seen from the figure, R-FCN mainly consists of 4 parts, namely the basic convolutional network, RPN network, ROI Pooling pooling layer, and classification network.
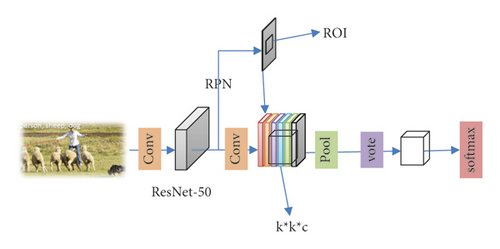
The basic network selected by R-FCN is a deep residual network with a depth of 50. R-FCN mainly performs convolution and pooling on the input image data. The region proposal part uses the ResNet-50 network. The output of this network is the candidate region. The region proposal network uses multiple convolution kernels to convolve the input samples to obtain a tensor. This tensor is fed into two separate convolutional layers.
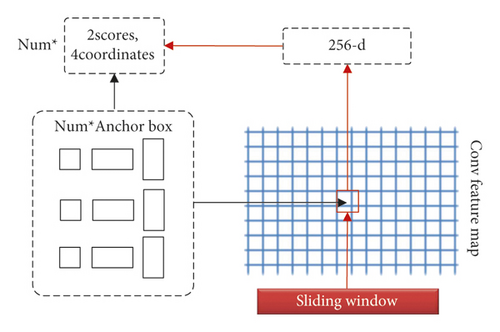
Figure 6 presents the structure of the region proposal model. The principle of this network work is to use multiple search boxes of different sizes to search for a certain area. The unique name of the search box is the anchor. For each image input to the RPN network, there are about 20,000 initial search boxes. After subsequent de-overlapping processing, the number of search boxes will be greatly reduced.
3.2. Improved FCN
When the traditional fully convolutional neural network detects small objects, the region suggestion operation is performed in each iteration. Moreover, thousands of candidate boxes often need to be extracted. Therefore, the model is very time-consuming to train. R-FCN improves the region proposal process, and the number of candidate boxes extracted is reduced from thousands to hundreds. However, R-FCN has not achieved the desired effect in terms of detection accuracy. In order to improve the R-FCN model and improve its detection accuracy for small targets. When improving the model, the following rules need to be followed. If the number of convolutional layers is large, the recall rate of the model is high, but the localization ability of the target position is poor. With a small number of convolutional layers, although the localization ability of the target position can be enhanced, the recall rate will be reduced. Therefore, a good model needs to grasp the relationship between the two.
The new hyperfeature designed in this study can well achieve this purpose. The core idea is to extract the feature map and give the location and other information of the small target as accurately and efficiently as possible. This study combines hyperfeatures and R-FCN to propose an improved FCN model. The model in this study changes the network structure and shortens the time required for network training. Hyperfeatures are extracted through the HyperNet model. The frame structure of HyperNet is shown in Figure 7. First, the image to be tested is input to the convolution layer to extract feature data. Second, the feature data extracted from each layer are fused together and input into a unified space to generate hyperfeatures. Third, 160 candidate regions are extracted using a region proposal network. Finally, we use the detection model to classify the candidate regions to obtain the final detection result.
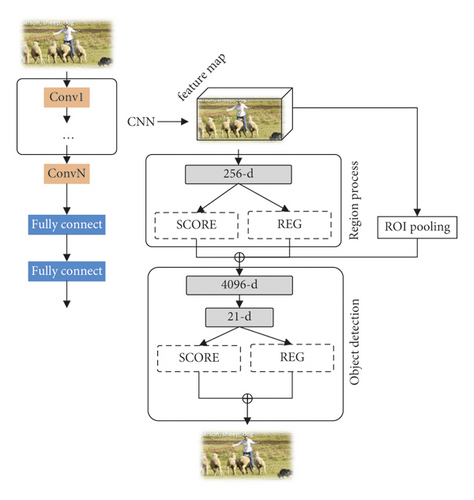
The improved FCN mainly includes four steps of hyperfeature extraction, region proposal generation, target detection, and fusion training. Details of each step are described below:
The first is hyperfeature extraction. For different convolutional layers, HyperNet gives different processing methods. For the bottom convolutional layer, it is mainly to increase the maximum pooling layer. For high-level convolutional layers, deconvolution operations are added. The essence of this operation is upsampling. Each convolutional layer corresponds to a sampled result. The function of convolution is not only to extract the information of the image, but also to realize processing such as feature compression. The compressed features also need to be normalized to obtain feature cubes. This feature cube is the hyperfeature. Typically, the normalization method used in the compressed space is local response normalization.
The second is the generation of region proposals. The depth of the network is crucial to the feature extraction ability of the network. Therefore, a small convolutional neural network is added to the selection of candidate regions section. This network has very few layers, only three layers. They are RoI Pooling, convolutional layer, and fully connected layer, respectively. Connected behind the network are two output layers. After passing through this small convolutional neural network, each image will generate tens of thousands of initial candidate boxes. There are some errors in the size and resolution of these candidate boxes, and the next layer of the network will select and improve these initial candidate boxes.
For the output bins, the ROI pooling layer usually uses a dynamic max pooling method for processing. To optimize the network, two additional layers are added after the ROI Pooling layer of the HyperNet network. These two layers contain encoding and scoring layer, respectively. The encoding layer is responsible for encoding the position of the candidate box output by the previous layer to generate a three-dimensional feature cube. And encode the feature cube again to generate a 256-dimensional feature vector. The scoring layer is responsible for outputting the probability of the existence of small targets. When the scores of all candidate boxes are calculated, it usually happens that the scores are the same. To minimize this occurrence, the nonmaximum suppression (NMS) method is used. The idea of this method is to decide whether to retain each candidate box by setting a threshold. Determine the relationship between the IoU threshold of all candidate frames and the set threshold. When the IoU threshold is greater than or equal to the set threshold, the candidate frame is retained. When the IoU threshold is less than the set threshold, the candidate frame is removed. In most studies, the loU threshold is usually set to 0.7. Before NMS operation, more than 1000 candidates are usually generated per sample. After the NMS operation, the number of candidate regions is reduced by 80 percent.
The third is target detection. Existing research has proved that in the network structure, the method based on the cross-connection of the fully connected layer and the dropout layer has the potential to improve model performance. Based on the inspiration of this theory, this study improves the HyperNet structure in two aspects. One is to add a convolutional layer before FC to improve the classification effect. The size of the convolutional layer is set to 3 × 3 × 63. The introduction of convolutional layers can also reduce the feature dimension and optimize subsequent calculations. The second is to change the dropout ratio from 0.5 to 0.3. Experiments show that this operation can improve the training efficiency of the network.
In the candidate region extraction process, the network will have two outputs. All candidate boxes can calculate M + 1 values and adjustment values of 4 × M candidate boxes. M indicates the number of target categories contained in the image to be tested. The 1 in M + 1 represents the background of the image. The introduction of the NMS method can reduce the existence of identical candidate boxes. But the number of candidate boxes removed would not be many. Most of the candidate boxes have been removed in the previous step.
The fourth is fusion training. The candidate boxes are classified by setting a threshold. When the candidate frame’s IoU threshold is greater than or equal to the set threshold, the candidate frame is classified as a positive sample. When a candidate box’s IoU threshold is less than the set threshold, the candidate box is classified as a negative sample. When training the network, we choose any deep network as the base network. In this study, a deep neural network was selected for training. The base network is used to separately train the HyperNet network to generate hyperfeatures. When the candidate frame of the image to be inspected is extracted, the target detection module will classify the candidate frame and continue to call back to train a better HyperNet. When HyperNet is trained, hyperfeatures are generated. This feature is mainly used for final classification. During the training of the improved FCN model proposed in this study, the extraction of candidate regions and the detection network are both trained separately. After joint training, information is shared between the two networks to extract hyperfeatures. Finally, the two networks are merged into a completely large network.
4. Experimental Setup and Result Analysis
4.1. Experimental Data
This study uses two public datasets for experimental analysis, namely, PASCAL VOC and Microsoft Common Objects in Context (COCO) datasets. The details of the two datasets are as follows:
4.1.1. PASCAL VOC
PASCAL VOC mainly includes two subdatasets, PASCAL VOC207 and PASCAL VOC 2012. The PASCAL VOC data have a total of 20 categories, as shown in Table 1.
| Category | Target |
|---|---|
| Humanity | People |
| Animal | cat, cow, horse, bird, dog, sheep |
| Indoor | Sofa, chair, bottle, dining table, plant, TV |
| Vehicle | Bicycles, planes, boats, cars, trains, buses, motorcycles |
Among them, the number of images and objects of PASCAL VOC 2007 and PASCAL VOC 2012 are shown in Table 2. The data in the table show that the database contains a large number of samples as well as a large number of small target samples. It serves as the test library for the majority of the current STD algorithms.
| Dataset | Training set | Validation set | Test set | |||
|---|---|---|---|---|---|---|
| Picture | Object | Picture | Object | Picture | Object | |
| PASCAL VOC 2007 | 2501 | 6301 | 2510 | 6307 | 4952 | 12032 |
| PASCAL VOC 2012 | 5717 | 13609 | 5823 | 13841 | — | — |
4.1.2. COCO
COCO mainly includes two subdatasets: COCO-2014 and COCO-2017. The number of images in the training set and test set in the COCO-2014 dataset is 82783 and 118287, respectively. There are a total of 80 object classes in this dataset, which are divided into large, medium, and small objects. The size and proportion of each target are shown in Table 3.
| Category | Proportion (%) | Min pixel | Max pixel |
|---|---|---|---|
| Small target | 41 | 0 × 0 | 32 × 32 |
| Medium target | 34 | 32 × 32 | 96 × 96 |
| Big target | 25 | 96 × 96 | ∞ × ∞ |
4.2. Evaluation Indicators and Experimental Environment
The environment used in this experiment is: Ubuntu 20.10 64 bit operating system, Intel(R) Core(TM)i7-7700 processor, 64 GB memory, NVIDIA GeForce GTX 3060Ti graphics card, and the experimental model is studied in the deep learning framework TensorFlow 2.3.0. The number of network iterations is set to 5000 during model training, and the learning rate is set to 0.001.
4.3. Analysis of Experimental Results
The research in this study belongs to STD based on DLA. For the fairness of the experiment, the following DLAs are introduced as a comparative study. The main comparison algorithms are CNN [26], RNN [27], FCN [28], HR-FCN [29], Fast R-CNN [30], YOLOv3 [31], and STDN [32]. The detection precision of eight small objects in the 2007 dataset is shown in Table 4.
| Target\method | CNN | RNN | FCN | HR-FCN | Fast R-CNN | YOLOv3 | STDN | Proposed |
|---|---|---|---|---|---|---|---|---|
| Bottle | 52.25 | 54.03 | 56.61 | 57.86 | 62.43 | 65.84 | 54.71 | 61.96 |
| Plant | 41.87 | 49.91 | 44.06 | 51.00 | 57.56 | 47.74 | 53.79 | 56.27 |
| Chair | 57.87 | 48.59 | 59.33 | 50.52 | 54.46 | 55.94 | 53.95 | 62.98 |
| Boat | 64.79 | 69.36 | 59.63 | 64.79 | 72.43 | 73.39 | 69.63 | 73.57 |
| Tv | 74.46 | 75.74 | 72.57 | 69.57 | 77.01 | 72.76 | 68.01 | 77.82 |
| Table | 67.47 | 76.50 | 75.79 | 64.98 | 70.78 | 76.31 | 68.40 | 78.74 |
| Bird | 77.33 | 77.30 | 77.39 | 76.87 | 79.47 | 69.25 | 69.94 | 81.16 |
| Sheep | 74.71 | 69.69 | 73.06 | 70.94 | 78.29 | 77.63 | 75.54 | 82.30 |
| MAP | 63.84 | 65.14 | 64.81 | 63.32 | 69.05 | 67.36 | 64.25 | 71.85 |
Each algorithm in Table 4 has a better detection effect on the four target objects of Boat, TV, Bird, and Sheep. This shows that these kinds of objects have rich and obvious features compared to other small objects. For Bottle, comparing the detection results of different algorithms, it can be seen that YOLOv3 has the highest detection rate, followed by Fast R-CNN, and the third is the proposed algorithm. For plant, the detection rates of all algorithms are relatively low, Fast R-CNN has the best detection effect, followed by the proposed algorithm but the gap between the two is smaller. From Chair to MAP, the detection results of the proposed method are higher than other methods. Therefore, on the whole, the detection effect of the proposed algorithm is better.
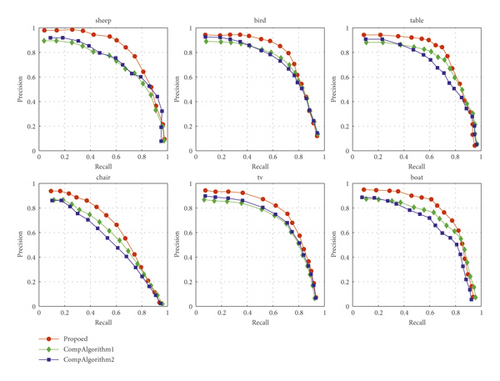
Figure 8 presents the average P-R curves of each model for eight small object detections on the VOC 2007 dataset. The larger the area of the curve, the better the model’s performance. Figure 8 shows the curve area obtained by each model very intuitively. The largest area is table, and boat, which shows that the detection effect of these two small targets is good. In addition, we observed that no matter what kind of small target results, the P-R curve area obtained by the model used in this paper is the largest compared with other models, which shows that the method in this paper is the best.
Different IOU settings will result in different mAPs. For the COCO dataset, different confidence levels have different detection precision. APx represents the detection precision obtained when the confidence level is x, and the subscript x is from 50 to 75. Table 5 shows the AP values calculated by each model on the COCO dataset. Figure 9 graphs the AP values obtained by each model for easy comparison and viewing.
| Model | AP50 | AP55 | AP60 | AP65 | AP70 | AP75 |
|---|---|---|---|---|---|---|
| CNN | 53.22 | 51.22 | 51.09 | 50.31 | 47.07 | 42.12 |
| RNN | 52.19 | 50.57 | 48.33 | 44.05 | 42.81 | 36.91 |
| FCN | 53.53 | 51.44 | 47.91 | 44.68 | 42.57 | 38.19 |
| HR-FCN | 55.21 | 53.21 | 50.53 | 48.65 | 45.45 | 43.38 |
| Fast R-CNN | 55.16 | 54.63 | 53.86 | 52.91 | 51.52 | 48.02 |
| YOLOv3 | 57.84 | 57.46 | 55.98 | 53.84 | 52.24 | 51.59 |
| STDN | 54.75 | 51.75 | 49.91 | 47.50 | 44.11 | 38.67 |
| Proposed | 59.97 | 59.46 | 55.53 | 54.93 | 53.47 | 48.19 |
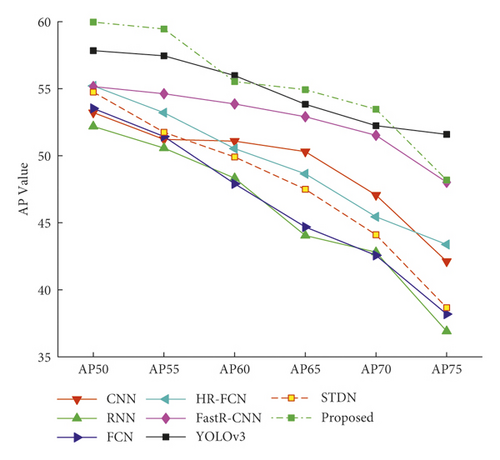
The experimental results on the COCO dataset show that the highest detection rate is obtained when the confidence level is 50. On the other hand, the AP of the proposed algorithm is optimal in most cases, no matter how the confidence changes. Followed by YOLOv3, when the confidence is 60, the AP of the two algorithms is the same. When the confidence level is 75, the AP obtained by YOLOv3 is higher than the proposed algorithm. The APs of other comparison algorithms are lower than YOLOv3 and the proposed model. The experimental results demonstrate that the proposed method can produce a more ideal AP.
5. Conclusion
With the development of technology, people have put forward higher requirements for STD in terms of speed and precision. The difficulty of STD is that the area of the target is small, so its proportion in the original image is small, and it is difficult for the detection algorithm to extract rich and effective features. The end result is that small object detection is not effective. Second, the neural network is dominated by the large target in the learning process, and the small target is ignored in the whole learning process, which leads to the poor detection effect of the small target, especially if there are many network layers, the characteristic information of the small target will be lost. In order to further improve the effect of STD, this study proposes an improved FCN model. Its core idea is to embed the spatial transformation network into the framework of FCN. By processing the deformation or multiangle input samples, it is more convenient for subsequent classification and identification. This can avoid the situation of low recognition accuracy caused by small target deformation or multiangle problems. The improved FCN mainly includes four steps of hyperfeature extraction, region proposal generation, target detection, and fusion training. The experimental results on two public datasets show that the proposed algorithm can achieve ideal detection accuracy. There are still several shortcomings in this study, such as when the background of the picture is complex, it will interfere with the detection of small objects, thus affecting the detection results. In addition, the classifier of the used network can be further optimized later to improve the classification accuracy and efficiency of the classifier.
Conflicts of Interest
The author declares that there are no conflicts of interest.
Acknowledgments
This work was supported by Zhengzhou Railway Vocational and Technical College.
Open Research
Data Availability
The labeled dataset used to support the findings of this study is available from the corresponding author upon request.


