[Retracted] Data Collection and Analysis in Sports Practice Teaching Based on Internet of Things Technology
Abstract
Since entering the new century, people’s living standards have been continuously improved, living conditions have been continuously improved, which is the embodiment of the improvement of the country’s comprehensive strength, the increase in national strength has made the development of sports faster and faster, and the annual output value of sports is also increasing year by year. However, there are still many places that do not pay attention to practical content; in view of these problems, we use the Internet technology to collect and analyze the data of sports practice teaching; in this chapter paper, we use the 2SPLM observation matrix method and CS-MDGA algorithm, so that the collected sports practice teaching data is more quick and convenient to be analyzed. This paper also uses a large number of chart data to confirm the correctness and accuracy of their views, making the paper more reliable. The study shows that the teaching of physical education in China is increasing year by year, indicating that the teaching of physical practice in China is developing in a better direction. The mathematical modeling in the abstract section of the article uses computational methods such as constrained nonnegative matrix decomposition and constrained nonnegative matrix decomposition model optimization algorithm that integrates external information for research.
1. Introduction
In recent years, the Internet of Things technology has developed towards the direction of information technology in sports practice. This paper mainly introduces the rapid development of the Internet of Things (IoT) technology and its wide application in sports practice, mainly according to the actual situation of the Internet of Things technology; the control network and information network integration of the Internet of Things technology are studied, and it is proposed to combine the Internet of Things technology and sports practice teaching. At the same time, a professional information system was designed [1]. Based on the content of the Internet of Things technology, the application principle of the Internet of Things technology that can be used for sports practice teaching management is studied. The system architecture model and data processing logical structure model of the physical education visual management system are designed. Through research, the system can sense the body production environment sensors and physical condition sensors, so that it can predict, warn, and actively control various hazards to the body. Information from human body sensors and production progress sensors can be sensed to improve the efficiency of exercise and reduce the consumption required by the body. Improve the decision-making ability of athletes and improve the effectiveness of exercise [2]. This paper focuses on the connection between the Internet of Things (IOT) technology and the teaching of physical education practice. In view of the many problems in the development process of traditional physical education practice teaching, a series of the Internet of Things technology models are proposed. Through comparative research, the advantages of the information utilization model from information to function are verified. Finally, the model proposes that based on unified information collection, the true interconnection of transportation can be realized. It can greatly save the cost of technology transfer, tap the potential value of information, and promote the emergence of sustainable information service markets and industrial upgrading [3]. In this paper, a case study is presented to illustrate how off-the-shelf IoT components can be combined into a secure and low-cost sensing system that can be used for a variety of physical education practice teaching applications. Examples include smart sports practice operation or logistics chain monitoring. Our goal is to provide end-to-end security between deployed sensor gateways and sports users. Our solutions are aligned with the data-centric security concept in future sports practices currently under development [4]. Aiming at the shortcomings of traditional sports safety monitoring system, this paper designs a sports safety monitoring system based on the Internet of Things (IoT). The system establishes a network overheating and humidity sensor through Zigbee, a gas sensor to detect physical health parameters, and then transmits data to the ARM server, stores the received data in the database, and accesses the Internet through the network, and the client computer and smart phone access the ARM server data in various modes through the Internet [5]. This paper finds that the imperfection of the old teaching and sports system and to create a more perfect teaching system, provide effective physical education practice teaching for various colleges, and provide talents for each college [6]. This article explains the various mistakes and problems in the practice of school sports, and tries to further discuss the innovation and ideas of college sports practice in the current situation of college sports [7]. This thesis is mainly to observe the collection and interview of three physical education teachers over a period of 16 weeks, joint teaching practice, so that students can establish the core values of trust and respect, so that in the school PE class, we can be more practiced and better used in colleges and universities [8]. Under the background of quality education, physical education practice teaching faces the problem of insufficient education training methods, and this paper proposes a solution by constructing a practical teaching model. A sound system of teaching quality and evaluation of physical education practice has been established, and the steps for the realization of this model are proposed [9]. In this paper, the teaching schemes and techniques on how to improve the physical education teaching practice are discussed, and the physical education teaching practice plan is also optimized and combined, and this set of physical education teaching has been proved to be feasible in practice. It promotes the improvement of the quality of physical education practice and makes the teaching purpose more easily achievable [10]. This paper mainly demonstrates the design and methods of collecting data for decision-making and problem solving in the practice of physical education in colleges and universities. General guidelines are provided for practice, and a set of data analysis is proposed to develop estimates and solutions [11]. This paper mainly introduces that data collection and analysis is the basic condition of society; due to the dynamic behavior of various behaviors that may produce false data, we will analyze contemporary information and historical cases in order to reduce false information, so that the data becomes more accurate and reliable [12]. As mobile technology becomes more common in modern society, users are finding more and more innovative ways to take advantage of the collection and analysis of the latest data. Data collection, in particular, has changed dramatically thanks to wireless technology [13, 14]. This paper mainly introduces the equipment of data collection and analysis, compares historical data and stores it in a unit with collector collection, and converts the results of the analysis into historical graphs, so that the analysis of data becomes simpler and clearer [15]. Data collection and analysis covers quantitative and qualitative methods of data collection and analysis in social research, making data collection and analysis more simple and convenient and easy to understand [16].
2. The Importance of Teaching Professional Practice in Physical Education
In school teaching, practice is an important lesson to test students’ practice results and plays an important role in developing college students’ sense of innovation and improving the quality of talent training in colleges and universities and is an indispensable value. In China’s 13th Five-Year Plan, it is proposed to accelerate the integration of industry and education and the cultivation of applied and skilled talents, deepen the practical teaching of college students, and comprehensively develop the innovation and entrepreneurship capabilities of college students. From this, we can conclude the important value of professional practice teaching in physical education in colleges and universities. It is the professional practice teaching of physical education that can promote the improvement of college students’ education and teaching level, better adapt to the requirements of the workplace, and help the continuous improvement of the training standards of physical education professionals in colleges and universities.
2.1. Physical Education Professional Practice Teaching Objective System
Physical education professional practice teaching goal system is an important standard to lead the professional practice teaching of physical education. In the process of professional practice teaching of physical education, the development of students’ cognitive ability, physical education teaching skills, educational emotional values, and other aspects of the level of physical education cognitive ability refers to the abstract theoretical knowledge mastered by college students through physical education time teaching, transformed into more emotional; scientific physical education teaching rational cognition and practice helps college students to better transform the sports skills mastered into practical teaching capabilities, so as to meet the job skill needs of college students’ physical education teaching. Similarly, in the process of practical teaching, the skills training of college students also includes the organization skills of teaching plan design, sports meetings and other activities, and school sports work skills.
2.2. Optimize the Teaching of Professional Practice Courses in Physical Education
The construction of the physical education professional practice teaching content system is an important starting point for accelerating the exercise of the practical teaching ability of college physical education majors; promoting the improvement of college students’ employability; comprehensively increasing the cognition, action skills, and values of physical education college students in colleges and universities; and further attaching importance to theory in the current practical teaching curriculum system, increasing practicality, focusing on development, comprehensively optimizing the curriculum architecture, and cultivating the ability of college students. Accelerate the cultivation of application-oriented talents.
2.3. Organize Campus Sports Practice Activities to Enhance Physical Fitness
Organizing campus sports activities is a key measure to enhance physical fitness and achieve physical education goals. On the basis of not affecting the basic teaching order, we should be able to enrich physical activities as much as possible, and truly let sports enter the campus and enter life, thereby improving students’ participation in sports activities and providing support for further realizing the quality education goals of physical education classrooms. Under the pressure of heavy schoolwork, students have time and opportunities to relax and achieve physical fitness.
3. Algorithm Data Design Implementation and Collection
3.1. Network Model with Problem Description
Definition 1 Dense random projections (DRP). DRP is a dense observation matrix, which contains O(N) nonzero elements per row, usually selecting (2) to construct a dense observation matrix:
3.2. SPLM Observation Matrix Design
Thus, event A holds as a minimal probability event, i.e., the null hypothesis substandard, so matrix Φs. The probability of approaching “1” is full of rank.
3.3. CS-MDGA Algorithm
For CS data collection in an unreliable tree topology under the link, it has both a packet loss “correlation effect” and a false positive problem of packet reception by the sink, while the SPLM false positive problem of the sink side, so it is necessary to discover relevant systems to solve the problem of losing “relevant data” search. In essence, the “correlation effect” of packet loss is caused by the weighted superposition processing of data packets in the process of CS data collection, which is also the advantage of CS data collection. Therefore, the most effective way to solve the “correlation effect” of packet loss is to ensure the reliability of link transmission and avoid the occurrence of correlation packet loss. Under premise of ensuring that data compression ratio is unchanged, the number of observations is required by different network sizes. The process of obtaining data is different, which in turn changes the value of the type of judgment result, so different types of proportions will not only lead to all the data of computer but also affect integrity copy path construction cs between two points and the safety of transportation, which in turn affects the algorithm performance. The cost of achieving reliable transmission guarantee for the entire network of roads is huge, drastically reducing its value, and SPLM observed the ability of the matrix to observe and found a way to cross-compress the perception of the data; the entire website data is evenly distributed entry (TF) and CS, where TF is used to collect and forward numbers, it is not related to the file, the CS data is sent and obtained in the CS data acquisition data, and the lost files are consistent. For the obtained data at the center of the TF point, the use of SPLM observations can only defeat the missing values that have a relationship with cs; in addition to the use of SPLM observation, other mechanisms are designed to ensure the safety performance of CS node transportation. CSMA/CA (Carrier Sense Multiple Access with Collision Avoidance) is a random competition MAC protocol with simple algorithms and good performance. Its Chinese name is Carrier Listening For Multiple Access/Collision Avoidance.
4. Multipath Transmission Mechanism
In the process of obtaining data in the CS-MDGA method, the TF point is routed along the MST route with a normal forwarding effect to obtain the result, as shown in the effect in Figure 2, and its data does not produce a “special effect”; CS points participate in data discovery along the MST in the CS data state, thus achieving the purpose of algorithm data design. The above algorithm is based on the 2SPLM observation matrix and CS-MDGA algorithm decomposition of the algorithm data design and implementation of the whole process and can achieve the purpose of data algorithm design and implementation; after obtaining the characteristics of the data, you can carry out other work arrangements for the user.
5. Analysis of Important Indicators in the Teaching of Physical Education Practice
5.1. Practical Teaching Results Analysis
We evaluated the findings in three parts: skill assessment, skill development assessment, and athlete endurance goal assessment. Test scores from all students are collected almost weekly as a reference for talent assessment to better understand student skills and skill management. The athletic abilities demonstrated on site will serve as a source of data to evaluate the analysis of students’ athletic abilities [17].
The examination process is defined as:
Step 1. Student comes for the exam in accordance with the group for the on-site sports skills display, the assessment place is the school gymnasium, and 7 physical education call the teacher to grade each student.
Step 2. The assessment takes place in classrooms where they are usually trained. Teachers assess students’ development potential based on the recordings of students’ regular training. On-site skill performance and growth points are calculated with a maximum of 100 points.
Step 3. The assessment location is the equipment room; the teacher opens the student’s examination file in the equipment room, and analyzed by different mathematical techniques, the student’s difficulty failure rate is counted.
Step 4. Compare the scores to the six groups horizontally and then in portrait orientation.
5.2. Analysis of the Results
From the data analysis in Table 1, it can be seen that the overall performance of Dan’s three students remained stable, while the ratings of “very good,” “good,” and “poor” did not change, although the best training was not in physical education class. With specific guidance, they can achieve great results. The outcomes of the traditional learning model and its professional level are stable and maintained at a certain level. However, the comparison of the six groups shows that the first three groups are slightly higher than the latter three groups at the same level, and the average score of the first three groups is 1.9 points higher than the corresponding comparison. In practice performance, the third group scored 5.4 points higher than the sixth group average. The data shows that the intermediate group has a slight advantage over the traditional group in skill assessment, and the final score is slightly higher than the other groups.
| Constituencies | Number | Average score | Ranking |
|---|---|---|---|
| Group I | 10 | 92.5 | 1 |
| Group II | 10 | 88.7 | 2 |
| Group III | 10 | 75.2 | 3 |
| Group IV | 10 | 90.6 | 4 |
| Group V | 10 | 81.5 | 5 |
| Group VI | 10 | 69.8 | 6 |
From the data in Table 2, we can see that the 6 groups have the same number of 10 people. The average score of the first group is 83.6, ranking second; the average score of the second group is 91.4, ranking first; the average score of the three groups is 81.7, ranking 3rd; the average score of the fourth group is 80.4, ranking 4th; the average score of the fifth group is 79.3, ranking 5th; the average score of the sixth group is 75.5, ranking 6th. The error rate in Table 3 refers to the frequency of mistakes by the number of people surveyed who have taken the difficulty of testing in sports practice performances.
| Constituencies | Number | Average score | Ranking |
|---|---|---|---|
| Group I | 10 | 83.6 | 2 |
| Group II | 10 | 91.4 | 1 |
| Group III | 10 | 81.7 | 3 |
| Group IV | 10 | 80.4 | 4 |
| Group V | 10 | 79.3 | 5 |
| Group VI | 10 | 75.5 | 6 |
| Constituencies | Number | Error rate | Ranking |
|---|---|---|---|
| Group I | 10 | 9 | 1 |
| Group II | 10 | 13 | 3 |
| Group III | 10 | 27 | 5 |
| Group IV | 10 | 12 | 2 |
| Group V | 10 | 21 | 4 |
| Group VI | 10 | 32 | 6 |
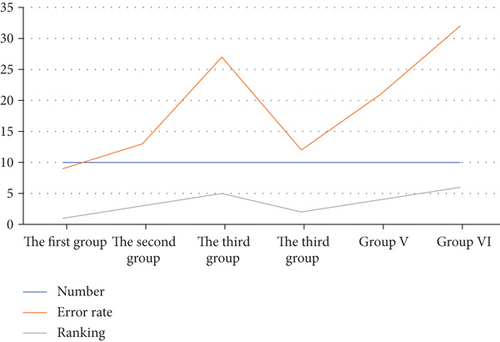
The results in Table 3 are basically the same as the experimental results in Table 1, indicating that the student has a good foundation in the traditional teaching mode and has a good performance. Compared with the students, the conventional teaching mode with good qualities has a good performance. Compared with the first three groups of students, the effect of grasping the error rate is not very good. The first group had a 3% lower error rate than the fourth group; the second group had an 8% lower error rate than the fifth group; the third group had a 5% lower error rate than the sixth group. The environment of the on-site drill under the stadium and the usual practical training is quite different, and the simulated real sports practice created by the special training technology makes the students get better promotion in training, so the first three groups of students in the same environment play more stable and excellent. It can be seen that the accumulation of students’ performance experience through the practical training applied by special training techniques is helpful to the grasp of the details of sports training. The data of the three scoring tables that are integrated to obtain a comparative figure of the result is shown in Figure 1.
The analysis of Figure 1 shows that students who use digital audio technology in their teaching experience significant improvements in skills, learning efficiency, and error management. Emphasize students’ traditional teaching skills, emphasizing experiences of learning and correcting mistakes, but they are slightly inferior to the number group.
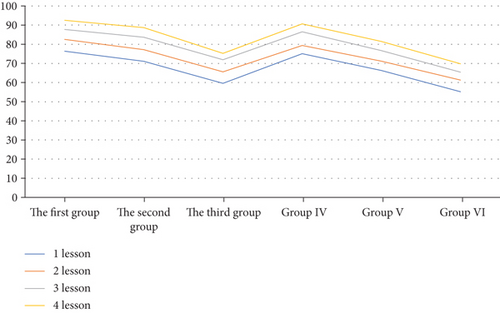
To better assess the impact of learning methods on learning outcomes, teachers also assessed students’ practical training on the target trajectory recorded in each lesson after each major, based on the students’ skill level. In practical classes, the fourth year is chosen from the final grades. After the scores were combined, the mean was calculated, and the data was analyzed, resulting in the comparison table of ordinal scores in Figure 2.
The ordinate coordinates in Figure 2 represent the average of the students’ technical skills displayed in the practical training after the unified scoring is calculated by group. Analyzing Figure 2, as the teaching progresses, the teaching time of the application of digital audio technology increases, and the results achieved by the students’ skill demonstration have increased accordingly and exceed the teaching results achieved in the general pattern. It can be seen that special training techniques have a proven role in promoting students’ skills upgrading.
5.3. Analysis of Sports Practice Errors
Comparison of male and female athletes’ mistakes is shown in Figure 3.
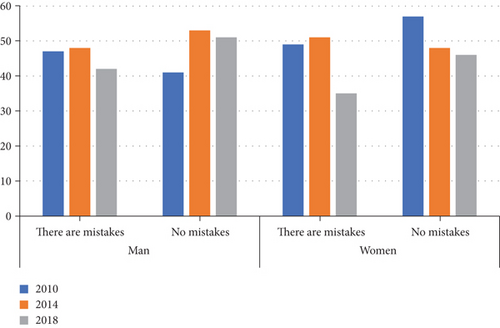
In Figure 3, we can see that in 2010, men had 47 mistakes and women had 49 mistakes; in 2014, men had 48 mistakes and women had 51 mistakes; in 2018, men had 42 mistakes. Women had 35 mistakes.
5.4. Types of Mistakes and Their Causes
The types of errors are shown in Figure 4
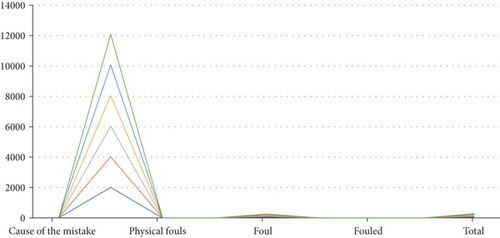
Figure 4 shows that the main selection types of athletes account for 60.58% of the total number of male athletes and 65.92% of the total number of female athletes. It seems that most errors occur during playback. Both male and female athletes suffer from physical causes, but the corresponding errors will affect the athlete’s state adjustment, and when the athletes cannot adjust their mentality correctly, it will affect the performance of the competitors. The abscissa of Figure 4 represents the types of mistakes made by athletes in competitions and is the cause of various errors collected from athletes in a large amount of competition data.
Annual output value and grownth rate are shown in Figures 5 and 6
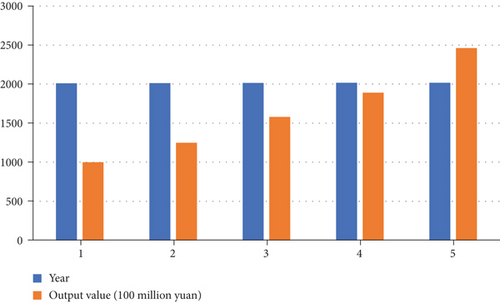
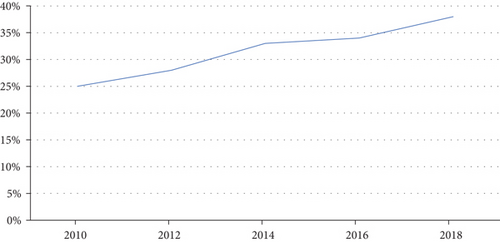
In the analysis of Figures 5 and 6, the annual output value of sports in 2010 was 10 billion yuan, the annual output value of sports in 2012 was 125 billion yuan, the annual output value of sports in 2014 was 162 billion yuan, the annual output value of sports in 2016 was 194 billion yuan, and the annual output value of sports in 2018 was 240 billion yuan. The strategy of a sports power has led to an increase in the annual output value of sports and an annual output value of more and more large, and the annual output value growth rate of sports will continue to accelerate according to this trend.
6. Conclusion
Through the matrix algorithm and experimental comparison, it can be concluded that the study of sports state is an important material, because sports is a complex art form, and the physical state of the athletes is good, so communication is the starting point of the coach. If you want to be proficient in psychology, you need to strengthen psychological training, continuously accumulate practical experience, develop your psychological processing ability, and have a deeper understanding of the meaning of psychology. Only by improving as much as possible can we better understand the mental state of practice. In this era of information explosion, personal leadership can completely solve the problem of information overload, by creating the right algorithms that take consumers’ personal preferences into account, presenting products consumers like, reducing the complexity of consumer’s choice, and significantly increasing sales quantity to the service provider.
Conflicts of Interest
The author declares no conflicts of interest regarding this work.
Acknowledgments
This work was supported by the Social Science Project of Hunan Sports Bureau, No. 2021XH052.
Open Research
Data Availability
The experimental data used to support the findings of this study are available from the corresponding author upon request.


