[Retracted] HANA: A Performance-Based Machine Learning and Neural Network Approach for Climate Resilient Agriculture
Abstract
The importance of agricultural crops in India has been understated in terms of production during the last two decades, owing to global warming and other factors. Policymakers and farmers would benefit from imagining crop yields well before harvest to help them make appropriate marketing and storage decisions. Crop yields will benefit from such estimates as well. Several systems for predicting and modelling agricultural yields have been developed in the past, with varying degrees of effectiveness, due to the fact that they do not objectively account for meteorological aspects and seasonal climate variations. The importance of agricultural crops in India has been understated in terms of production during the last two decades, owing to global warming and other factors. Policymakers and farmers would benefit from imagining crop yields well before harvest to help them make appropriate marketing and storage decisions. Crop yields will benefit from such estimates as well. Several systems for predicting and modelling agricultural yields have been developed in the past, with varying degrees of effectiveness, due to the fact that they do not objectively account for meteorological aspects and seasonal climate variations. The method makes use of climate data from Thanjavur, India’s soils. To choose the optimal crop for a particular set of input and climate conditions, the system leverages real-time input of location-specific soil attributes. The model is been tested with various machine learning techniques such as NB, KNN, SVM, and decision tree. Among all these methods, the SVM gives the good results. The accuracy of the model was determined using LSTM, SVM, and Tabu search optimization. TSO with SVM has an 89% accuracy value.
1. Introduction
Human foresight, on the other hand, has reached a limit, and as a result, people have created a variety of complicated assets to understand and manage various aspects of life. Artificial intelligence has been a goal since the dawn of computer technology. Climate change’s impacts are becoming more apparent. Storms, droughts, wildfires, and flooding have all intensified and become more common.
Ecosystems around the world, especially natural resources and agriculture [1], are changing, putting civilization in jeopardy. Potability of water [2–4] is a major concern due to environmental changes. The theory that climate influences development and development influences climate has gained currency in recent years. Increased emissions from the energy, industrial, and agriculture sectors, as well as extensive deforestation and rapid changes in land use and land management practises, have all contributed to significant changes in the earth’s gaseous composition in recent decades [5–9].
Climate change will halt progress and put the lives of current and future generations in jeopardy if it is not addressed. According to several researchers and analysts, the core logic and principles of machine learning are firmly equal to nonparametric terms of estimate [10].
Instead, it might simply prioritise importance in the forecasting or prediction of new examples, which is a considerably simpler function that requires fewer cases. Weather has a significant impact on crop productivity. A rising empirical literature models this relationship in an attempt to predict the effects of climate change on the sector. The extent and severity of these consequences are determined by the climate system’s evolution as well as the relationship between agricultural productivity and weather. This research focuses on predicting future yields using weather data. Accurate weather-to-crop-yield models are critical not just for anticipating agricultural consequences [11, 12].
In previous methods, they either used ML algorithms or DL algorithms separately so they could not conclude with an optimal result. Our proposed approach composes of ML, DL, and optimization technique which yield good results [13–20].
We present a detailed review of machine learning applications in agricultural production systems in this paper. Yield prediction, disease detection, weed detection, crop quality [21], and species recognition were among the crop management applications; animal welfare and livestock production were among the livestock management applications; water management included water management applications; and soil management included soil management applications. The articles have been categorised and chosen to show how machine learning can benefit agriculture. The algorithms are used in south most district of India (Thanjavur) where the major cultivation is rice and paddy [22–25].
2. Support Vector Machines
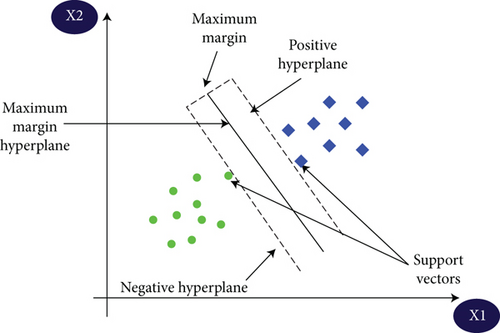
A “support vector machine” is a machine that uses vectors to solve problems. Intrusion detection systems, handwriting recognition, protein structure prediction, digital image steganography detection, and more applications use the SVM algorithm [26–28]. Each point is represented as a data item in an n-dimensional space in the SVM technique, with the coordinate value of each feature. The support vector machine (SVM) is a linear method in theory. Figure 1 explains the flow of SVM.
2.1. Support Vector Machines: Implementation
An SVM classifier can be created using Python’s sklearn package. The steps of the SVM algorithm are as follows:
Install the required libraries first.
Step 2: split the X and Y variables after importing the dataset.
Step 3: separate the dataset into training and testing regions.
Create the SVM classifier model in step four.
The fifth step is to fit the SVM classifier model.
The sixth phase is to make forecasts.
Step 7: evaluate the model’s efficacy.
2.2. LSTM
Before you can grasp recurrent networks, you must first understand the fundamentals of feedforward networks. Figure 2 explains LSTM pattern. The way these networks convey data is by a sequence of mathematical operations carried out at the network’s nodes, which is how they get their names. The first carries data straight through (never hitting the same node twice), but the second loops it, and the latter is called recurrent. In supervised learning, the input samples are fed into feedforward networks and converted into an output; the result is a label, which is a name assigned to the input [13–18, 29, 30].
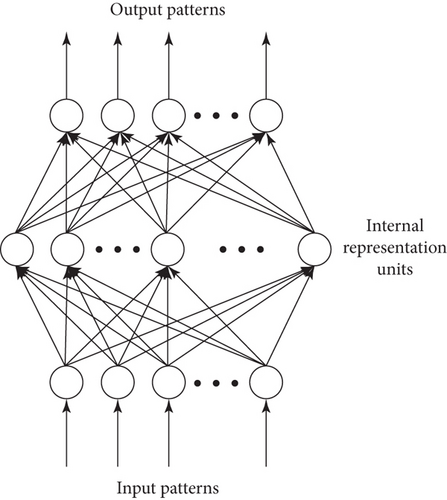
In other words, they map raw data to categories by recognising patterns that, for example, would suggest a “cat” or “elephant” label for an input image. A feedforward network is trained on labelled images until it can accurately categorise them with the fewest errors [11, 20, 22–25]. Using the pretrained set of parameters, the network categorises data it has never seen before (or weights, generally called as a model). A trained feedforward network can be fed any random collection of images, and how it classifies the first shot does not always affect how it classifies the second. A photograph of a cat and an elephant will not be linked on the Internet.
2.3. Tabu Search
Tabu search is a metaheuristic approach for locating the best elucidation by inspecting the nodes in your immediate vicinity. The most prominent feature of Tabu search is its memory-based capacity. To arrive at an exact answer, it integrates the values of the neighbours [5, 29]. The idea for the Tabu search was created by Fred Glover. The most cost-effective and efficient approach is to use Tabu search. Tabu searches have two features: memory adaptation and response analysis. It regularly probes the greater complexities of neighbouring nodes in order to obtain a precise answer. Recency, frequency, quality, and influence are the four stages of Tabu’s memory. Tabu uses the concept of access through the recent neighbour node, and hence, the access will be more appropriate and quicker.
2.4. Implementation
The dataset with ground water level components is passed to LSTM neural networks, which identify the nature of ground water level, indicating whether the ground water is good for cultivation, and the good level cadre of water alone is passed to SVM, which recommends the necessary crop cultivation along with Tabu search to increase production. The proposed architecture is explained as a block diagram in Figure 3.
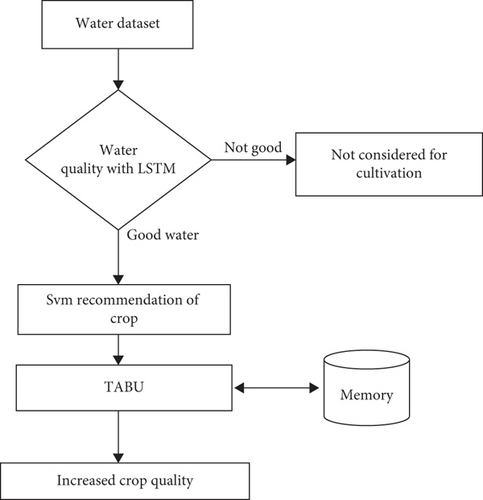
The dataset is stored in a CSV file with various values such as TDS premonsoon, postmonsoon, EC1, BOD, COD, Na, and PB with all levels of premonsoon and postmonsoon, and the values are divided as good water and not good water using LSTM, and the same is provided as the data set to ML algorithms attached with Tabu. The good water level is solely taken into account for agriculture purposes and then passed on to ML algorithms for computation. Figure 4 is a rapid miner tool implementation of LSTM with the output. Figure 5 is an orange implementation of LSTM output comparison with NB and Tabu. Figure 6 is an implementation of LSTM output given to NB and Tabu. Figure 7 is an orange implementation of LSTM output given to decision tree and Tabu. Figure 8 is an output of LSTM given with Tree and Tabu. Figure 9 is an orange implementation of LSTM output given to KNN and Tabu. Figure 10 is an output of LSTM output with KNN and Tabu result. Figure 11 is an orange implementation of LSTM data followed by SVM and Tabu. Figure 12 is the output of SVM.
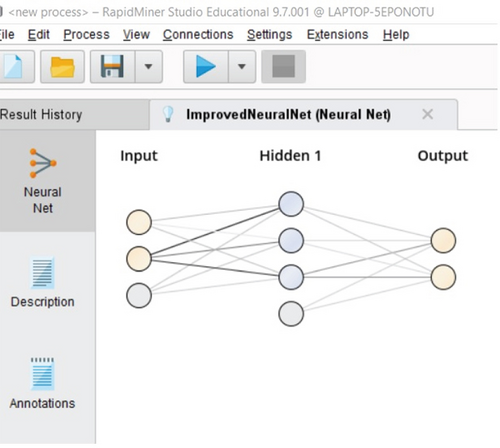
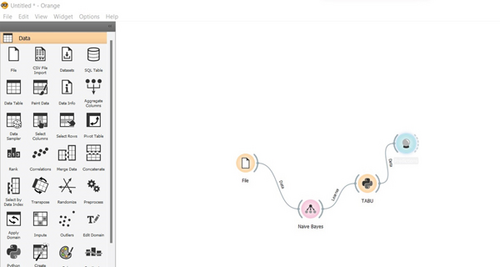
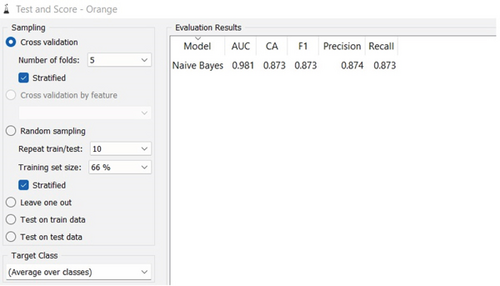
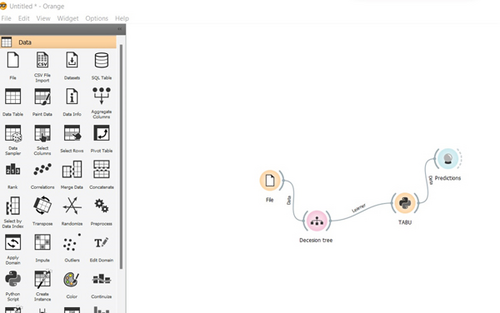

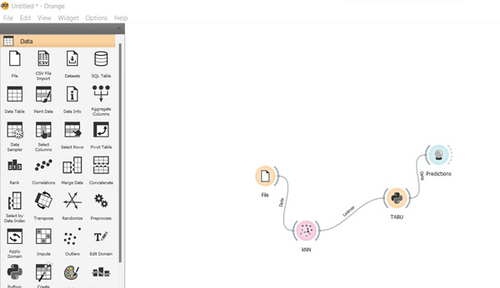

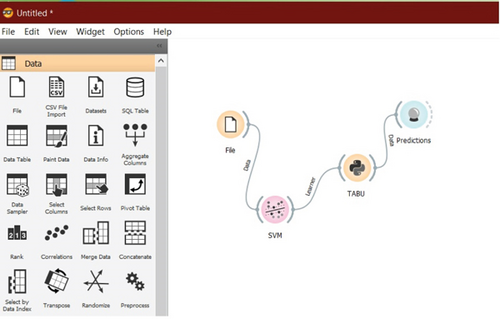

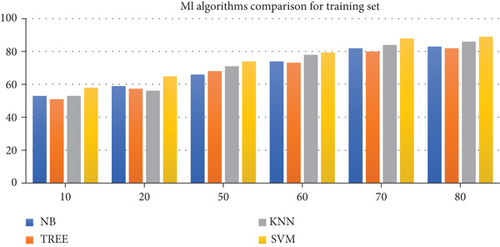
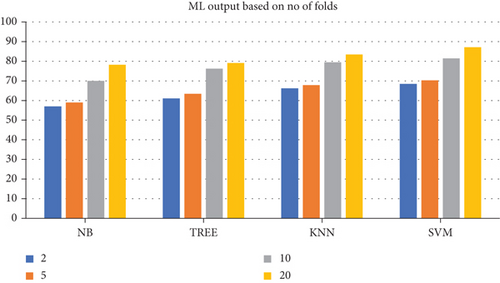
Rapid miner is used to forecast the LSTM results with the ground water level dataset. The data set is divided into two categories: agriculturally useful and agriculturally ineffective. For the next stage of execution, only the suitable for agriculture is considered. The orange tool is used to manage with different machine learning algorithms such as Naïve Bayes, decision tree, KNN, and SVM [27, 28, 30–32]. Tabu is executed in Python and combined with SVM to predict the nature of the soil and the best crops that can be grown there. When compared to all other methodologies, the projected model built of LSTM, SVM, and Tabu produces a decent outcome. The comparative results for various number of folds and various number of training and testing set graphs are given below. The comparative results are compared for various data of training set (10-90), (20-80), (50-50), (60-40), (70-30), and (80-20). And by increasing the number of folds various comparisons of algorithms, Figure 13 is an outcome of comparison of various algorithms based on training set data. Figure 14 is a comparison of various algorithms based on no. of folds.
3. Conclusion
To identify the nature of ground water level and predict a novel recommendation system that uses support vector machines to recommend the appropriate crop and Tabu search optimization to increase crop prediction, LSTM neural networks are used. Based on the LSTM, SVM, and TSO concepts and predictions stated above, we analyze which are suited for the land for the associated climate. The method makes use of climate data from Thanjavur, India’s soil data. The system selects the optimal crop for a particular set of input and climate conditions based on real-time input of location-specific soil attributes. The models are ensembled with various ML algorithms out of which SVM gives the good and accurate result. The model’s accuracy was assessed using LSTM, support vector machine, and Tabu search optimization. TSO with SVM has an 89 percent accuracy value.
Conflicts of Interest
The authors declare that there is no conflict of interest to publish this research article.
Open Research
Data Availability
The data used to support the findings of this study are included within the article.


