Computing the Entropy Measures for the Line Graphs of Some Chemical Networks
Abstract
Chemical Graph entropy plays a significant role to measure the complexity of chemical structures. It has explicit chemical uses in chemistry, biology, and information sciences. A molecular structure of a compound consists of many atoms. Especially, the hydrocarbons is a chemical compound that consists of carbon and hydrogen atoms. In this article, we discussed the concept of subdivision of chemical graphs and their corresponding line chemical graphs. More preciously, we discuss the properties of chemical graph entropies and then constructed the chemical structures namely triangular benzenoid, hexagonal parallelogram, and zigzag edge coronoid fused with starphene. Also, we estimated the degree-based entropies with the help of line graphs of the subdivision of above mentioned chemical graphs.
1. Introduction
1.1. Randić Entropy [43, 44]
1.2. Atom Bond Connectivity Entropy [45]
1.3. The Geometric Arithmetic Entropy [43, 44]
1.4. The Fourth Atom Bond Connectivity Entropy [35]
1.5. The Fifth Geometric Arithmetic Entropy [35]
See [35, 44] for further information on these entropy measures.
2. Formation of Triangular Benzenoid
Triangular benzenoids are a group of benzenoid molecular graphs and are denoted by Tx, where x characterizes the number of hexagons at the bottom of the graph and 1/2x(x + 1) represents the total number of hexagons in Tx. Triangular benzenoids are a generalization of the benzene molecule C6H6, with benzene rings forming a triangular shape. In physics, chemistry, and nanosciences, the benzene molecule is a common molecule. Synthesizing aromatic chemicals is quite fruitful [46]. Raut [47] calculated some toplogical indices for the triangular benzenoid system. Hussain et al. [48] discussed the irregularity determinants of some benzenoid systems. Kwun [49] calculated degree-based indices by using M polynomials. For further details, see [50, 51]. The hexagons are placed in rows, with each row increasing by one hexagon. For T1, there are only one type of edges e1 = (2,2) and |e1| = 6. Therefore, V(T1) = 6 and E(T1) = 6 while three kinds of edges are there in T2 e.g. e1 = (2,2), e2 = (2,3), e3 = (3,3) and |e1| = 6, |e2| = 6, |e3| = 3. Therefore, V(T − 2) = 13 and E(T2) = 15. Continuing in this way, |V(Tx)| = x2 + 4x + 1 and |E(Tx)| = 3/2x(x + 3). The subdivision graph of Tx and its line graph are demonstrated in Figure 1. It is to be noted that |V(L(S(Tx)))| = 3x(x + 3) and |E(L(S(Tx)))| = 3/2(3x2 + 7x − 2).
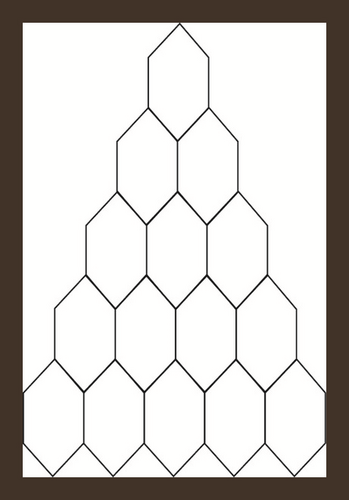
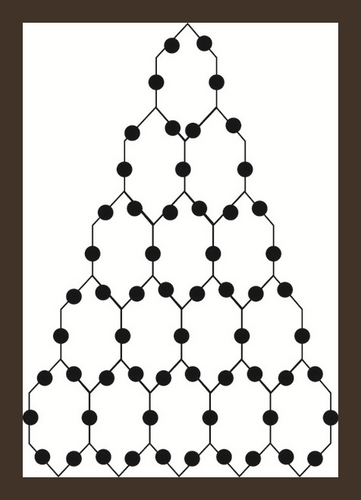
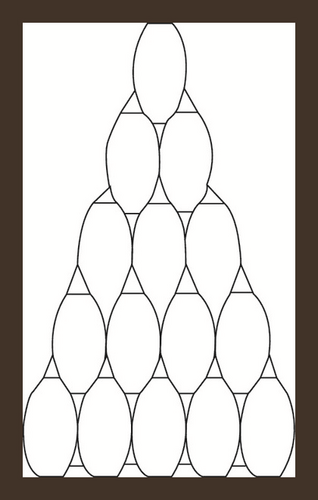
Let . i-e. is the line graph of the subdivision graph of triangular benzenoid Tx. We will use the edge partition and vertices counting technique to compute our abstracted indices and entropies. The degree of each edge’s terminal vertices is used in the edge partitioning of . It is easy to see that there are only three types of edges shown in Table 1.
| Ni | Set of Edges | |
|---|---|---|
| (2,2) | 2(x + 3) | E1 |
| (2,3) | 6(x − 1) | E2 |
| (3,3) | 3/2(3x2 + x − 4) | E3 |
2.1. Entropy Measure for L(S(Tx))
We’ll calculate the entropies of in this section.
2.1.1. Randi Entropy of L(S(Tx))
2.1.2. The ABC Entropy of L(S(Tx))
2.1.3. The Geometric Arithmetic Entropy of L(S(Tx))
2.1.4. The ABC4 Entropy of L(S(Tx))
The edge partition of the graph L(S(Tx)) is grounded on the degree addition of terminal vertices of every edge, as shown in Table 2.
| (Al, Am) | Ni | Set of Edges |
|---|---|---|
| (4, 4) | 9 | |
| (4, 5) | 6 | |
| (5, 5) | 3(x − 2) | |
| (5, 8) | 6(y − 1) | |
| (8, 8) | 3(x − 1) | |
| (8, 9) | 6(x − 1) | |
| (9, 9) | 3/2(3x2 + 2 − 5x) |
If we consider x = 1, Then , and .
2.1.5. The GA5 Entropy of L(S(Tx))
3. Formation of Hexagonal Parallelogram Nanotubes H(x, y),
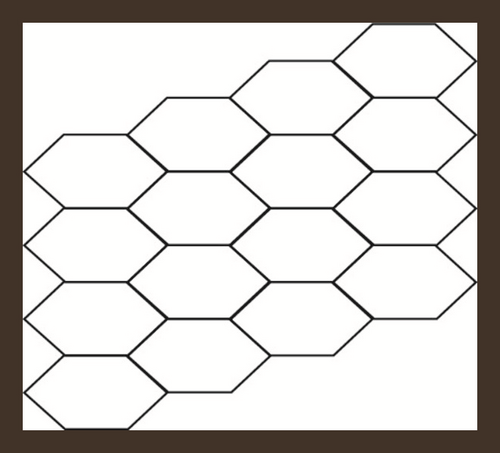
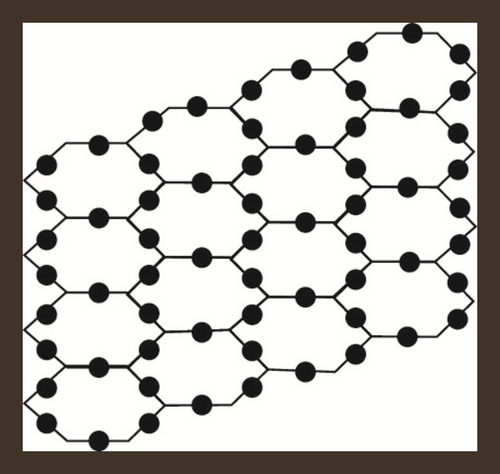
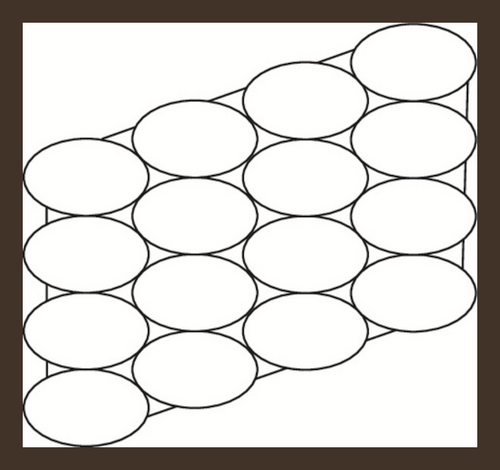
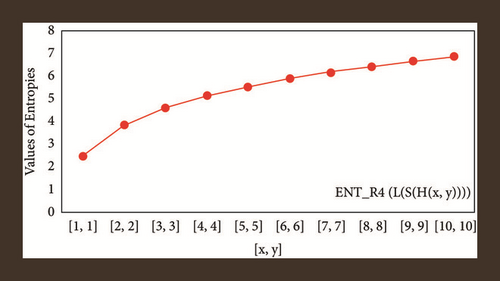
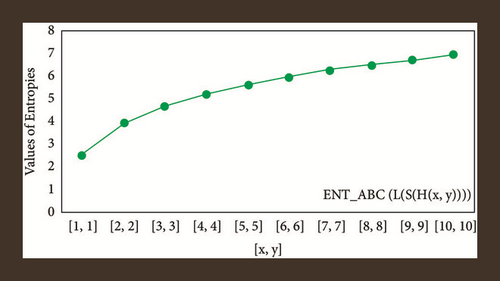
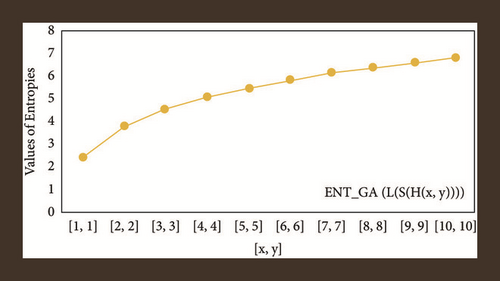
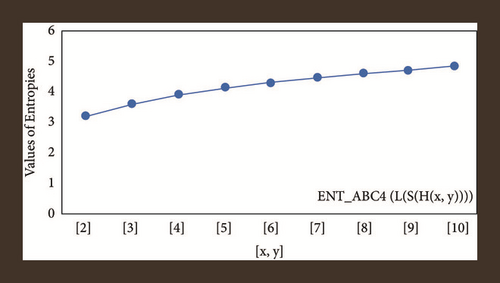
Hexagonal parallelogram nanotubes are formed by arranging hexagons in a parallelogram fashion. Baig et al. [52] computed counting polynomials of benzoid carbon nanotubes. Also, see [53]. We will denote this structure by , in which x and y represent the quantity of hexagons in any row and column respectively. Also, the order and size of H(x, y) is 2(x + y + xy) and 3xy + 2x + 2y − 1 respectively. The subdivision graph of H(x, y) and its line graph is shown in Figure 2, see [46]. Let , then and . To compute our results, we will use edge partition technique which is grounded on the degree of terminal vertices of every edge. It is to be noted that there are only three types of edges, see Figure 2. The edge partition of chemical graph L(S(H(x, y))) depending on the degree of terminal vertices is presented in Table 3.
| Ni | Kinds of Edges | |
|---|---|---|
| (2, 2) | 2(4 + y + x) | |
| (2, 3) | 4(−2 + y + x) | |
| (3, 3) | 9xy − 2m − 2n − 5 |
3.1. Entropy Measure for L(S(H(x, y)))
We will enumerate the entropies of in this section.
3.1.1. Randić Entropy of
3.1.2. The ABC Entropy of
3.1.3. The Geometric Arithmetic Entropy of
3.1.4. The ABC4 Entropy of
Case 1. when x > 1, y ≠ 1
The edge partition of L(S(H(x, y))) is shown in Table 4.
Therefore, the ABC4 index and entropy measure with the help of Table 4 and equation (9) yield as:
Since has seven kinds of edges, So (9) by using Table 4 is converted in the form:
| (Al, Am) | Ni | Kinds of edges |
|---|---|---|
| (4, 4) | 8 | |
| (4, 5) | 8 | |
| (5, 5) | 2(−4 + y + x) | |
| (5, 8) | 4(−2 + y + x) | |
| (8, 8) | 2(−2 + x + y) | |
| (8, 9) | 2(−2 + x + y) | |
| (9, 9) | 9xy − 8x − 8y + 7 |
Case 2. when x = 1, y ≠ 1
By using the same process, we get the closed expressions for the ABC4 index and ABC4 entropy as:
3.1.5. The Fifth Geometric Arithmetic Entropy of
Case 3. when x > 1, y ≠ 1The fifth geometric arithmetic entropy can be estimated by using (11), and Table 4 in the following manner:
So the (11), with Table 4 can be written as:
Case 4. when x = 1, y ≠ 1By using Table 5 and using (11) we get the closed expressions for the GA5 index and GA5 entropy as:
| (Al, Am) | Ni | Kinds of edges |
|---|---|---|
| (4, 4) | 10 | |
| (4, 5) | 4 | |
| (5, 5) | 2(y − 2) | |
| (5, 8) | 4(y − 1) | |
| (8, 8) | 2(y − 1) | |
| (8, 9) | 2(y − 1) | |
| (9, 9) | y − 1 |
4. Formation from Fusion of Zigzag-Edge Coronoid with Starphene ZCS(x, y, z) Nanotubes
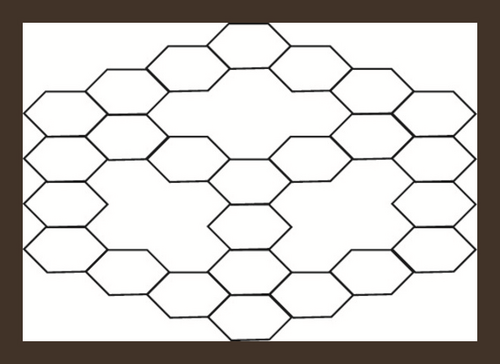
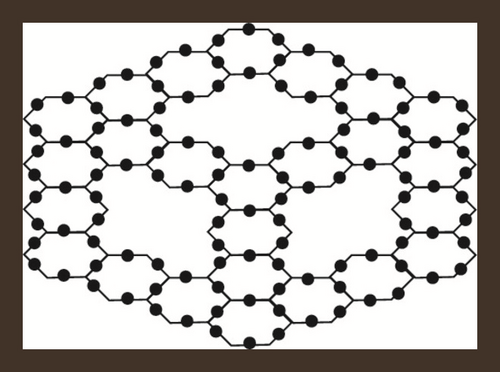
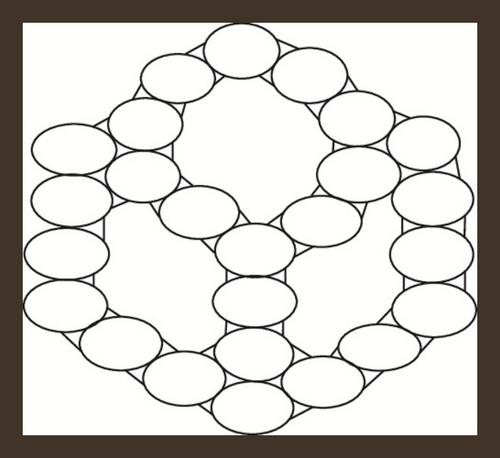
If a zigzag-edge coronoid ZC(x, y, z) is fused with a starphene St(x, y, z), then we will obtain a composite benzenoid. It is to b noted that |V(ZCS(x, y, z))| = 36x − 54 and |E(ZCS(x, y, z))| = −63 + 15(z + y + x). The subdivision graph of ZCS(x, y, z) and its line graph are illustrated in Figure 3. We can see from figures that the order and the size in the line graph of the subdivision graph of ZCS(x, y, z) are −126 + 30(z + y + x) and −153 + 39(z + y + x) respectively [46]. Let represents the subdivision graph of ZCS(x, y, z)’s line graph. The edge division is determined by the degree of each edge’s terminal vertices. Table 6 illustrates this.
| Ni | Kinds of Edges | |
|---|---|---|
| (2,2) | 6(−5 + z + y + x) | |
| (2,3) | 12(−7 + z + y + x) | |
| (3,3) | −39 + 21(z + y + x) |
4.1. Entropy Measure for L(S(ZCS(x, y, z)))
We’ll calculate the entropies of in this section.
4.1.1. Randi Entropy of
4.1.2. The ABC Entropy of
4.1.3. The Geometric Arithmetic Entropy of
4.1.4. The ABC4 entropy of
Table 7 shows the graph L(S(ZCS(x, y, z)))’s edge partition, which is based on the degree addition of each edge’s terminal vertices.
| (Al, Am) | Ni | Kinds of Edges |
|---|---|---|
| (4, 4) | 6 | |
| (4, 5) | 12 | |
| (5, 5) | 6(x + y + z − 8) | |
| (5, 8) | 12(x + y + z − 7) | |
| (8, 8) | 6(x + y + z − 9) | |
| (8, 9) | 12(x + y + z − 5) | |
| (9, 9) | 3(x + y + z + 25) |
4.1.5. The GA5 Entropy of
5. Concluding remarks for Computed Results
The applications of information-theoretic framework in many disciplines of study, such as biology, physics, engineering, and social sciences, have grown exponentially in the recent two decades. This phenomenal increase has been particularly impressive in the fields of soft computing, molecular biology, and information technology. As a result, the scientists may find our numerical and graphical results useful [54, 55]. The entropy function is monotonic, which means that as the size of a chemical structure increases, so does the entropy measure, and as the entropy of a system increases, so does the uncertainty regarding its reaction.
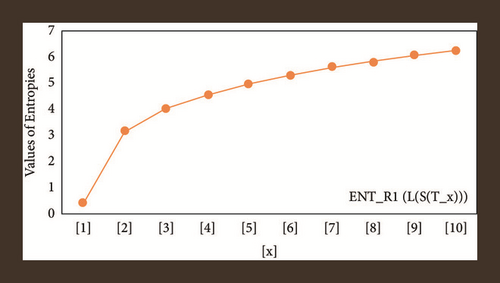
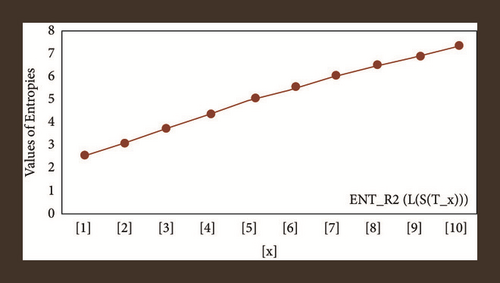
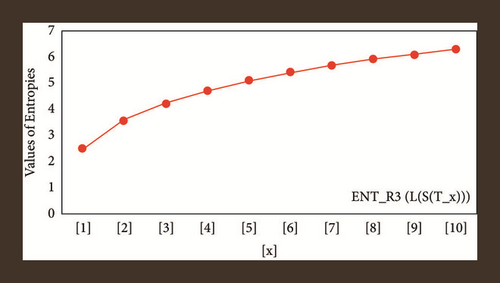
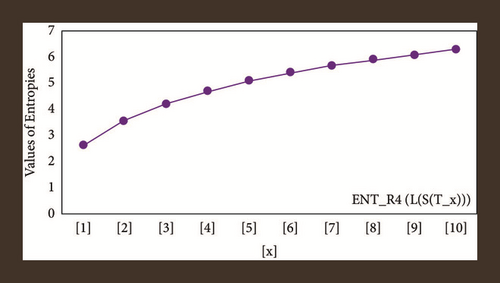
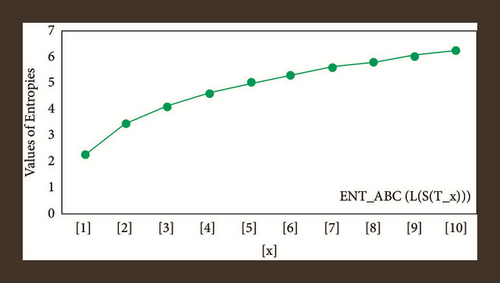
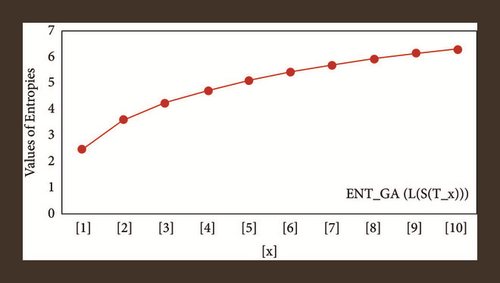
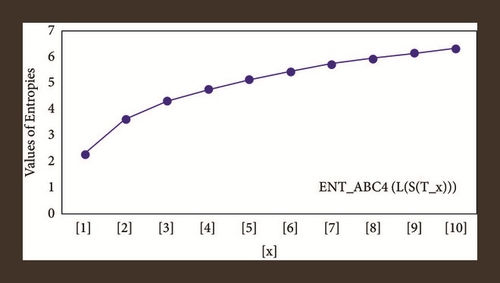
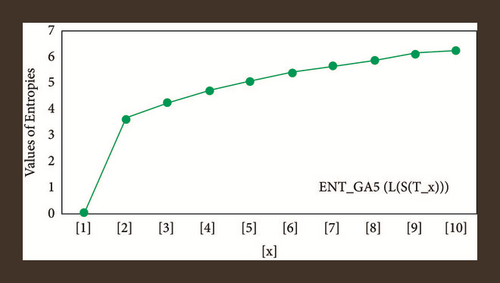
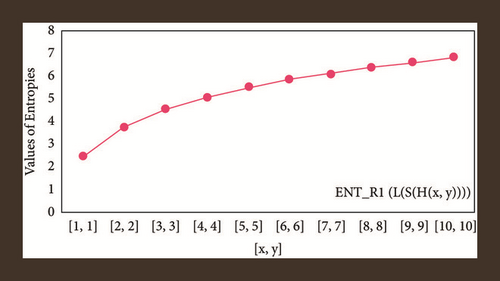
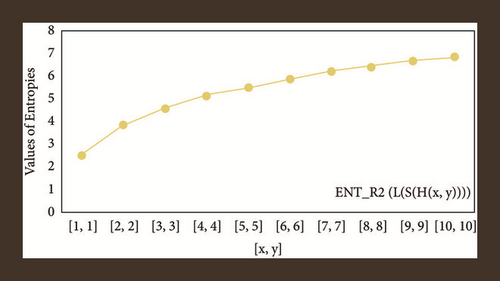
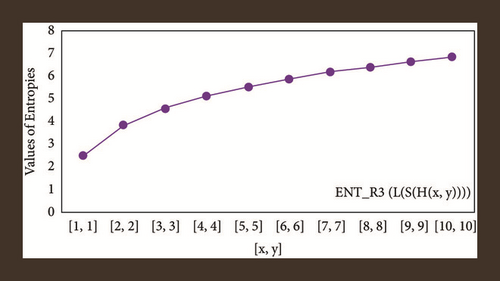
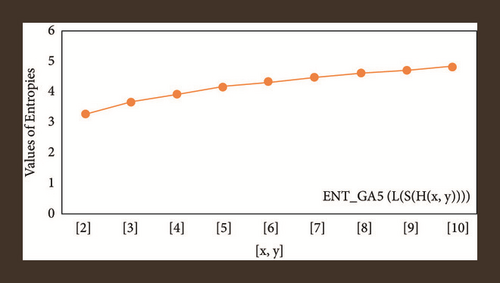
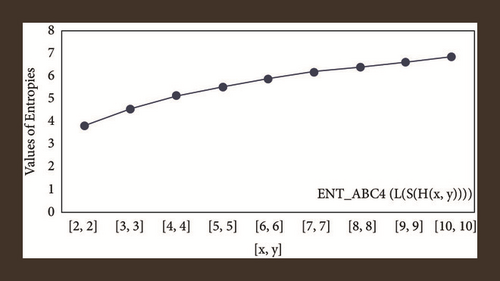
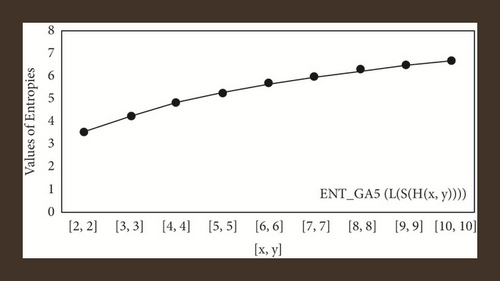
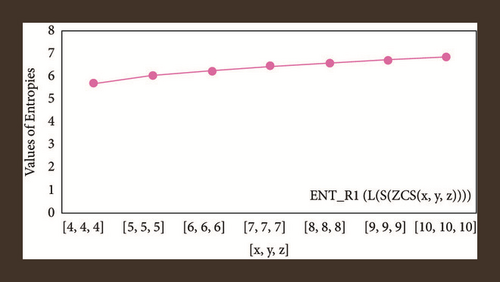
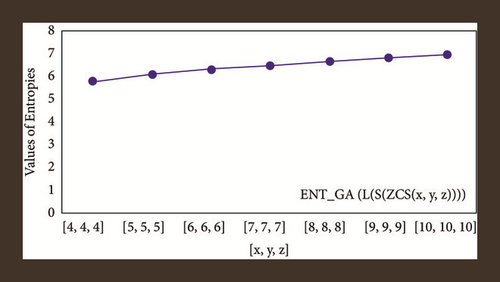
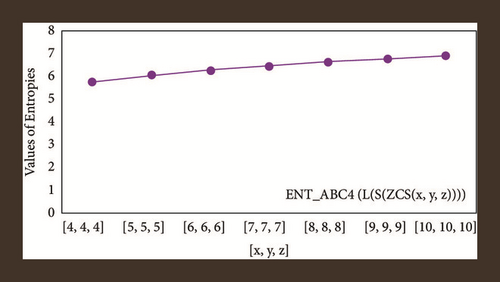
For L(S(Tx)), the numerical and graphical results are shown in Tables 8 and 9 and Figures 4–7. In Table 9, the fifth arithmetic geometric entropy is zero which shows that the process is deterministic for x = 1. When the chemical structure L(S(Tx)) expands, the Randi entropy for α = 1/2 develops more quickly than other entropy measurements of L(S(Tx)), whereas the Randi entropy for α = −1/2 develops more slowly. This demonstrates that different topologies have varied entropy characteristics. For L(S(H(x, y))), the numerical and graphical results are shown in Tables 10–13 and Figures 8–12. When the chemical structure L(S(H(x, y))) expands, the geometric arithmetic entropy develops more quickly than other entropy measurements of L(S(H(x, y))), whereas the ABC4 entropy develops more slowly. Finally, for L(S(ZCS(x, y, z))), the numerical and graphical results are shown in Table 14 and Figures 13–16. When the chemical structure L(S(ZCS(x, y, z))) expands, the geometric arithmetic entropy develops more quickly than other entropy measurements of L(S(ZCS(x, y, z))), whereas the Randi entropy for α = −1 develops more slowly.
| [x] | ||||
|---|---|---|---|---|
| [46] | 0.4055 | 2.5590 | 2.4849 | 2.6263 |
| [52] | 3.1863 | 3.0463 | 3.5667 | 3.5970 |
| [25] | 4.0316 | 3.6767 | 4.2203 | 4.2280 |
| [26] | 4.5797 | 4.2928 | 4.6981 | 4.6991 |
| [24] | 4.9945 | 4.8714 | 5.0779 | 5.0764 |
| [23] | 5.3312 | 5.4107 | 5.3942 | 5.3918 |
| [27] | 5.6159 | 5.9131 | 5.6658 | 5.6631 |
| [2] | 5.8632 | 6.3820 | 5.9041 | 5.9013 |
| [56] | 6.0820 | 6.8208 | 6.1164 | 6.1136 |
| [31] | 6.2785 | 7.2325 | 6.3080 | 6.3053 |
| [x] | ENTABC | ENTGA | ||
|---|---|---|---|---|
| [46] | 2.3116 | 2.4849 | 2.1972 | 0 |
| [52] | 3.5239 | 3.5835 | 3.5749 | 3.5835 |
| [25] | 4.2025 | 4.2341 | 4.2263 | 4.2341 |
| [26] | 4.6897 | 4.7095 | 4.7028 | 4.7095 |
| [24] | 5.0739 | 5.0876 | 5.0817 | 5.0876 |
| [23] | 5.3926 | 5.4027 | 5.3975 | 5.4026 |
| [27] | 5.6655 | 5.6733 | 5.6687 | 5.6733 |
| [2] | 5.9046 | 5.91087 | 5.9066 | 5.9108 |
| [56] | 6.1174 | 6.1225 | 6.1187 | 6.1225 |
| [31] | 6.3093 | 6.3135 | 6.3100 | 6.3135 |
| [x, y] | ||||
|---|---|---|---|---|
| [1,1] | 2.4849 | 2.4849 | 2.4849 | 2.4849 |
| [2,2] | 3.7917 | 3.7830 | 3.8344 | 3.8332 |
| [3,3] | 4.5635 | 4.5428 | 4.5933 | 4.5906 |
| [4,4] | 5.1096 | 5.0872 | 5.1323 | 5.1294 |
| [5,5] | 5.5345 | 5.5129 | 5.5530 | 5.5502 |
| [6,6] | 5.8833 | 5.8630 | 5.8988 | 5.8962 |
| [7,7] | 6.1794 | 6.1615 | 6.1928 | 6.1904 |
| [8,8] | 6.4368 | 6.4194 | 6.4486 | 6.4464 |
| [9,9] | 6.6646 | 6.6483 | 6.6751 | 6.6731 |
| [10,10] | 6.8688 | 6.5370 | 6.8783 | 6.8822 |
| [x, y] | ENTABC | ENTGA |
|---|---|---|
| [1,1] | 2.4849 | 2.4849 |
| [2,2] | 3.8497 | 3.8501 |
| [3,3] | 4.6048 | 4.6051 |
| [4,4] | 5.1413 | 5.1416 |
| [5,5] | 5.5604 | 5.5607 |
| [6,6] | 5.9051 | 5.9053 |
| [7,7] | 6.1982 | 6.1985 |
| [8,8] | 6.4534 | 6.4536 |
| [9,9] | 6.6794 | 6.6796 |
| [10,10] | 6.8822 | 6.8824 |
| [x, y] | ||
|---|---|---|
| [2,2] | 3.7879 | 3.4822 |
| [3,3] | 4.5387 | 2.2596 |
| [4,4] | 5.0783 | 4.8387 |
| [5,5] | 5.5018 | 5.2952 |
| [6,6] | 5.8509 | 5.6704 |
| [7,7] | 6.1481 | 5.9882 |
| [8,8] | 6.4068 | 6.2636 |
| [9,9] | 6.6360 | 6.5064 |
| [10,10] | 6.8417 | 6.7234 |
| [x, y, z] | ||||
|---|---|---|---|---|
| [4,4,4] | 5.7200 | 5.70060 | 5.7432 | 5.7407 |
| [5,5,5] | 6.0342 | 6.0165 | 6.0587 | 6.0565 |
| [6,6,6] | 6.2730 | 6.2564 | 6.2982 | 6.2961 |
| [7,7,7] | 6.4657 | 6.4497 | 6.4913 | 6.4893 |
| [8,8,8] | 6.6272 | 6.6117 | 6.6531 | 6.6511 |
| [9,9,9] | 6.7662 | 6.7511 | 6.7923 | 6.7904 |
| [10,10,10] | 6.8883 | 6.8734 | 6.9145 | 6.9126 |
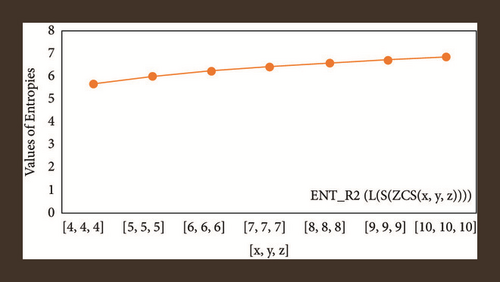
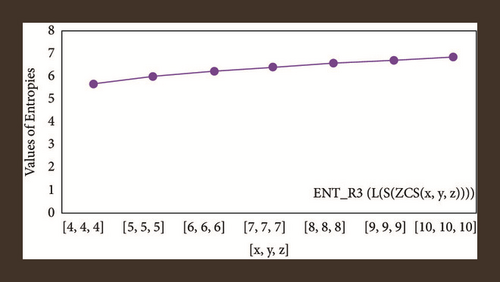
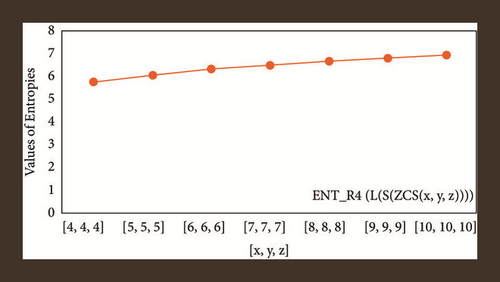
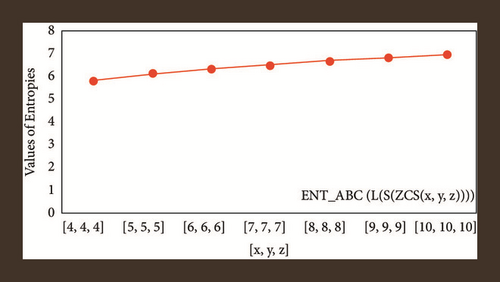

The novelty of this article is that entropies are computed for three types of benzenoid systems. These entropy measures are useful in estimating the heat of formation and many Physico-chemical properties. In statistical analysis of benzene structures, entropy measures showed more significant results as compared to topological indices. Therefore, we can say that the entropy measure is a newly introduced topological descriptor.
6. Conclusion
Using Shanon’s entropy and Chen et al. [31] entropy definitions, we generated graph entropies associated to a new information function in this research. Between indices and information entropies, a relationship is created. Using the line graph of the subdivision of these graphs, we estimated the entropies for triangular benzenoids Tx, hexagonal parallelogram H(x, y) nanotubes, and ZCS(x, y, z). Thermodynamic entropy of enzyme-substrate complexions [57, 58] and configuration entropy of glass-forming liquids [56] are two examples of thermodynamic entropy employed in molecular dynamics studies of complex chemical systems. Similarly, using information entropy as a crucial structural criterion could be a new step in this direction.
Conflicts of Interest
The authors declare that they have no conflicts of interest.
Authors’ Contributions
This work was equally contributed by all writers.
Open Research
Data Availability
The data used to support the findings of this study are cited at relevant places within the text as references.


