Experimental and Numerical Study of the Drying Process of a Consolidated Clay Soil
Abstract
The clay soil is composed of solid skeleton and porous and can be studied in the framework of porous media. During the drying process, the initial saturated clay soil deforms mainly due to the changes of water content and capillary pressure. With the further increase in capillary pressure, the soil cracks. In fact, the deformation and the stress in clay soil are tightly related with the water content and capillary pressure. Therefore, it is of great interest to understand the changes in capillary pressure and water content within the clay soil during the drying process. However, it is difficult to obtain these field variables by experiments alone. Therefore, the numerical simulation could be good choice for deeper understanding of the dry process in clay soil. In current research, the combined numerical simulation and laboratory experiments research are conducted; the numerical results are compared with the laboratory observation. This research is the basis for the further study of the cracking process of clay soil due to drying.
1. Introduction
In the practice of soil mechanics engineering, desiccation is commonly understood as drainage (loss of water) by evaporation referring either to a preconsolidation mechanism, or to an air invasion mechanism [1]. Desiccation affects both surface and subsurface soils [2]. In engineering practice, clay soil is the most sensitive to changes in water content among the types of soils that are often encountered; clay soil becomes hard and fragile after drying due to its fine particle size and high-water content [3]. Clay soils tend to crack during desiccation [4–7]. The cracks created during desiccation may affect soil properties such as strength, permeability, and compression ability, which in practice can compromise the sustainability of geotechnical structures by, for instance, inducing severe impact on the performance of embankments [8], mudflow [9], or foundation stability [10]. Owing to the significant concern of this question, the mechanism of desiccation cracking of clay soils has gained the attraction of many researchers during the last decades, in both experimental investigations and numerical modeling [11–14].
Some researchers [7, 15, 16] obtain cracks by applying external restrictions on the shrinkage of the clay during the drying process, such as the base plate; the cracking results obtained by this method are obvious. Different from this method, this article analyzes the internal reasons of the clay itself during the drying process to obtain the cracking mechanism. The clay soil is composed of solid skeleton and porous and can be studied in the framework of porous media [17]. During the drying process, the initial saturated clay soil deforms mainly due to the changes of water content and capillary pressure [18]. With the further increase in capillary pressure, the soil cracks [19]. In fact, the deformation and the stress in clay soil are tightly related with the water content and capillary pressure [20]. Therefore, it is of great interest to understand the changes in capillary pressure and water content within the clay soil during the drying process. However, it is difficult to obtain these field variables by experiments alone. Therefore, the numerical simulation could be good choice for deeper understanding of the dry process in clay soil. In current research, the combined numerical simulation and laboratory experiments research are conducted for investigating the drying process of a remolded clay soil composed of kaolin.
The current article is organized as follows: firstly, the laboratory experiment research on the drying test of an initial saturated consolidated remolded clay soil is presented. The experimental results, such as the humidity, temperature in the drying container, and the weight of the specimen, are analyzed. Then, according to the laboratory experiment, the numerical model is created, and the model parameters are characterized according to the experimental results. Finally, the numerical results are compared with the laboratory observation.
2. Material and Methods
2.1. The Specimen Preparation
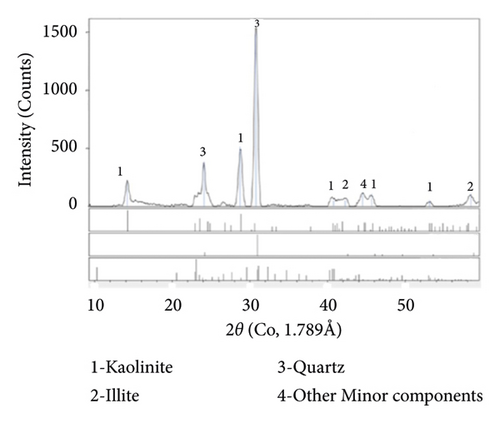
The specimen to introduce in the desiccation device for the drying test is made from a consolidated clay named kaolin K13 mainly composed of the kaolinite. X-ray diffraction analysis performed on the soil shows a large proportion of alumina silicate hydrate (kaolinite) and some illite and quartz grains (Figure 1). The particle size of kaolin clay is less than 80 μm; the main physical properties of kaolin clay are given in Table 1.
| Material | Liquid limit (%) | Plastic limit (%) | Plastic index IP (%) | Specific gravity Gs |
|---|---|---|---|---|
| Kaolin | 42 | 21 | 21 | 2.63 |
Firstly, dry kaolin K13 powder was mixed with deaerated water till the obtained slurry reached a water content of 1.5 times the liquid limit (w = 1.5wL). The slurry was mechanically stirred with a velocity of 280 revolutions per minute for 15 minutes and then reserved in a recipient carefully sealed by film paper and aluminum foil for 24 hours rest in control temperature room. This method allows to ensure a homogeneous mixture. Afterwards, the slurry was poured into the consolidometer full of water for a one-dimensional compression. The consolidometer is in rigid PVC and in cylindrical form with the diameter of 95 mm, as shown in Figure 2, and the clay core is continuously saturated. For ensuring good drainage during the consolidation, the compression load increases step by step. The final designed axial stress was σv0 = 120 kPa, the value of 120 kPa is not immutable, there are also researchers who take 100 kPa as the final design compressive stress, and 120 kPa can be used as an experience value. Finally, the material fully saturated continued to consolidate under σ′v0 for at least 3 weeks.
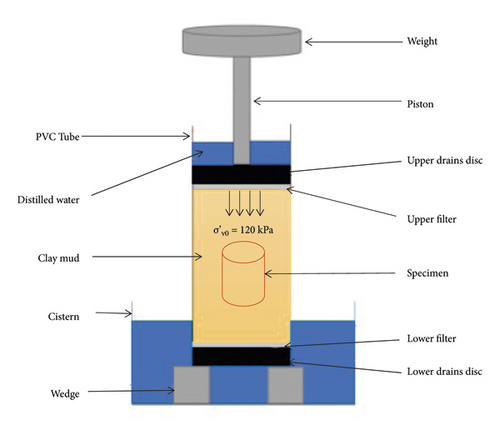
The specimens for drying tests were cut from the obtained consolidated clay core. They are in cylindrical form with 75 mm height and 50 mm diameter. Two specimens labelled A and B are presented in this paper; Table 2 presents the initial state parameters.
| Specimen name | Initial wet mass m0 (g) | Initial water content w0 (%) | Initial porosity ϕ0 (%) |
|---|---|---|---|
| A | 269.46 | 36.69 | 49.10 |
| B | 280.50 | 36.50 | 48.98 |
2.2. Desiccator Devise
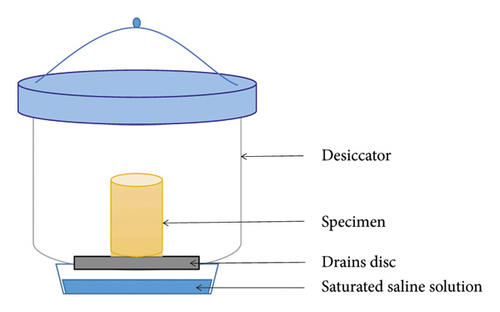
The specimens were placed in the sealed desiccators (Figure 3), on the top of the container, while the lower part of the container is of saturated saline solution. Two different saturated saline solutions were used to control the humidity in the sealed container. For specimen A, the relative humidity is controlled by saturated Na2SO4 solution corresponding to 13 MPa of suction; the specimen B is placed under the relative humidity controlled by saturated NaCl solution corresponding to 38 MPa of suction. The two contains were placed in a constant ambiance environment with temperature of 20°C. Initial before desiccation, the specimens were in fully saturated state. The principle of the technique to impose matric suction to the material is as follows: the water transfer from the soil to the external environment of the desiccator is absorbed by the saline solution. During the experiments, the mass of each specimen was measured at different desiccation times, and the water content was then calculated at each step.
3. Desiccation Process in Wet Soil
During the drying process, the initial saturated clay deforms due to the suction imposed by the relative humidity of the desiccator environment as consequence of the saline solution. Due to low permeability of the consolidated specimen, the desaturation process is relatively slow. As consequence, high-water pressure gradient is generated in the material with a significant heterogeneous stress distribution in the specimen. The nonuniform distribution of moisture will induce a differential shrinkage leading to tensile stresses development, which represents one of the main reasons for the initiation of cracks inside the clay.
In these applications, the variation of gas pressure is generally very small with respect to that of liquid pressure. For the reason of simplification, we assume that the gas mixture pressure is constant with the same value of the atmosphere pressure, as Pgm = Patm = 0.1MPa. Therefore, the capillary pressure is directly depending on the pore water pressure in soil.
Applying the Darcy’s law into the equation of mass conservation, the generalized diffusion equations for unsaturated porous media can be obtained. By applying the variational method to the field equations and using the implicit time stepping, a set of nonlinear equations is established. The nonlinearity must be solved, principally related to the nonlinear poroelastic diffusion. An iterative procedure is then needed for each time step.
4. Modeling by Finite Elements Method and Results
4.1. The Model
Owing to the symmetry of the problem to be solved, only quarter of the cylindrical specimen is considered and meshed. The boundary conditions in the desaturation phase are illustrated in Figure 4. AB and AD are the two impermeable boundaries. The horizontal displacement is blocked on AD and on AB the vertical displacement is blocked. The capillary pressure corresponding to the applied relative humidity is imposed on the boundary exterior BC and CD. The value of the applied suction which as a function of time can be changed arbitrarily over time in the simulation. However, it was shown that the value of the applied suction increases with time during the drying test, and it is assumed that the applied suction varies linearly with time to simplify the process in the simulation. The finite elements mesh is shown in Figure 4; there are totally 49 elements in the length direction, while in the vertical direction, there are 76 elements. The 4-node element is used. The moisture of the sample diffuses from the surface into the air during the drying process; the exchange of the moisture of the sample occurs frequently on the surface. The water content of the surface decreases rapidly; in comparison, the water content of the inside of the sample decreased relatively gently. In order to better study the variation of water content in the sample, the division of elements which is near the surface of the sample model becomes dense, while the division of elements which is inside the sample is loose in this recherche.
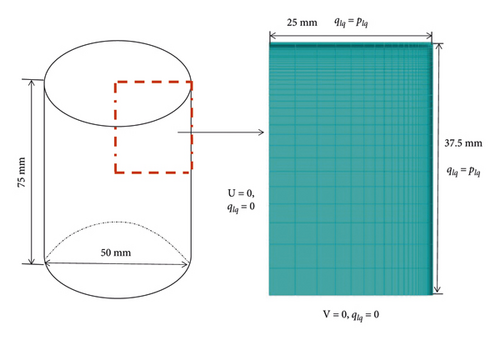
The principal parameters used for the simulation are listed in Table 3. α, N, and M are the van Genuchten equation parameters obtained by fitting experimental data [23–25] shown in Figure 5. The water saturation of kaolin is related to the applied capillary pressure by water retention curve. M can be used to calculate the relative permeability of the specimens. K is the initial permeability related to the nature of the solid skeleton taken from Hammad’s paper [26]. As the kaolin specimens A and B are both consolidated at 120 kPa, α, N, M, and K parameters should be approximately the same.
| Model parameters | Values |
|---|---|
| Gs | 2.63 |
| ϕ0 | 49.10% or 48.98% |
| Α | 1 × 10⁶ Pa |
| N | 2.15 |
| M | 0.535 |
| K | 1 × 10⁻¹⁰ m/s |
| ρlq | 1000 kg/m3 |
| μlq | 0.001 Pa × s |
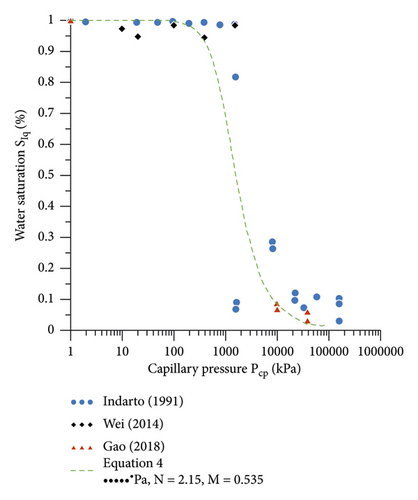
The specific gravity Gs and the initial porosity ϕ0 have been introduced as well as the volumetric mass of liquid, ρlq, and the viscosity of liquid, µlq, which are useful in the simulation process. The latter can be found in the literature [17].
4.2. Results and Discussion
Figure 6 shows the water content changes with time, the specimens being under suction 13 MPa and 38 MPa. Obviously, the greater suction leads to faster rate of water loss, and the residual water content of the samples under the greater suction is also lower than that of under low suction. During the drying process of the samples, the applied suction along the sample surface does not reach the target value immediately, it needs a process. Under the suction 38 MPa, the curve shows inflection point at 65 days and then the water loss rate changes. After 200 days drying, the curve exhibits a plateau indicating that the matrix suction reached 38 MPa. Regarding the numerical simulation on the first 65 days, the boundary condition in applying suction is increased from 0 to 38 MPa. After 65 days, the boundary condition in applying suction is continuously 38 MPa. Under the imposed suction of 13 MPa, the inflection point is reached at 120 days, and the same method is applied for numerical simulation.
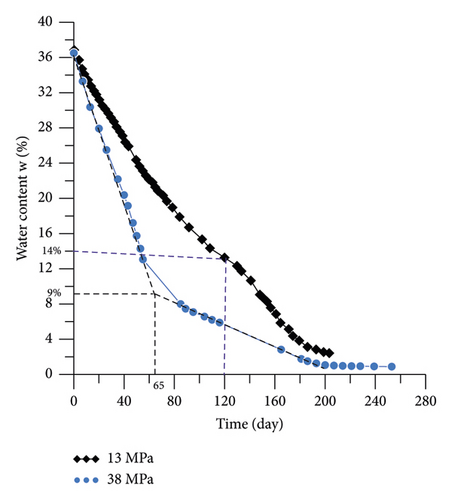
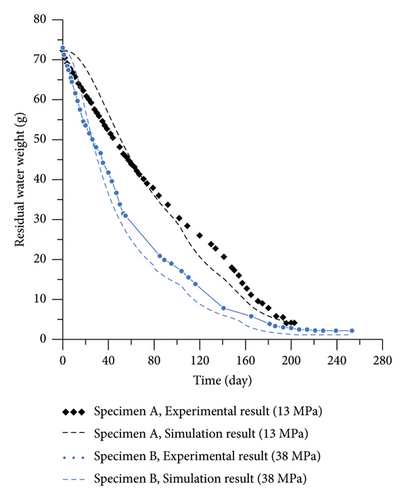
Figure 7 shows the results of residual water weight variation as function of drying time, obtained by the calculation and experimental tests during drying of the consolidated clay. Notice that the calculations consider the previous boundary conditions for applying suction. Since the symmetry of the sample is considered in the simulation (Figure 4), the simulation results of residual water weight is half of the actual sample. To compare simulations with experimental results, it is necessary to multiply the simulation result by two times; one can observe that the results are consistent with the experimental data.
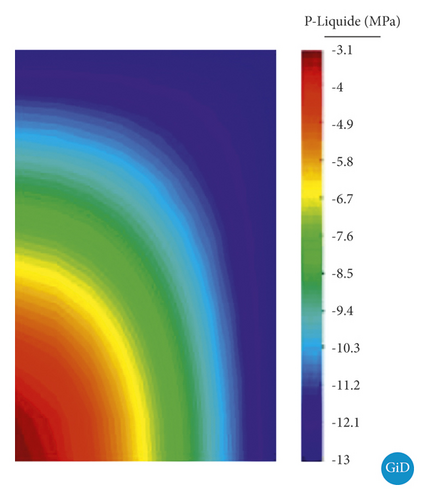
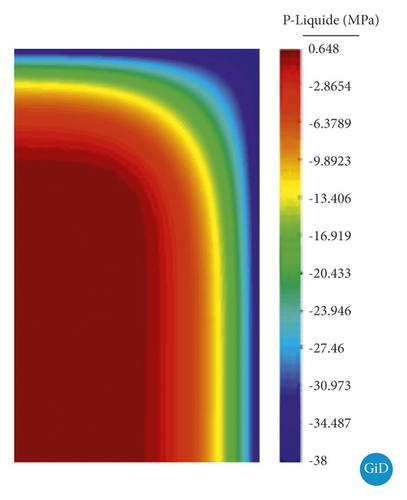
The software GID has been developed by the International Center for Numerical Methods in Engineering. It was used for postprocessing and permit to obtain the capillary pressure changes during the drying process within the consolidated clay sample.
As shown in Figure 8, the distribution of capillary pressure is within the samples when the surface of the two samples reaches a target capillary pressure. When the capillary pressure on the surface of the sample A reached 13 MPa, the maximum difference of capillary pressure between the inside and the outside is only 10 MPa. When the capillary pressure of the sample surface B reaches 38 MPa, the maximum difference of capillary pressure between inside and outside reaches 35 MPa. This explains why the greater the environmental suction makes easier the possibility for the clay to crack. In most areas of the sample A, the capillary pressure is close to 13 MPa, whereas in most areas of the sample B, the capillary pressure is far away from 38 MPa. The moisture loss of sample A is more uniform, and the surface of sample B is dry and the interior is still highly saturated. These results explain well why the initial water loss rate of the sample B is faster than the sample A; however, the drying time to reach the final water content (plateau) in the two samples is similar. This analysis may constitute the basis for further study of the cracking process due to drying in consolidated clay soils.
5. Conclusions
During the drying process, the deformation and the stress in clay soil tightly related with the water content and capillary pressure. Therefore, it is of great interest to understand the changes in capillary pressure and water content within the clay soil during the drying process. However, it is difficult to obtain these field variables by experiments alone. Therefore, the numerical simulation could be good choice for deeper understanding of the dry process in clay soil. The simulations of laboratory tests, performed on a remolded clay soil composed of kaolin, have shown a good agreement with experimental data. Through the combined numerical simulation and laboratory experiments, the changes in capillary pressure and water content within the consolidated clay soil during the drying process are obtained. This research is the basis for the further study of the cracking process of clay soil due to drying.
Conflicts of Interest
The authors declare that there are no conflicts of interest regarding the publication of this paper.
Acknowledgments
This research was funded by the Anhui University of Science and Technology through a research fund (Ref: 2021yjrc07) to the first author.
Open Research
Data Availability
The data used to support the findings of this study are available from the corresponding author upon request.


