Analysis of Tire-Pavement Contact Morphology Characteristics during the Virtual Track Train Maneuvering
Abstract
The tire-pavement contact morphology during the virtual track train maneuvering has an essential function in assessing vehicle performance and pavement damage. The longitudinal tread tire and viscoelastic asphalt pavement were developed based on the finite element method. Then, the tire-pavement contact model was developed according to the Euler–Lagrange algorithm and validated. Contact area and stress distribution under uniform, braking, and cornering conditions are explored with the dynamic tire force of the virtual track train as the external load. Also, the effect factors were analyzed. The results indicate that vertical stress distribution is symmetrical along the length and width directions, and contact area is rectangular under uniform condition. Vertical and longitudinal stresses have similar distributions under braking condition, with a wide front and a narrow back along the length direction. Under cornering condition, the closer to the inside of the cornering, the larger the contact area. Vertical stress is similar to the lateral stress distribution, and the larger stress value is concentrated on the inner side of each tread. Load, tire pressure, slip rate, and slip angle have significant effects on contact morphology, while velocity has little effect. Contact area increases with the increase of load and slip rate and decreases with the increase of tire pressure and slip angle. Vertical stress increases gradually with the increase of load. Higher tire pressure makes stress distribution more concentrated. The increase in slip rate increases vertical and longitudinal stresses and gradually moves in the running direction. Vertical and lateral stresses increase with the slip angle and are mainly distributed on the inside of the turn. This research can be used to evaluate and analyze the response and damage of the virtual track train to asphalt pavement under uniform, braking, and cornering conditions. It can be used as a reference for the design and paving of asphalt pavement.
1. Introduction
The interaction between the vehicle and pavement is transmitted through the tire. Therefore, the contact problem between tire and pavement not only affects vehicle performance but also affects pavement service time. Normally, based on the geometric and mechanical parameters of tire and pavement, researchers constructed the tire-pavement contact model to study contact characteristics during vehicle maneuverings, such as static, free-rolling, traction, braking, and cornering.
The tire-pavement contact model was developed to simulate contact stress distribution under static, free-rolling, acceleration, and braking. The results demonstrated that running conditions have a marked effect on contact stress [1]. A truck radial tire was used to analyze the tire-pavement contact stress distribution under static, free-rolling, braking, camber, and cornering by H. Zhou et al. It is found that running conditions have a direct effect on contact stress distribution [2]. Oubahdou et al. [3] studied the contact shape and stress distribution between tire and pavement. The tire-pavement contact model was built by Yu et al. to discuss contact stress distribution under static, steady-state rolling, and braking conditions [4]. According to the Lagrange method, the tire-pavement contact model was built to investigate contact characteristics under static and antilock system conditions. Contact stress increased by 8.4% and contact area decreased by 7.7% under antilock system condition [5]. M. Guo et al. [6] developed a bus tire-pavement contact model to analyze the vertical, longitudinal, and lateral contact stress distribution under uniform, acceleration, and braking conditions. The 11.00R20 radial heavy-duty tire-viscoelastic asphalt pavement contact model was constructed to simulate contact characteristics under static, dynamic, and braking conditions [7].
The contact relationship between tire and pavement is described through contact morphology characteristics [8–10]. Generally, methods for studying contact morphology mainly include experimental and analytical methods. The experimental method can truly reflect contact area and stress, but the operation process is complicated [11]. The analytical method (the finite element method) has been widely accepted because of its ease of operation [12]. Consequently, based on the finite element method, tire and pavement finite element models were built to analyze the geometric characteristics and three-dimensional stress distribution. Simultaneously, factors including tire types (radial, diagonal, wide base, and dual), tire characteristics (tread pattern, rubber material, and inflation pressure), vehicle running conditions (static, uniform, acceleration, braking, and cornering), vehicle loads (unload, full-load, and overload), pavement (type, material, and texture), and temperature were investigated [13–19].
In previous studies, tire load was considered static, and the dynamic tire load under the interaction of vehicle and road was less considered. Compared to the tire model, the pavement model was considered rigid, ignoring the viscoelasticity and laminarity of asphalt pavement. In addition, the virtual rail train (VTT), as a new mode of transportation, runs on asphalt pavement. Therefore, it is necessary to develop a tire-viscoelastic asphalt pavement contact model for VTT under dynamic tire load to explore contact morphology under different running conditions and then evaluate the vehicle performance and pavement damage.
The objective of this study is to analyze and compare the contact morphology between the tire and pavement under typical running conditions. The method of Euler–Lagrange was applied to develop the longitudinal tread tire-viscoelastic asphalt pavement contact model, and the stiffness was verified. Based on the dynamic tire force calculated by the virtual track train dynamics model, the contact area and stress distribution under uniform, braking, and cornering conditions were explored. The influence of load, tire pressure, velocity, slip rate, and slip angle on the contact morphology was also analyzed.
2. Tire-Pavement Contact Model
The structure and material of tire and pavement are all important factors that affect contact morphology.
2.1. Tire Finite Element Model
The tire specification used for VTT is 385-65-R22.5 radial tire. According to the Chinese standard [19], tire parameters are shown in Table 1. It is mainly composed of rubber and reinforcement in different directions. The rubber includes tread, sidewall, and bead. The reinforcement includes belt ply 0-degree, belt ply 1, belt ply 2, belt ply 3, bead wire, and ply.
| Tire parameter | Section width (mm) | Maximum overall diameter (mm) | Static load radius (mm) | Load capacity (kg) | Inflation pressure (kPa) |
|---|---|---|---|---|---|
| Values | 389 | 1091 | 494 | 4500 | 900 |
The linear elastic model was used to represent reinforcement, which was embedded in the corresponding rubber as a rebar element. Tire parameters were provided by Kasaike Tire Company, as illustrated in Table 2 and Table 3.
| Rubber | Yeoh model | ||
|---|---|---|---|
| C10(×105Pa) | C20(×104Pa) | C30(×104Pa) | |
| Tread | 7.7 | −6.71 | 9.55 |
| Sidewall | 9.35 | −1.90 | 18.4 |
| Bead | 9.26 | −8.60 | 8.29 |
| Rebar | Tensile modulus (MPa) | Poisson’s ratio | Cross-sectional area (mm2) | Spacing (mm) | Density (kg/m3) | Angle (∘) |
|---|---|---|---|---|---|---|
| Belt ply 0-degree | 19025 | 0.3 | 1.50 | 2.22 | 7800 | 90 |
| Belt ply 1 | 19025 | 0.3 | 2.06 | 2.08 | 7800 | 66 |
| Belt ply 2 | 19025 | 0.3 | 2.06 | 2.08 | 7800 | 105 |
| Belt ply 3 | 19025 | 0.3 | 1.02 | 2.50 | 7800 | 75 |
| Bead wire | 19025 | 0.3 | 1.50 | 1.65 | 7800 | 90 |
| Ply | 19025 | 0.3 | 2.06 | 2.08 | 7800 | 0 |
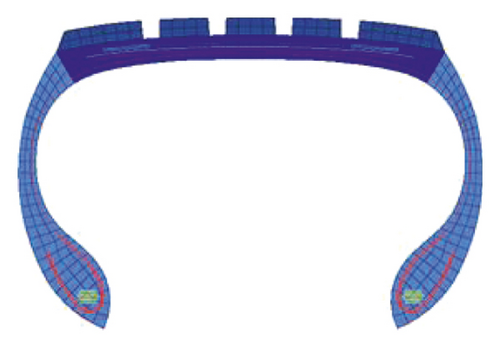
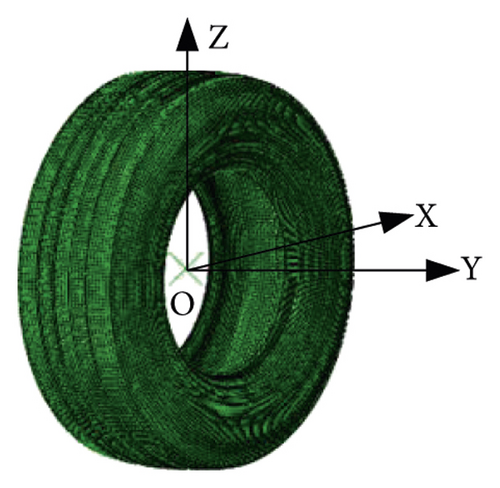
The 3D finite element model of the tire could be rotated from a 2D model due to its pronounced symmetry, as depicted in Figure 1. CGAX4H, CGAX3H, and SFMGAX1 element types were selected in the 2D model. In the 3D model, the corresponding transformations were C3D8H, C3D6H, and SFM3D4R. The number of elements in the 3D tire finite element model was 104828.
2.2. Asphalt Pavement Finite Element Model
Asphalt pavement is a typical semirigid base asphalt pavement. Its main structure includes the upper layer (modified SMA-13), middle layer (modified AC-20), lower layer (AC-25), base layer (cement-stabilized crushed stone), subgrade layer (lime soil), and soil layer, as illustrated in Figure 2.
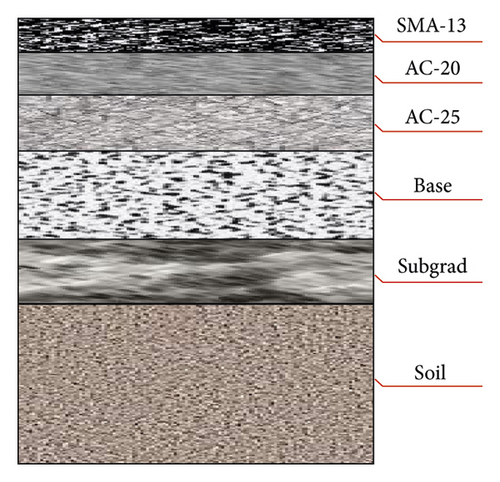
The upper layer, middle layer, and lower layer are viscoelastic. The base layer, sub-base layer, and soil layer are linear elastic. The parameters of each layer are listed in Table 4.
| Structural layer | Thickness (mm) | Dynamic modulus (MPa) | Poisson’s ratio | Density (kg/m3) |
|---|---|---|---|---|
| SMA-13 | 4 | — | 0.3 | 2300 |
| AC-20 | 6 | — | 0.3 | 2300 |
| AC-25 | 8 | — | 0.3 | 2300 |
| Base | 40 | 1200 | 0.2 | 2200 |
| Subgrade | 20 | 300 | 0.3 | 2100 |
| Soil | — | 45 | 0.4 | 1800 |
Viscoelastic parameters of asphalt mixtures can be obtained by the dynamic modulus test. Reference [21] was tested according to dynamic modulus test in the Chinese standard JTG E20-2011 [22]. Dynamic modulus was carried out for three asphalt mixtures (SMA-13, AC-20, and AC-25) by the simple performance tester (SPT). During the test, the temperature was set to 4.4 ∘C, 15 ∘C, 20 ∘C, 40 ∘C, and 54.5 ∘Cand the load frequency was set to 0.1 Hz, 0.5 Hz, 1 Hz, 5 Hz, 10 Hz, and 20 Hz. The order of load frequency and the temperature were from low to high. Dynamic modulus and phase angle were automatically obtained by SPT. More details for test results can be found in Reference [21]. Dynamic modulus was transformed to the Prony series based on Equations (3)-(5). Table 5 provides the Prony series of viscoelastic materials at a reference temperature of 20 ∘C.
| τi | gi | ||
|---|---|---|---|
| SMA-13 | AC-20 | AC-25 | |
| 0.0001 | 0.06505 | 0.051952 | 0.028045 |
| 0.001 | 0.27209 | 0.222824 | 0.162232 |
| 0.01 | 0.27277 | 0.271189 | 0.258214 |
| 0.1 | 0.19323 | 0.216740 | 0.265024 |
| 1 | 0.10649 | 0.127760 | 0.177240 |
| 10 | 0.04989 | 0.061263 | 0.074611 |
| 100 | 0.01839 | 0.021408 | 0.021880 |
| 1000 | 0.00789 | 0.009682 | 0.004920 |
| 10000 | 0.01393 | 0.016890 | 0.007655 |
| 100000 | 0.00026 | 0.000291 | 0.000178 |
For the three-dimensional asphalt pavement finite element model, the plane geometric ranges from 1.12 m to 12 m, and the depth direction range is within 0.74 m to 12 m [23]. The contact length and width between the tire and asphalt pavement are 0.24 m and 0.32 m, respectively. Considering the load influence range and improving the calculation efficiency, the length, width, and depth of the asphalt pavement finite element model are set as 3 m, 2 m, and 2 m, respectively, where X-axis is tire running direction (longitudinal), Y-axis is asphalt pavement width direction (lateral), and Z-axis is asphalt pavement depth direction (vertical). Asphalt pavement was completely restrained at the bottom and symmetrically restrained in lateral and longitudinal directions. The interlayer contact of asphalt pavement was completely continuous. The element type was C3D8R, and the number of elements was 146899.
2.3. Development and Verification of Tire-Asphalt Pavement Contact Model
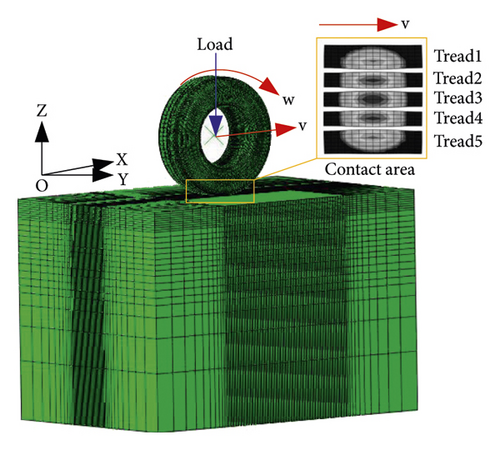
Contact morphology is directly related to the amount of tire deformation caused by load. Therefore, tire stiffness is an important indicator to measure the accuracy of tire-asphalt pavement contact model. The longitudinal, lateral, and vertical stiffness test datum were provided by the Kasaike Tire Company. They carried out the tire stiffness experiment in strict accordance with the Chinese standard [25].
It can be observed from Table 6 that the errors of tire stiffness simulation results were within the permissible range compared with experiment results (all less than 20%) [26]. Thus, the accuracy of tire-asphalt pavement contact model was verified.
| Result | Longitudinal stiffness (N/mm) | Lateral stiffness (N/mm) | Vertical stiffness (N/mm) |
|---|---|---|---|
| Simulation | 823.95 | 551.33 | 1170.02 |
| Experiment | 813.62 | 513.17 | 1208.33 |
| Error | 1.27% | 7.44% | 3.17% |
3. Tire Load
3.1. VTT Dynamics Model
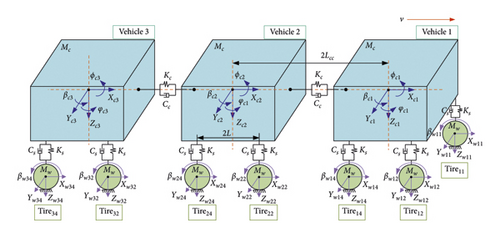
The VTT dynamics model considering was established (see Figure 4) to obtain tire load during the VTT maneuvering. It consisted of three vehicles, which were connected by a coupler device with stiffness and damping. Each vehicle was connected to its corresponding wheel by an independent suspension device with stiffness and damping. The magic formula model was used to describe the dynamic response of the rubber wheels.
3.2. Tire Load of the VTT
To adequately reflect contact morphology during the VTT maneuvering, tire dynamic load under typical running conditions was calculated, including uniform, braking, and cornering.
Running conditions were set as follows: (1) vehicle load was rated load. (2) Pavement grade was B. (3) Velocity under uniform and cornering conditions was 30 km/h. (4) Under braking condition, deceleration was −4m/s2 and velocity changed from 60 km/h to 0 km/h. (5) Curve radius was 30 m. Vertical, longitudinal, and lateral tire loads (left tire, along velocity direction) under different running conditions are displayed in Tables 7-9, respectively.
| Condition | Tire number | |||||
|---|---|---|---|---|---|---|
| 11 | 13 | 21 | 23 | 31 | 33 | |
| Static | 35 | 31 | 33 | 33 | 31 | 35 |
| Uniform | 39.2 | 34.4 | 35.5 | 35.3 | 34.6 | 38.5 |
| Braking | 32.7 | 36.2 | 36.9 | 35.8 | 33.5 | 45.2 |
| Cornering | 48.1 | 42.8 | 45.0 | 44.8 | 42.2 | 48.2 |
| Condition | Tire number | |||||
|---|---|---|---|---|---|---|
| 11 | 13 | 21 | 23 | 31 | 33 | |
| Static | ≈0 | ≈0 | ≈0 | ≈0 | ≈0 | ≈0 |
| Uniform | 793 | 695 | 719 | 716 | 701 | 778 |
| Braking | 14498 | 14533 | 14547 | 14529 | 14526 | 14558 |
| Cornering | 791 | 693 | 709 | 704 | 690 | 763 |
| Condition | Tire number | |||||
|---|---|---|---|---|---|---|
| 11 | 13 | 21 | 23 | 31 | 33 | |
| Static | ≈0 | ≈0 | ≈0 | ≈0 | ≈0 | ≈0 |
| Uniform | 182 | 152 | 174 | 179 | 185 | 226 |
| Braking | 182 | 184 | 200 | 122 | 197 | 150 |
| Cornering | 9977 | 7974 | 8185 | 9489 | 4970 | 10399 |
It can be noted from Table 7 that the direction and magnitude of tire load under uniform, braking, and cornering conditions are more complex than those under static condition, which is closely related to running conditions (road grade, velocity, deceleration, curve radius, etc.,).
4. Results and Discussion
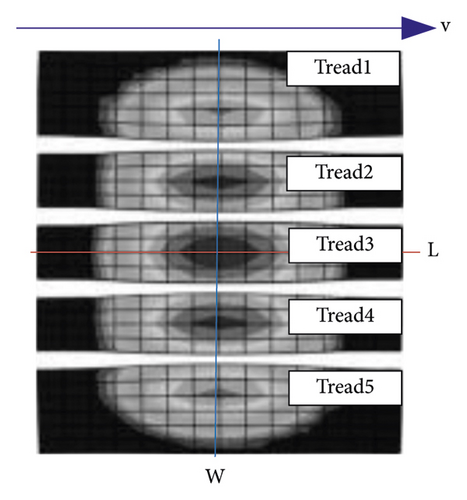
Due to the complex running conditions of the VTT and the large number of tires, it is difficult to analyze the contact morphology of each tire under each running condition. Therefore, tire load under typical running conditions was selected to analyze the variation law of contact morphology. This section analyzed contact morphology around contact stress and contact area. Figure 5 shows the schematic diagram of contact area.
4.1. Contact Morphology Analysis under Uniform Condition
Under uniform condition, no additional driving/braking torque was applied on tire. So, angular velocity was equal to velocity divided by free-rolling radius. Velocity was set to 30 km/h, tire pressure was set to 900 kPa, and tire load was set to 30 kN.
3D contact stress filed simulated from the tire-asphalt pavement contact model under uniform condition is shown in Figure 6. It can be seen that contact area presents rectangular. Vertical stress distribution is symmetrical along length and width directions, respectively. Vertical stress is concentrated in Tread 2, Tread 3, and Tread 4, with a maximum of 1293 kPa (in Tread 3). Longitudinal stress distribution is symmetrical along the width direction. The front side is positive and the rear side is negative along the length direction, with little difference in magnitude. Lateral stress distribution is symmetrical along the length direction. It alternates positive and negative along the width direction.
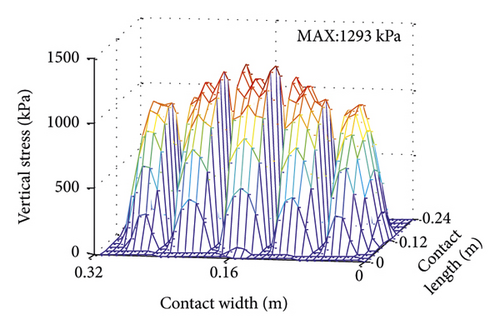
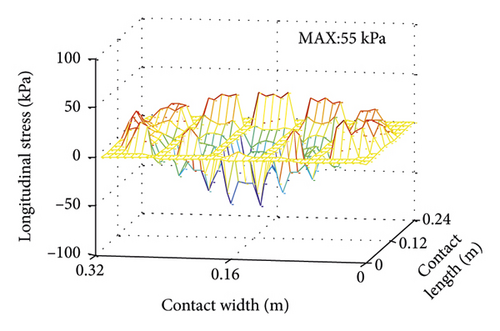
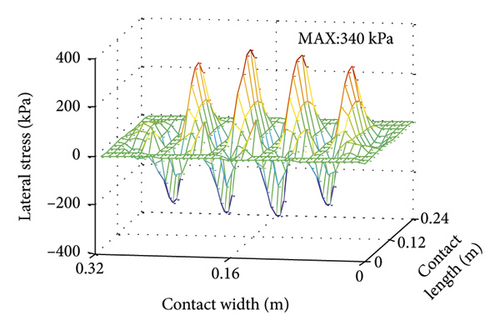
Under uniform condition, longitudinal and lateral stresses are smaller than vertical stresses. Therefore, longitudinal and lateral stresses are neglected in subsequent analysis of influencing factors.
4.1.1. Effect of Load on Contact Morphology
To analyze the effect of load on contact morphology, load was set to 20 kN, 30 kN, 40 kN, and 50 kN. Tire pressure and velocity were set to 900 kPa and 30 km/h, respectively.
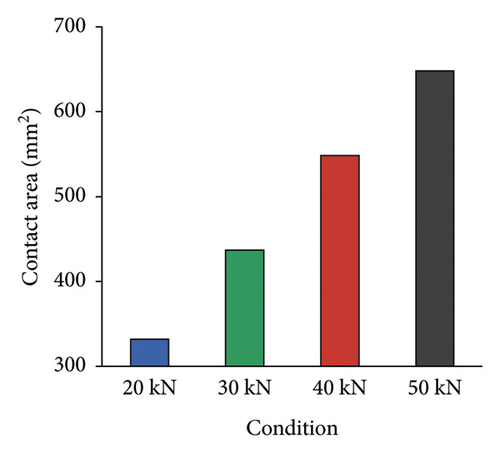
Contact area under different loads is shown in Figure 7. It can be seen that the contact area increases with the increase of load, where contact area under 50 kN is about 2 times larger than that of 20 kN.
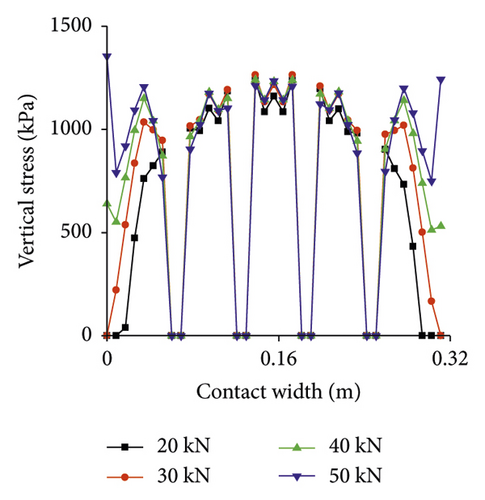
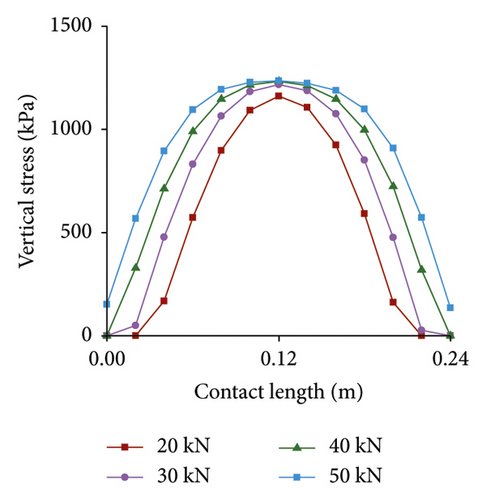
Vertical stress distribution under different loads is presented in Figure 8. Stress maximum increases with increasing load, but growth rate becomes slower, which is due to hyperelasticity of rubber material. As load increases, stress near the tire center increases less, while the edge tread increases significantly, especially Tread 1 and Tread 5. Stress appears as a “convex” shape along the length direction.
4.1.2. Effect of Tire Pressure on Contact Morphology
To analyze the effect of tire pressure on contact morphology, tire pressure was set to 720 kPa, 900 kPa, and 1080 kPa, corresponding to low pressure, rated pressure, and high pressure, respectively. Load and velocity were set to 30 kN and 30 km/h, respectively.
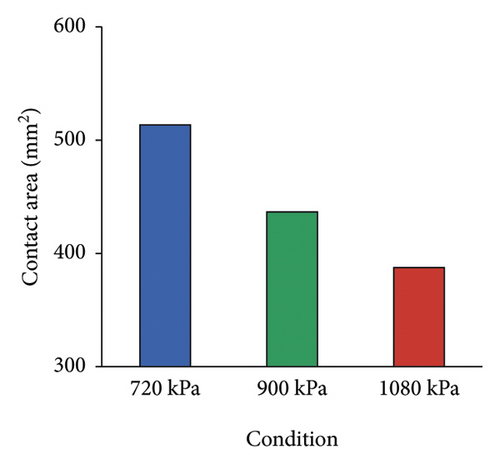
Contact area under different tire pressures is shown in Figure 9. Contact area decreases with the increase of tire pressure, in which contact area under high pressure decreases about 1.3 times than that of low pressure.
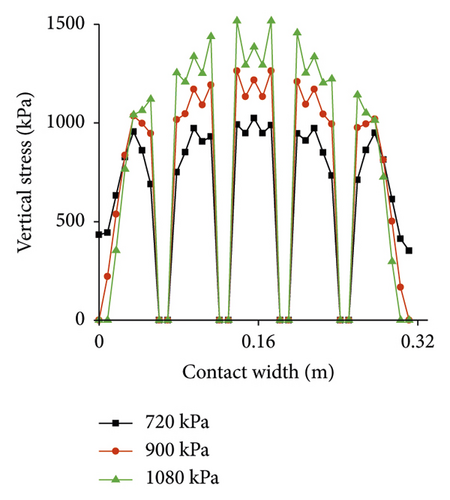
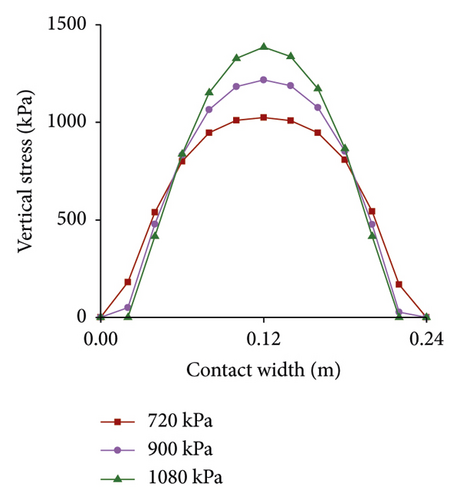
Vertical stress under different tire pressures is presented in Figure 10. It can be found that the distribution of stress is mainly concentrated in the tire center under high pressure, while it is more evenly distributed under low pressure. Overall, stress increases with the increase of tire pressure, and maximum under high pressure is 48% higher than that under low pressure.
4.1.3. Effect of Velocity on Contact Morphology
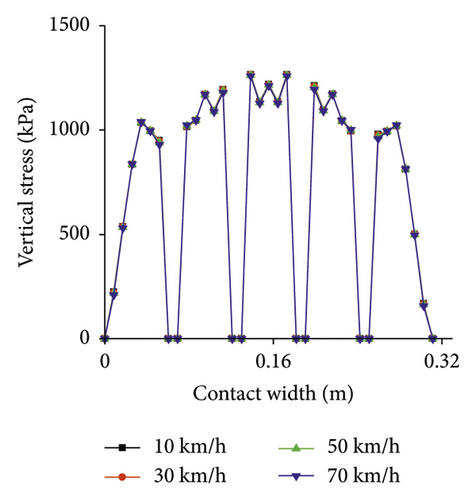
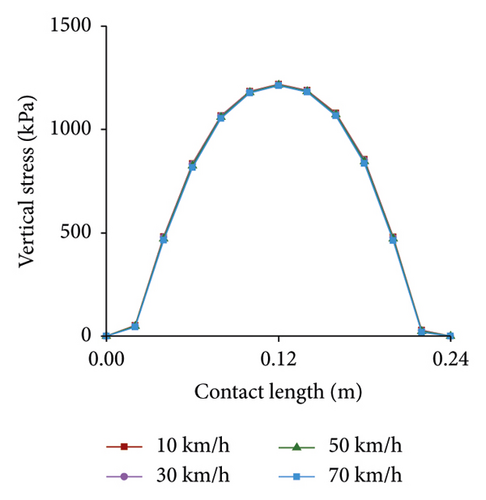
To analyze the effect of velocity on contact morphology, velocity was set to 10 km/h, 30 km/h, 50 km/h, and 70 km/h. Load and tire pressure were set to 30 kN and 900 kPa, respectively.
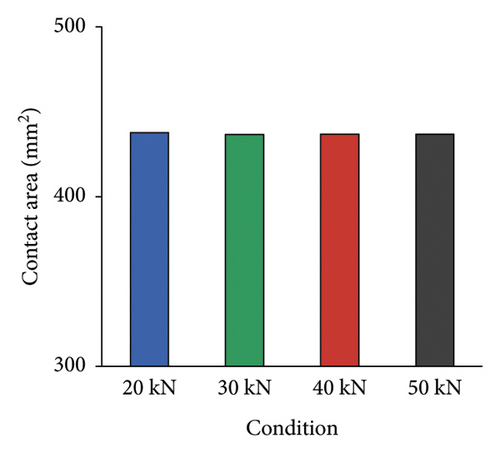
Contact area under different velocities is shown in Figure 11. There is basically no difference in contact area under different velocities.
Vertical stress under different velocities is presented in Figure 12. It can be found that the effect of velocity on stress is limited.
4.2. Contact Morphology Analysis under Braking Condition
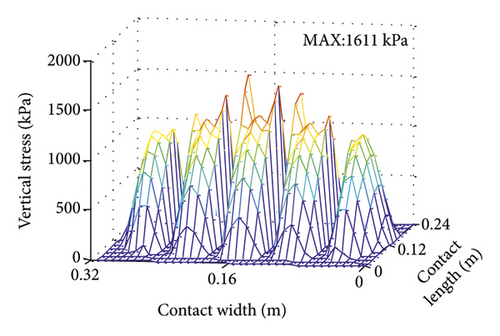
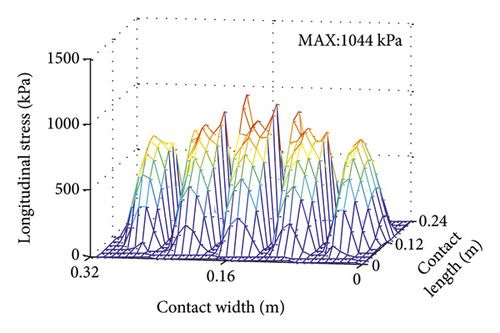
After calculation, it is found that when the slip rate reaches 0.08, the tire can have a relatively large braking effect. 3D contact stress field under full braking condition (s = 0.08) is presented in Figure 13. Vertical and longitudinal stresses have similar distribution rules, both symmetrical along the width direction. Due to the influence of longitudinal friction, the overall distribution of vertical and longitudinal stress is front and rear (along the length direction). The maximum values are evenly distributed in Tread 3, which are 1611 kPa and 1044 kPa, separately. Lateral stress distribution is the same as that under uniform condition.
4.2.1. Effect of Slip Rate on Contact Morphology
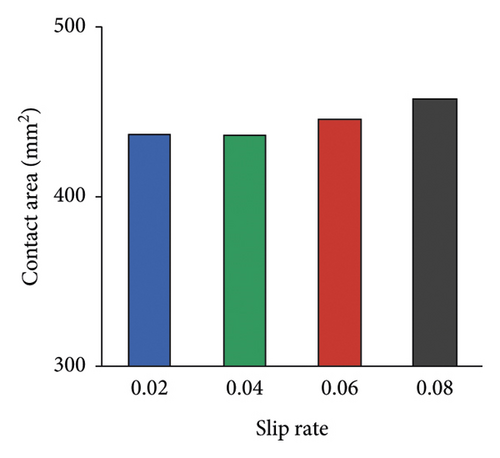
Contact area under different slip rates is shown in Figure 14. As slip rate increases, contact area tends to increase in general, but the change is small. Compared with 0.02, contact area at 0.08 only increases by about 4.8%.
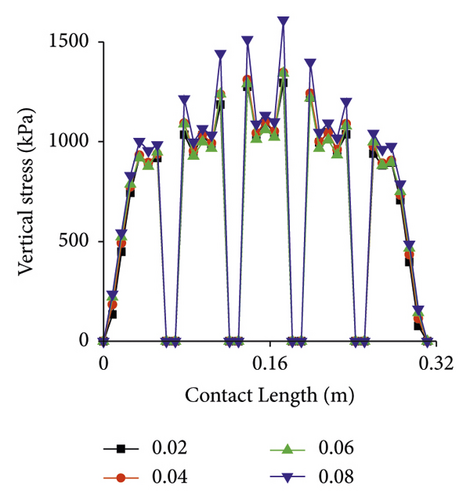
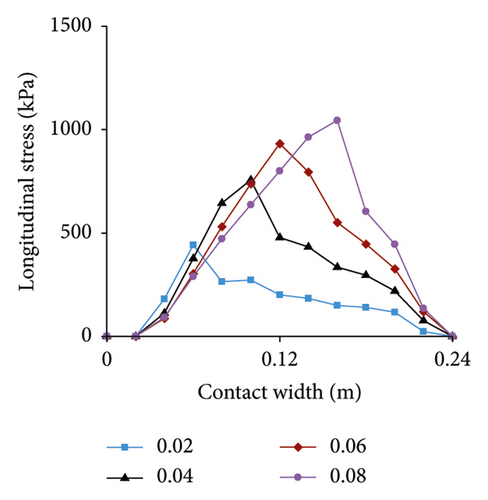
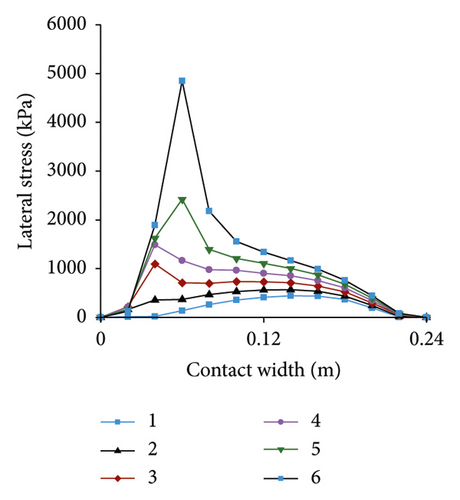
Vertical stress under different slip rates is presented in Figure 15. Vertical stress distribution is significantly affected by slip rate. As slip rate increases, the larger stress gradually moves toward the front side of contact area (along the length direction). The maximum value at 0.08 is a 25% increase compared to slip rate at 0.02.
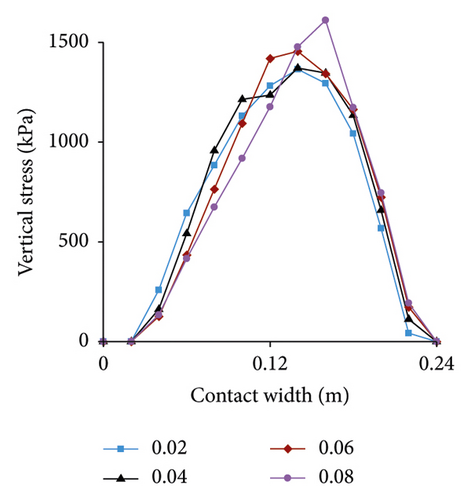
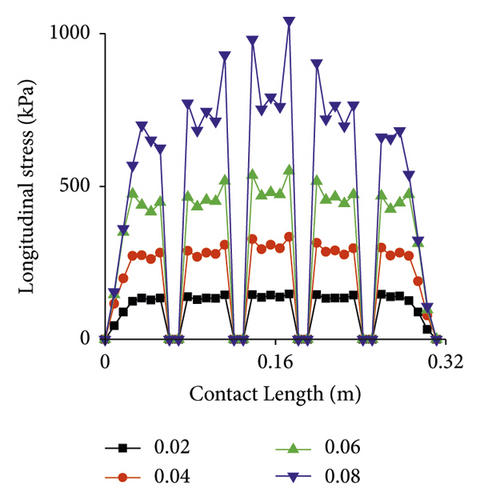
Longitudinal stress under different slip rates is displayed in Figure 16. Similar to vertical stress, lateral stress is also greatly affected by slip rate, but more significantly than vertical stress. The maximum stress at 0.08 is 600% higher than at 0.02.
4.3. Contact Morphology Analysis under Cornering Condition
When a vehicle is passing through a curve, tire is subjected to lateral friction of pavement to balance the centrifugal force generated by the vehicle. Thus, slip angle occurs as tire corner.
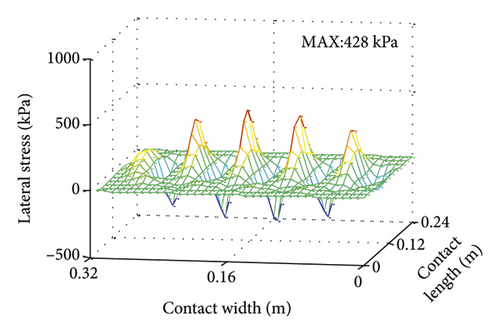
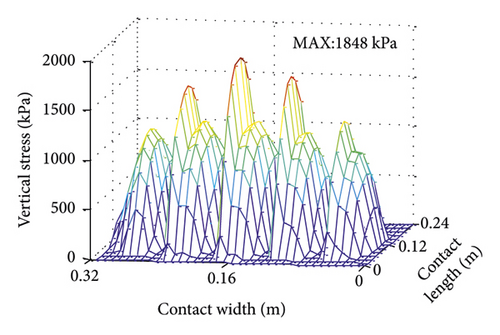
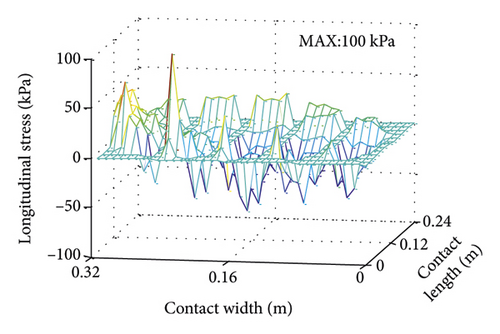
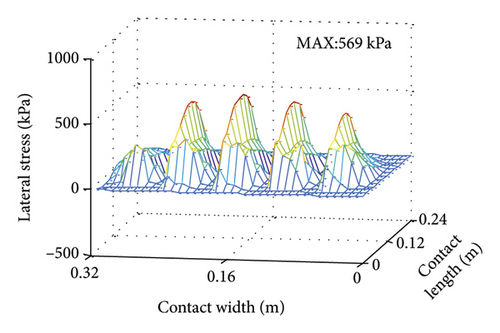
3D contact stress filed under cornering condition (slip angle is 2°) is presented in Figure 17. The distribution trends of vertical and longitudinal stress are consistent, and both are symmetrical along the length direction. Contact area is larger on the cornering inside and smaller on the cornering outside. Vertical and lateral stresses are concentrated on the inner side of the cornering, and the maximum stress appears at the edge of Tread 3 near the inner side of the cornering. Longitudinal stress distribution is approximately the same as under uniform condition.
4.3.1. Effect of Slip Angle on Contact Morphology
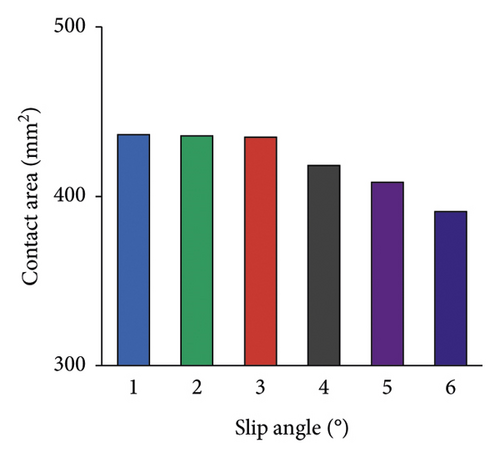
Contact area under different slip angles is shown in Figure 18. Contact area decreases with the increase of slip angle, and it reduces 1.1 times at 6° than at 1°.
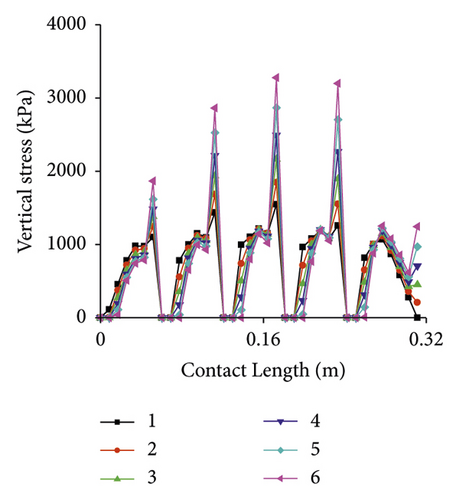
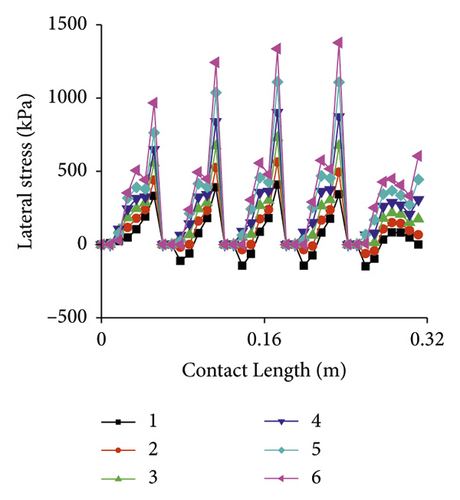
Vertical stress under different slip angles is presented in Figure 19. With the increase of slip angle, contact area decreases and lateral friction increases. Vertical stress is gradually concentrated mainly in each tread near the inner side of cornering and increases accordingly. The maximum stress value at 1° is 384% higher than that at 6°.
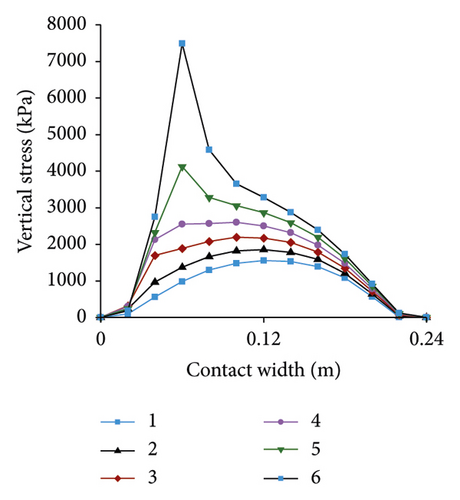
Lateral stress under different slip angles is displayed in Figure 20. The trend of lateral stress is similar to that of vertical stress. Lateral stress is mainly distributed in each tread near the inner side of the cornering. As slip angle increases, lateral stress gradually becomes positive and increases continuously.
5. Conclusions
To analyze contact area and contact stress under uniform, braking, and cornering conditions, the tire-asphalt pavement contact model was developed based on the Euler–Lagrange method. The contact morphology of the VTT during maneuvering was simulated and compared. The main conclusions are as follows:
Under uniform condition, vertical stress is symmetrical along the length. The larger stresses are concentrated on both sides of each tread along the width direction. Longitudinal stress is positive on the front side and negative on the back side along the length direction. Lateral stress alternates positive and negative along the width direction.
Under braking condition, the distribution of vertical and longitudinal stresses is similar. By the action of friction, both are wide in front and narrow in the rear along the length direction. Lateral stress distribution is basically the same as that of the uniform condition.
Under cornering condition, contact area on the inside of the cornering is larger, and vice versa is smaller. The distribution of vertical and lateral stresses is similar, and the larger values of both are concentrated on the tread on the inside of the cornering.
Contact area increases with the increase of load and decreases with the increase of tire pressure. The increase in load causes an increase in vertical stress, but the growth rate becomes slower. Higher tire pressure causes vertical stress to be concentrated mainly in tire center, while lower tire pressure results in a more uniform distribution. Velocity has a limited effect on contact morphology.
The increase of slip rate makes the distribution of vertical and lateral stresses change, and the larger stress increases with the increase of slip rate and moves to the front side of running direction. Longitudinal stress is more significantly affected by slip rate, which is 600% higher at 0.08 than at 0.02.
When slip angle gradually increases, contact area of the cornering inner side increases, and the cornering outer side decreases. Both vertical and lateral stresses increase, and the larger stresses are mainly distributed on the inner side of the cornering.
It can be clear from the analysis results that the contact morphology of the tire-asphalt pavement is significantly affected by the running conditions and related factors (load, tire pressure, slip rate, and slip angle). The analysis of contact area and stress distribution between tire and asphalt pavement during VTT maneuvering in this paper can be used to analyze pavement response and damage under typical running conditions. Furthermore, asphalt pavement is considered for the commonly used semirigid asphalt pavement structures. The design of materials, structures, and other conditions can be further developed in future research.
Conflicts of Interest
The authors declare that they have no conflicts of interest.
Acknowledgments
This work was supported by the Open Project Program of the State Key Laboratory of Traction Power of Southwest Jiaotong University (TPL2107), the National Key Research and Development Program of China (Research on the train load and rutting evolution of the virtual track train 2018YFB1201603-08), and the Shanghai Collaborative Innovation Center for Multi-Network and Multi-Mode Rail Transit (28002360012).
Open Research
Data Availability
The data used to support the findings of this study are included within the article.


