Predictive Analysis and Simulation of College Sports Performance Fused with Adaptive Federated Deep Learning Algorithm
Abstract
With the widespread use of intelligent teaching, data containing student performance information continues to emerge, and artificial intelligence technology based on big data has made a qualitative leap. At present, the prediction of college students’ sports performance is only based on the past performance, and it does not reflect the student’s training effect very well. In order to solve these problems, this paper puts forward the analysis and simulation of college sports performance fusion with adaptive federated deep learning algorithm, aiming to study the influencing factors of student sports performance and suggestions for improvement. This paper uses an adaptive federated learning method and a personalized federated learning algorithm based on deep learning and then proposes a student performance prediction method. These methods integrate the quantitative methods of motor skill assessment and establish standards for college students, which are good standards for evaluating college students’ sports skills. This paper adopts the performance prediction framework and then establishes the sports performance prediction model. Through the analysis of sports performance analysis examples, it is concluded that the model proposed in this paper can accurately predict the student’s sports performance, and the average accuracy rate of each sports item has reached 91.7%.
1. Introduction
1.1. Background
The contradiction between the demand for physical and mental health in today’s society and the continuous decline in the physical and mental health of young people is attracting attention from all walks of life. Physical health is the basis for a person’s all-round development, and physical fitness is an important part of health and an important content of quality education. Federated learning is essentially a distributed machine learning technology and a machine learning framework. The rapid development of university informatization and the continuous advancement of software engineering technology have promoted the process of education informatization in China. Teachers have accumulated a large amount of student learning data in the education process, but these data are currently only stored in the system’s database and have no real effect. Through data mining technology, users can obtain useful knowledge and discover relevant laws from these data and information. These data can provide good decision-making basis for optimizing all links of education and improving the quality of education.
1.2. Significance
The performance prediction warning is to predict the student’s final grade through various data reflecting the student’s learning situation during the learning process and to give early warning to those who may fail in their academic performance. Therefore, studying the prediction model of curriculum performance has important practical significance in improving the quality of education and reducing the dropout rate of students. Aiming at physical education in a Chinese university, this paper studies a performance prediction model based on adaptive correlation deep learning algorithm and uses this model to build a course performance early warning system. This article focuses on the issue of college sports, will strengthen the work of college sports, enhance the quality of students, promote the overall development of students, and further emphasize the value and importance of research, so as to better play the leading role of the evaluation mechanism. This research establishes a scientific and reasonable student quality evaluation index system, which has specific theoretical and practical significance for effectively promoting the health of students.
1.3. Related Work
Federated learning and deep learning are currently hot research topics, and there are more and more application fields. Liu et al. introduced a privacy protection machine learning technology called federated learning and proposed a gated recurrent unit neural network algorithm based on federated learning for traffic prediction. The algorithm he proposed is different from the current centralized learning method. In the security parameter mechanism, data privacy can be effectively guaranteed [1]. Manias and Shami proposed federated learning and deployed a joint model on the transportation infrastructure through ITS case studies to improve the ability of automobiles to recover from failures using smart technology, while reducing recovery time and improving compatibility [2]. Ahmed et al. proposed an embedding model based on federated learning for transaction classification tasks, which can learn low-dimensional continuous vectors through high-frequency trading commodities. They conducted in-depth experimental analysis on the amount of high-dimensional transaction data to verify the performance of the development model based on the attention mechanism and federated learning [3]. Alguliyev et al. proposed a deep learning method for big data privacy protection analysis, which converts the sensitive part of personal information into nonsensitive data. In order to reduce the loss in data conversion, they added the sparsity parameter to the objective function of the autoencoder through the Kullback-Leibler divergence function [4]. Khan et al. proposed a two-stage calculation model based on deep neural networks, which uses standard learning methods to automatically extract information features from RNA sequences. The method they proposed does not require a lot of ergonomics and professional knowledge to design an accurate recognition model [5]. The deep learning model proposed by Farooq and Bazaz can intelligently adapt to the new ground reality in real time. Every time a new data set is received from evolving training data, there is no need to retrain the model from scratch. The model was validated with historical data, and a 30-day forecast of disease transmission was given in the five states most severely affected by the new coronavirus in India [6]. Voegele et al. proposed a performance prediction method, which aims to automatically extract and convert workload specifications for load testing and model-based performance prediction of session-based application systems. This method (WESSBAS) includes three main components, hierarchical modeling of workload specifications that are not related to systems and tools and converting instances into executable workload specifications for load generation tools and model-based performance evaluation tools [7].
1.4. Innovation
The prediction model proposed in this paper has a certain impact on the cultivation of students’ comprehensive physical quality and overall development. Experimental results show that a variety of strategy selection methods based on deep learning algorithms can allow quantitative models to help schools formulate strategies. In this article, the author will train neural networks by creating samples to innovate performance prediction models.
2. Adaptive Federated Deep Learning Algorithm
2.1. Adaptive Federated Learning Method
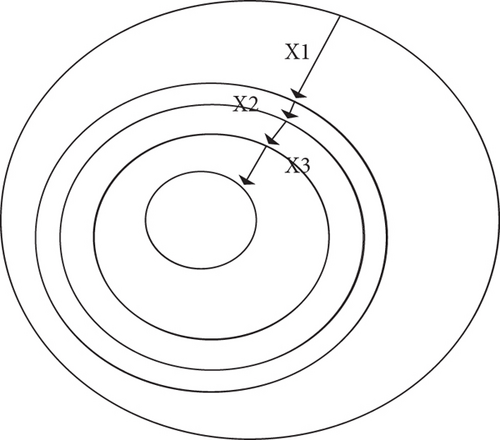
In summary, for training data scattered on multiple clients, the global optimization problem in the learning process of the model can be transformed into the sum of multiple local problems and distributed to each client for joint solution. This is also the prototype of the idea of federated learning. The calculation process of federated learning can be described with reference to Figure 1. Assuming that a certain function as an optimization target is defined on a plane, and its graph has a bowl shape, the blue curve is a contour line, that is, this line represents a constant value of the function.
In order to optimize the communication cost of federated learning and improve its efficiency, it is necessary to analyze and elaborate its communication process in detail [11]. The network protocol of the federated learning architecture is shown in Figure 2. The participants of the protocol are client devices and servers, and the latter provides a cloud-based distributed service platform.
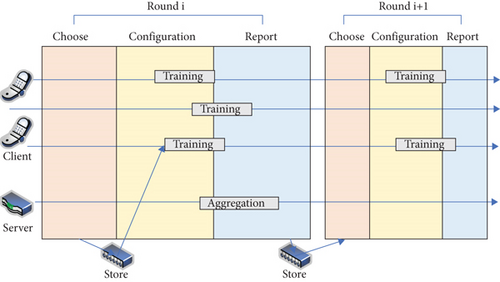
Therefore, after each client n calculates the parameter update of its own local model, it uploads it to the server for global aggregation to obtain the parameter update of the global model. Then, the server starts the next round of iteration and distributes the model obtained from the previous round of training to the device to train the next round of updates. through the implementation of a complete gradient descent and model update operations on the device. The Fed Avg algorithm provides better performance than Fed SGD and reduces communication overhead. Therefore, this algorithm is regarded as a standard algorithm for federated learning, has a high degree of recognition, and is widely used [12].
2.2. Personalized Federated Learning Algorithm Based on Deep Learning
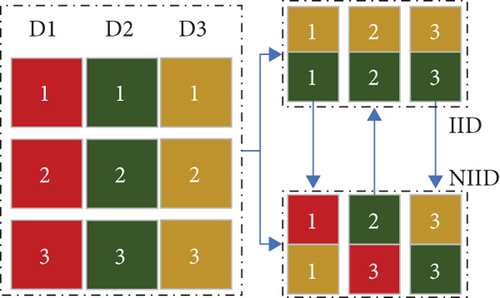
After determining the setting of the calculation parameters, this article compares the parameter settings in Table 1.
| Numbering | Data set | Data distribution | Calculation | Total client | Number of categories | Number of training sets |
|---|---|---|---|---|---|---|
| 3-1-1 | MNIST | IID | Independent calculation | 9 | 9 | 2600 |
| 3-1-2 | MNIST | IID | Federated computing | 9 | 9 | 2600 |
| 3-1-3 | MNIST | NIID | Independent calculation | 9 | 9 | 2600 |
| 3-1-4 | MNIST | NIID | Federated computing | 9 | 9 | 2600 |
| 3-1-5 | EMNIST | IID | Independent calculation | 9 | 18 | 3600 |
| 3-1-6 | EMNIST | IID | Federated computing | 9 | 18 | 3600 |
| 3-1-7 | EMNIST | NIID | Independent calculation | 9 | 18 | 3600 |
| 3-1-8 | EMNIST | NIID | Federated computing | 9 | 18 | 3600 |
Specifically, the randomly initialized global model is sampled, and the number of samples in this paper is 100. The global initialization model for each sampling can calculate the similarity value sim(i, j) between any two clients. The mean value of the similarity of 100 samples is counted as E[sim(i, j)]. Through the analysis of these calculation results, some important factors related to personalization can be discovered. Table 2 shows the corresponding calculation results.
| Numbering | c1 | c2 | c3 | c4 | Average |
|---|---|---|---|---|---|
| 3-1-1 | 88 | 82.5 | 84.9 | 83.4 | 84.7 |
| 3-1-2 | 80.2 | 81.2 | 84.5 | 82 | 81.975 |
| 3-1-3 | 81.4 | 86.5 | 83.5 | 89.3 | 85.175 |
| 3-1-4 | 81.9 | 87.7 | 81.6 | 81.7 | 83.225 |
| 3-1-5 | 83.3 | 85 | 85.7 | 84.3 | 84.575 |
| 3-1-6 | 85.2 | 80.9 | 80.9 | 87.7 | 83.675 |
| 3-1-7 | 87.9 | 86.2 | 89.7 | 87.3 | 87.775 |
| 3-1-8 | 85.5 | 80.2 | 80.8 | 83.5 | 82.5 |
The analysis of the calculation results can be considered that if each client can obtain a positive gain in a nonindependent and identically distributed scenario, then personalized learning can be well realized [16].
Through the federated average learning algorithm, the key factors related to personalization in federated learning are explored. This section proposes a personalized federated learning algorithm based on deep learning. The core is to model the correlation between clients [17]. The algorithm includes personalized algorithms for the client and server, and different weights are assigned to the client through correlation, and a personalized integration strategy is realized.
2.3. Methods of Predicting Student Performance
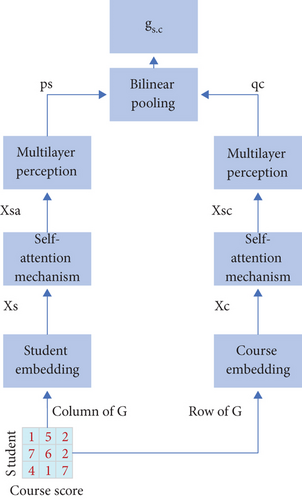
In the input layer, construct the grade matrix of T semester student-course data as G, G(n) is the row vector of the student’s score for each course, and Gj is the column vector of each student’s score in different courses. In the formula, (i, j) ∈ Ω, this article uses G(n) and Gj as the prediction model input [18].
This formula can predict students’ grades in the T semester. The structure of student performance prediction method based on deep learning is shown in Figure 4.
3. Performance Prediction Model Experiment and Analysis
3.1. Performance Prediction Framework
In order to verify the accuracy of the performance prediction model proposed in this paper, this paper designs two experiments: (1) multisource small sample, focusing on the fusion of multispatial data and the impact of multidimensional behavior on academic performance [21]; (2) single-source large sample, focusing model’s prediction accuracy for large sample and the difference in behavior patterns of different groups of students in liberal arts and sciences. The research framework of this article is shown in Figure 5.
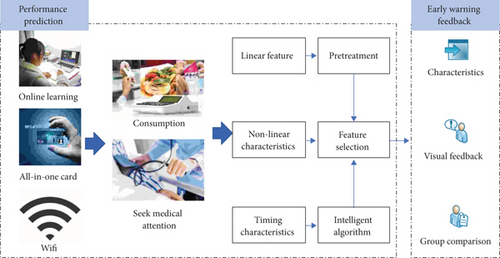
It can be seen from Figure 5 that this research framework is mainly composed of academic prediction and early warning feedback. The main data sources of this research include digital educational administration system, all-in-one card, and cloud classroom online learning data. In this article, the experiment attempts to build a multidimensional behavioral quantitative calculation system to ensure the protection of secret data, encrypt key personal information, and divide the academic performance into various intervals based on the average score [22]. The early warning feedback part includes providing feedback and early warning to high-risk students based on the predicted results.
This article establishes a classification model based on machine learning algorithms to predict academic performance and builds classification models based on five machine learning algorithms: RF random forest, GBRT gradient boosting decision tree, KNN nearest neighbor, SVM support vector machine, and extreme gradient boosting XGBoost. Table 3 shows the experiments and experimental results to verify the prediction results.
| Data | Feature | Algorithm | Accuracy | Precision | Recall | AUC |
|---|---|---|---|---|---|---|
| D1 (SPOC) | C-1 | RF | 0.114 | 0.502 | 0.459 | 0.533 |
| GBRT | 0.439 | 0.343 | 0.909 | 0.604 | ||
| D2 (all-in-one card) | C-2 | KNN | 0.606 | 0.542 | 0.230 | 0.702 |
| SVM | 0.018 | 0.534 | 0.615 | 0.527 | ||
| D3 (WiFi) | C-3 | XGBoost | 0.723 | 0.906 | 0.128 | 0.181 |
RF (random forest), GBDTm and XGBoost all belong to the ensemble learning model. The purpose of ensemble learning is to improve the generalization ability and robustness of a single learner by combining the prediction results of multiple base learners. That is, there is a strong dependency between individual learners and a serialization method that must be generated serially, and there is no strong dependency between individual learners and a parallelization method that can be generated at the same time. The former is represented by boosting, and the latter is represented by bagging and “random forest.”
Although the five machine learning algorithms have their own performance advantages, in general, the classification performance of the five machine learning algorithms has a small gap on this data set [23]. The experimental result is that more data sources can make the prediction results more accurate. In order to better illustrate this point, this study considered the performance prediction model based on SVM and also compared the performance of three different feature combinations, as shown in Figure 6.
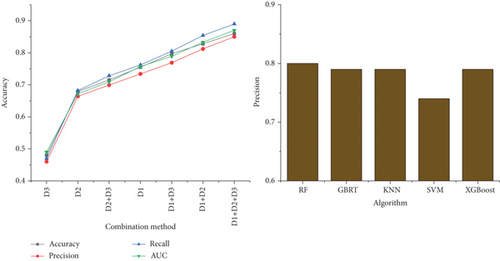
As shown in Figure 6, from DI to D1+D2 and DI+D2+D3, all five classification evaluation indicators increase significantly with the increase of data source types. This experiment proves that richer data sources help to explore the deep-level mechanism of student behavior. All five evaluation indicators of C-3 (accuracy, accuracy, recall, f, and AUC) are significantly higher than C-1 and C-2. This result shows that the multifeature combination (namely, C-3) proposed in this research can significantly improve the predictive ability of academic performance.
In addition, this article calculates and supplements six other indicators and also calculates the Pearson correlation r between these indicators and academic performance. The closer the absolute value of r is to 1 or -1, the stronger the correlation between the two, and the closer r is to 0, the weaker the correlation between the two. The index evaluation is shown in Figure 7.
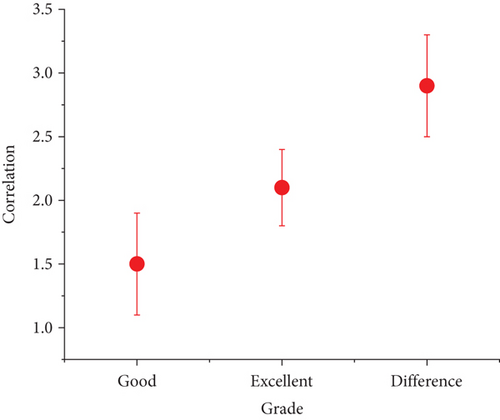
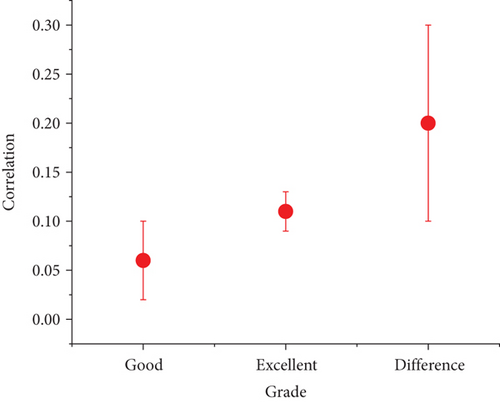
In the smart campus environment, this study collected student behavior data noninvasively, established a high-precision sports performance prediction model, and provided a basis for decision-making for college administrators [24]. This research has obtained conclusions on the behavior patterns of students with different liberal arts backgrounds and their impact on academic performance, which will help managers to further guide and optimize students’ daily behaviors.
3.2. Establishment of Sports Performance Prediction Model
The research of performance prediction model is to predict the specific aspects of specific students. Now, by predicting specific physical abilities and specific abilities, we can comprehensively improve sports performance and create more economic value. This article has achieved this goal. In the process of modern sports training, coaches conduct regular assessments and evaluations of students, estimate their specific performance based on the results of the assessment items, and adjust their regular training plans. These data need to provide a basis for students’ training. Over the years, coaches and scholars have continued to study, provide scientific improvement programs for student training, clarify students’ sports training goals, and cultivate many outstanding sports talents through the establishment of performance prediction models. Therefore, the research of sports performance prediction model is a highly scientific and practical research.
This article will survey 100 students aged 18 to 21 from a sports school in China. Scientific index selection is the prerequisite for establishing an evaluation model. Through a variety of mathematical statistical methods and scientific selection of parameter indicators, this article can provide a reliable basis for formulating students’ training goals. Therefore, this article needs a mathematical analysis of whether the special performance and various special fitness indicators are normally distributed. After the scientific data test, the special performances and the special fitness indexes investigated are normal, which is enough to show that the method of screening indexes through factor analysis has scientific hypothesis for this topic. In order to clarify the degree of closeness between the variables, this article first conducts a correlation analysis and establishes a correlation coefficient matrix.
There are many physical factors that affect sports performance. Through research and statistics, this article classifies and sorts out the indicators that can accurately reflect the physical fitness level and the typical indicators closely related to the development of specific performance and obtains the four-element regression equation of the student’s specific physical fitness indicator system, that is, a special performance prediction model. Among them, the prediction model includes 30-meter running with a gun (continuous), 3-step approach and 5-step jump, and a ball with a weight of 300 grams on the shoulder during the full approach, dependent variable: specific performance.
The purpose of the evaluation system established is to enable students to obtain objective and quantitative evaluations of the training and development level of various indicators. According to the individual development characteristics of the students and the development requirements of special sports events, the main special physical fitness that affects the performance is grasped as a whole. Therefore, the establishment of an evaluation system is the basis and prerequisite for quantitative monitoring of model training and an important link in the implementation of system control. The system has a good reference for training planning and implementation, as well as the evaluation and feedback of training effects.
In order to explain the differences between the four special physical fitness sensitive indicators that influence youth sports performance extracted by factor analysis, this study adopted the standard percentage method to evaluate the individual indicators of the main influencing factors. According to the relevant statistical analysis described above, it is shown that the normal distribution of various indicators of specific performance and specific physical fitness is better, as shown in Figure 8.
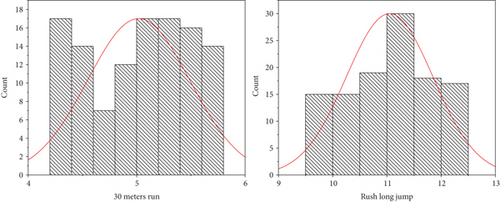
Using factor analysis and other mathematical statistical methods to analyze, in order to make the special physical fitness training of these students truly scientific, optimize the special physical fitness training system and other factors that may affect the special performance. Physical education teachers can comprehensively consider factors such as general abilities, special skills, and body shape in the process of adopting modular special physical fitness training to achieve the best results of scientific training.
3.3. Examples of Sports Performance Analysis
The basic process of establishing a special motor skill evaluation system in this paper is to screen out all the difficult movements that can reflect the level of motor skills, establish an effective technical level evaluation index system, and construct a scoring scale one by one. Sports index testing is actually testing and scoring students in accordance with the scoring standards, and the accuracy of the evaluation results is evaluated by a dedicated coach. Table 4 shows the test results of the subject’s body type and fitness index.
| Index | Average | Standard deviation | Lowest value | Highest value |
|---|---|---|---|---|
| Height | 172 | 3.6 | 154 | 186 |
| Weight | 60 | 2.7 | 41 | 76 |
| Shoulder width | 35 | 2.9 | 30 | 40 |
| Chest circumference | 84 | 2.5 | 79 | 89 |
| Waistline | 67 | 2.8 | 62 | 72 |
| Hips | 91 | 3.5 | 86 | 96 |
| Upper limb length | 71 | 4.7 | 66 | 76 |
| Arm length | 46 | 4.1 | 41 | 51 |
| Tight upper arm circumference | 29 | 2.8 | 24 | 34 |
| Relax upper arm | 30 | 2.5 | 25 | 35 |
| Thigh circumference | 54 | 3.3 | 49 | 59 |
| Standing long jump | 2.04 | 2.3 | -2.96 | 7.04 |
| Seated pregenus | 29 | 4.9 | 24 | 34 |
| Minute push-ups | 87 | 2.2 | 82 | 92 |
| Cross jump test | 8 | 4.3 | 3 | 13 |
| 1 minute skipping rope | 143 | 4.6 | 138 | 148 |
| 800 m run | 193 | 5 | 188 | 198 |
| 30-meter run | 5 | 2 | 4 | 6 |
From the results of the cluster analysis, it can be seen that among the indicators selected for the second time, the 1-minute push-up and the right-angle support are classified into one category, indicating that there is a very high degree of correlation between these two indicators. For a sports student, if the performance of 1-minute push-ups is excellent, then his performance of right angle support must be excellent, and vice versa, so this article only needs to select representative indicators.
Existing predictive models for student specific performance generally use multiple regression methods and gray models. This paper establishes the functional relationship between specific performance and quality training level and then predicts performance through student performance recognition. These predictive models reflect the relationship between special performance and training indicators to a certain extent and provide corresponding guidance for trainees’ training. However, the decisions of these models are based on certain assumptions, so formulas for special performance prediction models must be set in advance. In fact, the functional relationship between special performance and various related factors is very complicated, and the presumed formula does not fit these relationships well.
After a lot of training and prediction tests, this article found that adding some test data will affect the convergence speed and prediction accuracy of the model. For example, due to some special circumstances, the training time is not long enough, or there is a deviation in certain index tests. Therefore, this kind of data was excluded in the test. Federated learning algorithms have high requirements for computer configuration, especially memory, due to the huge amount of calculation. The entire training prediction process consists of 6 modules, as shown in Figure 9.

This article uses body shape, physical function, physical strength, ontology knowledge, operational knowledge, basic skills, technical combination, sports learning experience, sports competition participation experience, etc. as secondary indicators, reflecting the diversification of sports quality evaluation. On this basis, this article subdivides 25 three-level indicators, which are easy to operate and quantify, and scientifically assign weights to the above indicators.
According to the prediction model proposed in this article, 100 students’ 9 sports performances were predicted and compared with their actual scores. The comparison results are shown in Figure 10.
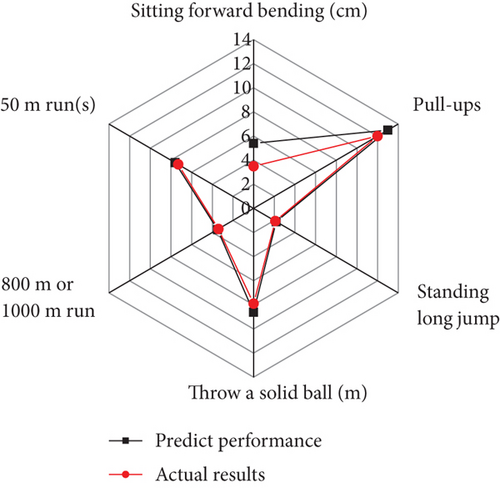
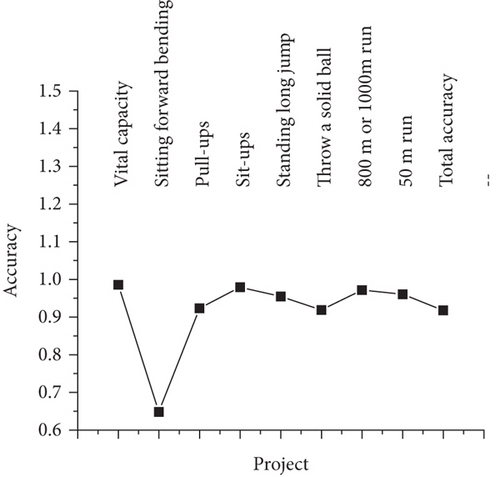
It can be seen from Figure 10 that there is not much difference between the predicted result and the actual score, and the overall accuracy rate has reached 91.7%. The experimental results show that the model can provide relatively accurate prediction results for teachers and students.
4. Discussion
The above are the main research results of this article. Although the algorithm proposed in this paper can better improve the problems caused by the average aggregation method of the classic federated learning algorithm, there are still some problems that have not been considered. In terms of privacy protection, this article adopts a privacy protection method consistent with the classic Fed Avg, that is, to protect privacy by transferring model parameters while retaining the original data locally. However, this level of privacy protection cannot meet the requirements of higher levels. In the future, more secure privacy protection technologies can be explored to empower federated learning. This paper is based on the performance prediction model constructed by federated learning and deep learning algorithms, which can provide teachers and students with relatively accurate prediction results. However, the accuracy of the stage performance prediction model to predict the final score interval is not good, so the next work needs to optimize the construction of the stage performance prediction model.
5. Conclusions
This paper studies a performance prediction model based on federated learning and deep learning algorithms and uses this model to implement a sports performance early warning system. In this article, the author will use a deep learning algorithm to predict the performance of 100 students based on a real-world application of improved algorithms, investigate the impact of physical learning on physical performance, and analyze the classification rules generated for students in various basic courses. This model can provide teachers with real-time understanding of the training situation of class students, the results of course performance prediction, and early warning to notify students in crisis, so that the quality of class teaching can be improved by guiding students in crisis in advance. It can provide students with real-time understanding of personal learning situation, sports performance prediction results, and viewing early warning reasons and learning suggestions, so that they can avoid missed courses through strengthened training.
Conflicts of Interest
The author declares no conflicts of interest.
Open Research
Data Availability
The data used to support the findings of this study are available from the corresponding author upon request.


