[Retracted] Comprehensive Decision Analysis of Industry 4.0 Virtual Enterprises considering the Personalized Customization Model of Product Life Cycle
Abstract
In the era of Industry 4.0, various types of information accumulated by enterprises in the production process have become a sea of data. These manufacturing-related data originate from enterprises and are used by enterprises and include not only process data such as documents and pictures but also complex information such as video and sound. Moreover, these data are not only large in quantity and wide in variety but also have the characteristics of fast generation speed and low value density. The model constructed in this paper can be applied to the personalized customization of product life cycle and can help enterprises make comprehensive decision-making. In particular, it can perform intelligent decision analysis under the background of Industry 4.0. In addition, this article combines intelligent algorithms to build an intelligent enterprise comprehensive decision-making system. The experimental research results show that the decision-making system proposed in this paper can play an important role in the comprehensive decision-making of Industry 4.0 enterprises, and this decision-making can be spread throughout the entire life cycle of the product.
1. Introduction
With the rapid development of economy and social industry, the carrying capacity of the environment is no longer sufficient to support people’s current development model with a traditional high investment, high pollution, and high energy consumption. In response to this situation, the German Federal Ministry of Education and Research and the Federal Ministry of Economics and Technology took the lead in proposing the concept of “Industry 4.0.” The Chinese government also immediately proposed the Chinese version of the “Industry 4.0 Plan” or “Made in China 2025” development strategy. The basic policy pointed out that in order to promote the industrial structure to the middle and high end, we must adhere to green development, and green development is an inevitable choice for China [1].
In actual production activities, the core issue for the effective operation of the closed-loop supply chain is its actual operation and management process. The above-mentioned resource recovery and remanufacturing and the impact of remanufactured products on the production of new products have become important factors that companies need to consider in terms of production and operation. By rationally formulating production plans under the closed-loop supply chain, it is not only conducive to enterprises to make full use of production resources to meet market demand but also to minimize production costs and achieve optimal and profitable goals [2]. However, in a competitive closed-loop supply chain environment, companies tend to negatively treat the construction of closed-loop supply chains in enterprises due to the large upfront resource input and long cost recovery periods. In addition, due to the differences in quality and price of new products and remanufactured products, there is uncertainty in the demand market, which makes it difficult for companies to make production decisions. Therefore, how to make reasonable production decisions for new products or remanufactured products and make full use of recycled resources and their own production capacity to better adapt to the ever-changing market environment will also become an inevitable choice for enterprises [3].
The innovation opportunity decision-making model is a scientific and objective expression of the process, method, and mechanism of innovation opportunity decision-making. As an important part of opportunity management, opportunity decision-making is the final foothold of opportunity identification and evaluation, so its status is beyond doubt. However, the current research on the decision-making process of innovative enterprises’ continuous innovation opportunities is still in the stage of theoretical exploration, and effective decision-making models have not yet been constructed and applied to actual business operations. There are also certain controversies about opportunity decision-making itself. Some scholars believe that it is only the selection of decision-making schemes or the implementation of countermeasures and suggestions, while other scholars believe that “management is decision-making,” and decision-making refers to the entire process from the beginning to the end of decision-making.
The model constructed in this article can be applied to the personalized customization of the product life cycle and can help companies make comprehensive decisions. In particular, it can perform intelligent decision-making analysis under the background of Industry 4.0.
2. Related Work
In the era of Industry 4.0, intelligent manufacturing is the leading factor, and information technology can be used to obtain the real-time status of every product, machine, and even every employee in the factory at any time [4]. It is specifically embodied in the organic combination of products, machines, resources, and people through the Cyber-Physical System (referred to as CPS), thereby promoting the manufacturing industry to intelligently transform based on big data analysis and application and realize products. Dialogue with machines, products, and people creates an intelligent manufacturing model that can independently allocate production resources and output products [5]. With the advent of the Industry 4.0 era, the smart manufacturing industry is bound to usher in a new wave. The CPS is used to coordinate and process manufacturing in real time the industrial chain to achieve high-quality and low-cost goals, while meeting the diverse and personalized needs of users, to achieve smart factory [6]. Industry 4.0 has brought amazing efficiency improvements to the manufacturing industry. The current domestic and foreign applications are mainly reflected in the high degree of automation of intelligent production equipment, making the production system not only simple and flexible but also capable of handling various events in real time during the entire production process to ensure the thorough intelligence of the production process [7]. At the same time, this intelligent production model is not only a manifestation of basic automation in a specific environment, but more importantly, it can also achieve the optimization of a world-class network formed by different factories and different production units [8]. This means that in the realization of intelligent manufacturing, the CPS system is used to effectively connect the production equipment and the control network, and the innovative technology is used to integrate the three elements of intelligent machines, efficient analysis, and staff to improve the production of the manufacturing industry, namely, efficiency, reduce cost, and time resource consumption [9].
Many scholars are more in-depth and mature in the research of information behavior from the cognitive perspective. Literature [10] believes that a variety of factors such as personal experience, organization, and education level in a specific situation will affect the cognitive structure and cognitive ability of an individual. Entrepreneur decision-making research from the perspective of ability focuses on the ability of entrepreneurs to use information to make decisions in the decision-making process. Research from this perspective is mostly based on entrepreneurial ability theory, resource management theory, and competitive advantage theory to study entrepreneurial decision-making. The connotation of ability, the influencing factors of entrepreneur’s decision-making ability, the relationship between entrepreneur’s decision-making ability and enterprise competition, the relationship between enterprise growth, and the improvement path of entrepreneur’s decision-making ability are explored [11]. Literature [12] incorporates the entrepreneur’s decision-making ability into the measurement system of entrepreneur’s core competence and analyzes the relationship between entrepreneurial decision-making ability, innovation ability, communication ability, and learning ability. Entrepreneur’s core competence is expanded, and the relationship between entrepreneur’s strategic decision-making ability and corporate performance is explored; the literature [13] summarizes these factors into two major categories: economic structural constraints and entrepreneurial background factors after combing through relevant literature. It also conducts a more detailed analysis and discussion on two types of factors; literature [14] analyzes the performance of entrepreneurs in corporate transformation and analyzes the factors that affect entrepreneurs’ decision-making capabilities in various dimensions; literature [15] focuses on entrepreneurs’ decision-making capabilities to test the logical relationship between the decision-making ability and the competitive advantage of the enterprise and prove that the decision-making ability directly contributes to the competitive advantage of the enterprise and is the source of the core ability; in the research on the relationship between the decision-making ability of entrepreneurs and the growth of the enterprise, the literature [16] combines the research results of entrepreneurs’ decision-making ability and influencing factors that have promoted the growth of enterprises in recent years, the mechanism of entrepreneurial decision-making ability on enterprise growth, the research results of entrepreneurial decision-making ability, and the process of enterprise growth and makes prospects for future research [17]. From the perspectives of exogenous theory and endogenous theory, it explores the relationship between the transformation of entrepreneurial decision-making ability and the growth of enterprises. Literature [18] formulated information literacy standards for corporate managers, from the perspective of information behavior, and proposed ways to improve the decision-making ability of corporate managers.
3. Enterprise Decision-Making Model Based on Virtual Machine Scheduling Model
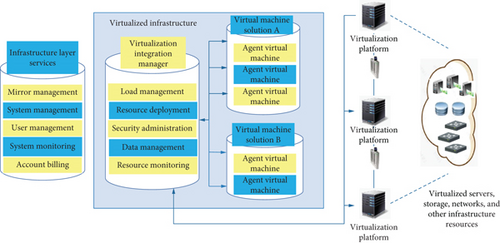
Infrastructure layer services mainly include image management, system management, user management, system monitoring, and account billing. These services correspond to the functions provided by the virtualization integration manager and are the interfaces for users to obtain infrastructure layer resources. The schematic diagram of the infrastructure layer system structure is shown in Figure 1.
Based on the analysis of the cloud computing infrastructure layer architecture, this paper designs a virtual machine scheduling model in the cloud environment. The virtual machine scheduling model is shown in Figure 2.
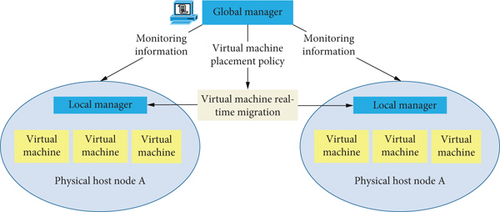
In fact, the global manager can be regarded as a scheduling algorithm in essence, which realizes the replanning of the mapping relationship between virtual machines and physical hosts based on the resource monitoring data of the virtualized environment. It can be implemented using a greedy algorithm, a divide-and-conquer algorithm, or a heuristic algorithm.
The virtual machine scheduling process can be regarded as a control loop composed of three parts: data collection, data analysis and decision-making, and operation execution. Among them, the receipt collection corresponds to the detection process of the resource status and application load status of the data center node. Data analysis decision-making is to predict application load based on the collected monitoring data and determine the selection of virtual machines to be migrated and the placement of virtual machines for scheduling goals such as energy saving and load balancing. The final operation execution stage is to use virtual machine real-time migration technology to migrate virtual machines according to the virtual machine placement plan. The flowchart of the virtual machine scheduling process is shown in Figure 3.
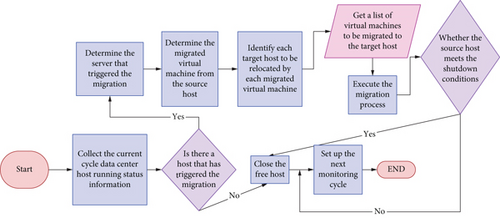
By periodically performing the virtual machine scheduling process described in the above figure in the data center, the resource allocation of the data center can be continuously optimized, thereby improving the energy efficiency of the data center.
In order to facilitate a detailed and in-depth study of the status changes of the physical host, according to the real-time operating status and load status of the physical host in the data center, this paper divides the physical host into 4 statuses and defines them as follows:
Definition 1. Low-load status. It refers to the status when the utilization rate of various resources of the physical host is lower than the lower load threshold Tlow preset by the system. All physical hosts in a low-load state in the data center form a low-load host set Hlow = 〈h1, h2, h3, ⋯, hn〉. For a physical host in this state, all virtual machines running on it must be the target to be migrated.
Definition 2. High-load status. It refers to the state when the utilization rate of various resources of the physical host exceeds the upper limit threshold Thigh of load set by the system. All physical hosts in a high-load state in the data center form a high-load host set Hhigh = 〈h1, h2, h3, ⋯, hn〉. For the physical host in this state, the migration object needs to be selected according to the virtual machine selection policy to be migrated set by the system.
Definition 3. Normal status. It refers to the state when the utilization of various resources of the physical host is between the upper limit threshold Thigh and the lower limit threshold Tlow set by the system. All physical hosts in a normal state in the data center form a normal load host set Hhigh = 〈h1, h2, h3, ⋯, hn〉. The physical host in this state can be used as a candidate target host for receiving the virtual machine to be migrated.
Definition 4. Idle status. It refers to the state that there is no virtual machine performing cloud tasks on the physical host. All physical hosts in an idle state in a data center form an idle host set Hidle = 〈h1, h2, h3, ⋯, hn〉, and they are generally shut down in a dormant state as alternate hosts in the data center [19].
The state of the physical host will change as the load on it changes and the virtual machine scheduling mechanism of the data center. The data center host state transition diagram is shown in Figure 4.
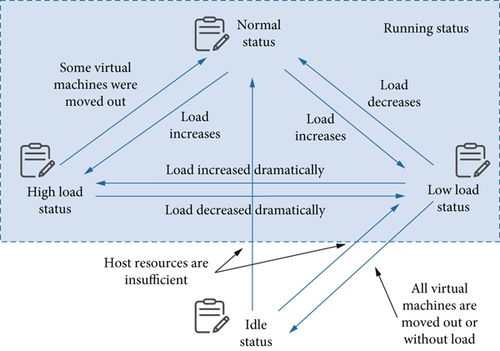
From the above figure, we can see the main reason for the host status changes when the virtual machine scheduling and load changes in the data center. The state of the physical host will change as the load on it changes and the specific virtual machine scheduling mechanism. From this perspective, the virtual machine scheduling of the data center can be seen as a process of reducing the high-load and low-load hosts in the data center by optimizing scheduling measures and maximizing the idle state hosts.
Definition 5. CPU utilization. Generally, the percentage of the total CPU time slice allocated by the running host to the total statistical time is called CPU utilization, which is recorded as UCPU.
Definition 6. Memory utilization. Generally, the percentage of the memory currently used by the running node to the total memory of the node is called the memory utilization, which is recorded as UMEM.
Definition 7. Bandwidth utilization. Generally, the percentage of the bandwidth currently used by the running node to the total bandwidth of the node is called the bandwidth utilization, which is recorded as uBW.
Among them, , , and , respectively, represent the CPU, memory, and network bandwidth utilization of the i-th virtual machine VMJ on the physical server H, and n represents the total number of virtual machines running on the host server H.
The effect of virtual machine scheduling on data centers, physical hosts, and applications is comprehensively evaluated for its effectiveness, and a comprehensive evaluation index system is established. Several main evaluation indexes are introduced below.
Among them, Р represents the total energy consumption of the physical host, Pfull represents the maximum energy consumption of the physical host when the CPU is fully loaded (CPU utilization reaches 100%), and Pidle represents the energy consumption when the physical host is idle without any load.
Among them, k is a constant, called the energy consumption coefficient, and g represents the ratio of the energy consumption (Pidle) when the physical server is idle to the energy consumption (Pfull) when the physical server is fully loaded (usually 0.7). It should be noted that for heterogeneous servers, the energy consumption coefficient k and the maximum energy consumption of the server will also be different.
Among them, Tv(vmi) represents the duration of the SLA violation of the i-th virtual machine in the data center, Tr(vmi) represents the total running time of the i-th virtual machine, and n represents the total number of virtual machines in the data center. The SLA violation rate reflects the ability of the data center to provide service stability, and the lower the value, the better the service quality of the data center.
Among them, degreei represents the load balance of physical node i, that is, the balance of various resource consumption.
3.1. Number of Virtual Machine Migrations
An example diagram of virtual machine selection is shown in Figure 5.
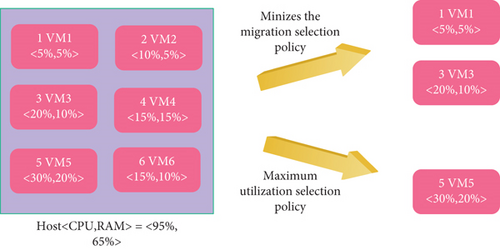
- (1)
The algorithm establishes the initial decision matrix X. We assume that there are m virtual machine selection schemes that can eliminate the overload of the host and form a scheme set Si(i = 1, 2, 3, ⋯, m). For each selection scheme, there are n targets to form a set Ii(i = 1, 2, 3, ⋯, n). And, the goal is divided into positive attribute l+ and negative attribute l−, and there is l = l+ ∪ l−. The constructed decision matrix is:
(11)
- (2)
The algorithm calculates the normalized weighted decision matrix T. The algorithm assigns weights w, according to the importance of each goal, and needs to satisfy at the same time. At present, the methods for determining weights include expert scoring, logarithmic least squares method, and analytic hierarchy process,. The weighting matrix is as follows:
(13)
- (3)
The algorithm determines the ideal solution and the negative ideal solution. The algorithm determines the ideal solution Z∗ and the negative ideal solution Z- according to the profitability index set, the loss index set, and the weighted decision matrix, which are defined as follows:
(15)(16)
- (4)
The algorithm calculates the distance from each scheme to the positive and negative ideal solutions. The distance scale can be calculated with the n-dimensional Euclidean distance. The distance to the positive ideal solution Z+ is denoted by S+, and the distance to the negative ideal solution is denoted by S−:
(17)(18) - (5)
The algorithm calculates the relative closeness of each scheme to the positive ideal solution and obtains the final comprehensive evaluation result value. The calculation method is as follows:
(19)
- (6)
The algorithm sorts based on the relative closeness c of each plan, so as to determine the priority of each plan to form the basis for decision-making. Obviously, choosing the virtual machine selection scheme with the largest c value can ensure that the optimization and trade-off of multiple objectives are met
Obviously, the energy consumption reduction index belongs to the profitability index. The larger the value, the more favorable the evaluation result of the scheme.
Among them, Tmig represents the migration time of a single virtual machine and is the ratio of the used memory (MEM) of the virtual machine to the network bandwidth (BW). Obviously, the migration time is a loss index, and the smaller its value, the better the evaluation result. It should be noted that the virtual machine selection scheme may include one or more selected virtual machines, and the sum of their migration time needs to be calculated as the evaluation value.
Among them, σj represents the standard deviation of the evaluation value of the j-th index in each selection scheme after the standardization, and wj represents the weight of the j-th index, that is, the ratio of the standard deviation of the index to the sum of the standard deviations of each index.
In the case of obtaining expert scores or empirical values, such subjective weights and calculated objective weights can usually be combined to obtain the comprehensive weights of each evaluation index, which can more comprehensively reflect the importance of each evaluation index.
4. Comprehensive Decision-Making System for Industry 4.0 Virtual Enterprises Based on the Personalized Customization Model of Product Life Cycle
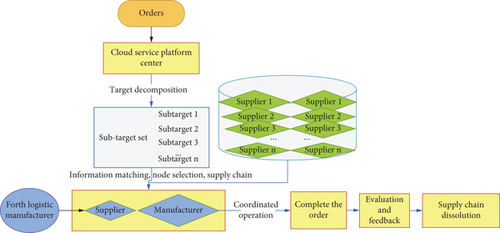
The construction model of dynamic supply chain based on cloud platform proposed in this paper is driven by customer demand and characterized by customization and individualization. With the support of modern smart technology, it takes the manufacturer enterprise group and supplier enterprise group as the resource basis of the whole model and is operated by a cloud platform and a fourth-party logistics service provider to provide customers with high-quality, low-cost, and highly flexible modern products. The dynamic supply chain construction model based on the cloud platform is shown in Figure 6.

During the operation of the entire system, a stable and followable process is required to ensure the efficient operation of the system. Although fourth-party logistics providers also have the ability to select node companies to form a supply chain, the decisions made after scientific processing of relevant data through the cloud platform are more scientific and fair. Therefore, the fourth-party logistics provider in this model does not make supply chain node selection decisions. The operation process of the dynamic supply chain system based on the cloud platform is shown in Figure 7.
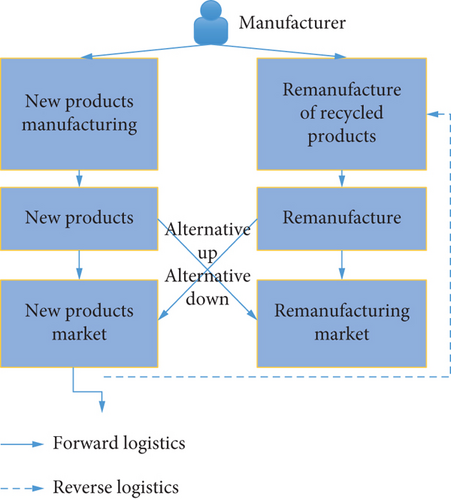
The model in this chapter considers the situation where the manufacturer produces new products at the same time and remanufactures products by recycling waste products/problem products. For the two products, although new products are generally slightly better than remanufactured products in terms of functions and service life, remanufactured products have certain price advantages compared to new products, so new products and remanufactured products are mutually replaceable. That is, when there is a shortage of goods in the demand market for reproducts, new products can enter the reproduct market to replace them with demand when the supply exceeds demand. Similarly, when new products are in short supply, remanufactured products can supplement the demand market for new products with sufficient inventory. Through the mutual demand substitution among products, it can meet the market demand of consumers and make up for the total profit loss of the manufacturer due to product shortage or surplus inventory. The manufacturer’s production model with upward/downward substitution is shown in Figure 8.
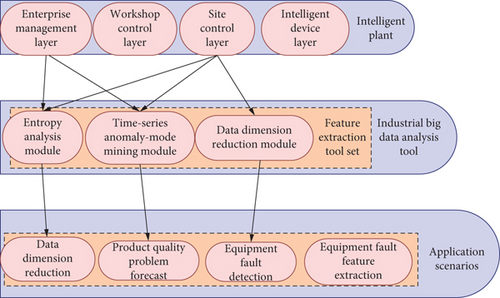
As a specific product of Industry 4.0, the core of smart factory lies in whether CPS technology can be deeply integrated with enterprise information system to realize the integration of workshop equipment, people, and materials and other entities with advanced information technology. Moreover, it comprehensively uses big data analysis methods and means to complete the conversion of data to information to enhance the value of data and assist enterprise management and decision-making. Therefore, the construction and normal operation of smart factories must increase data utilization, use big data methods or tools to achieve value creation, and enhance corporate competitiveness. Based on this, this article preliminarily studies the feature extraction tool set in the industrial big data analysis tools for smart factories and improves the commonly used mining algorithms to cope with some of the problems faced in the application of smart factories. The overall framework is shown in Figure 9:
The model constructed in this paper can be applied to the personalized customization of product life cycle and can help enterprises make comprehensive decision-making. In particular, it can perform intelligent decision-making analysis under the background of Industry 4.0. On this basis, this article evaluates the effects of this article’s intelligent model from production data processing and enterprise comprehensive decision-making through experimental research and obtains the results shown in Table 1 and Figure 10.
| No. | Data processing | Decision effect | NO | Data processing | Decision effect |
|---|---|---|---|---|---|
| 1 | 89.15 | 79.01 | 19 | 93.02 | 78.26 |
| 2 | 93.88 | 83.50 | 20 | 86.63 | 82.24 |
| 3 | 87.01 | 83.39 | 21 | 92.28 | 72.54 |
| 4 | 91.28 | 75.47 | 22 | 91.13 | 76.71 |
| 5 | 92.72 | 86.75 | 23 | 87.88 | 87.30 |
| 6 | 89.11 | 80.73 | 24 | 89.63 | 81.80 |
| 7 | 87.75 | 76.03 | 25 | 88.20 | 76.26 |
| 8 | 88.91 | 84.02 | 26 | 93.71 | 83.58 |
| 9 | 93.80 | 75.50 | 27 | 87.43 | 77.13 |
| 10 | 86.08 | 80.84 | 28 | 90.05 | 82.38 |
| 11 | 91.83 | 71.95 | 29 | 89.83 | 77.09 |
| 12 | 91.68 | 85.97 | 30 | 86.11 | 79.02 |
| 13 | 93.64 | 80.88 | 31 | 93.40 | 73.38 |
| 14 | 86.82 | 82.36 | 32 | 90.12 | 73.14 |
| 15 | 86.62 | 83.30 | 33 | 87.80 | 83.07 |
| 16 | 86.59 | 83.19 | 34 | 89.43 | 83.17 |
| 17 | 91.17 | 71.99 | 35 | 86.42 | 72.24 |
| 18 | 92.47 | 71.67 | 36 | 90.96 | 74.75 |
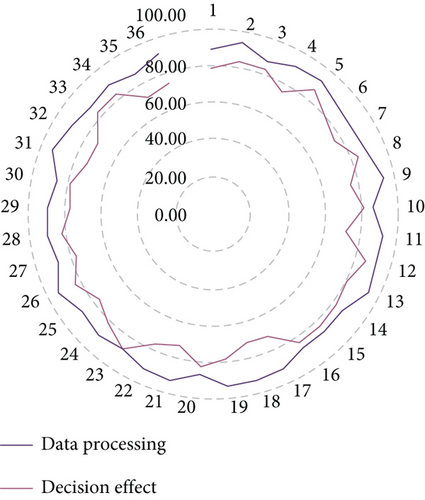
It can be seen from the above research that the decision-making system proposed in this article can play an important role in the comprehensive decision-making of Industry 4.0 enterprises, and this decision-making can be spread throughout the entire product life cycle.
5. Conclusion
Decision-making is to achieve a certain goal. Decision-makers use scientific methods and means to select a more satisfactory plan from the many decision-making plans they have designed. “Management is decision-making,” which means that the daily management activities of enterprises are actually in the process of making decisions. Innovative enterprises need to analyze and measure potential innovation opportunities to measure whether the potential opportunities are worth taking advantage of. This paper constructs an Industry 4.0 virtual enterprise comprehensive decision analysis system that takes into account the product life cycle personalized customization model. Moreover, this article preliminarily studies the feature extraction tool set in the industrial big data analysis tools for smart factories and improves the commonly used mining algorithms to cope with some of the problems faced in the application of smart factories. The experimental research results show that the decision-making system proposed in this paper can play an important role in the comprehensive decision-making of Industry 4.0 enterprises, and this decision-making can be spread throughout the entire life cycle of the product.
Conflicts of Interest
The author declares no competing interests.
Acknowledgments
The project was supported by the National Social Science Fund of China (Grant No. 14CGL069) and the Foundation of Henan Educational Committee (Grant No. 2021JGLX101).
Open Research
Data Availability
The labeled dataset used to support the findings of this study are available from the corresponding author upon request.


