Analysis of Spectroscopic, Morphological Characterization and Interaction of Dye Molecules for the Surface Modification of TiB2 Nanoparticles
Abstract
Nanoparticles of titanium diboride (TiB2) coated with a conductive polymer and subjected to an oxidizing agent was carried out in this research. TiB2 nanoparticles coated with polypyrrole (PPy) were studied using XRD and TEM techniques. Nitrogen adsorption and desorption properties of nanoparticles are covered with modified polypyrrole to understand better the surface zone, structural features, and pore geometries of the nanoparticles. The water-based hazardous anionic Congo red (CR) dye was removed using polypyrrole-coated titanium diboride (PPy@TiB2) nanoparticles. Numerous cutting-edge experimental techniques, including FTIR, FE-SEM, EDXS, and element mapping analysis, were used to confirm the CR color’s adhesion to the PPy@TiB2 nanoadsorbent study. While conducting batch experiments, coated TiB2 nanoadsorbents with polypyrrole enhanced the adsorption behaviour. One of the factors evaluated in the adsorption tests was pH; another was contact time, and a third was dose. At pH = 4, 98.75% of Congo red dye was detached using 60 mg of PPy-coated TiB2 nanoadsorbent. Several sorption-desorption cycles were performed on this nanoadsorbent to determine its reusability. An excellent adsorption capacity for water treatment is reported in PPy-coated TiB2 nanoadsorbent.
1. Introduction
Every continent has a textile industry, and this sector contributes significantly to global economic growth [1]. Due to the coloring, printing, and washing processes carried without the appropriate pretreatment measures, textile wastewater is increasingly dyed. There are various concentrations of colored components in textile wastewater, which contribute to its pollution [2]. Therefore, textile effluent is clean since it has a high concentration of pigment molecules. Due to CR’s ability to convert to benzidine, the anionic synthetic diazo dye is carcinogenic. Because of its aromatic structure, CR dye is both physiochemically and thermally stable [3]. CR’s color changes depending on the pH, turning red at a pH of less than 5. Toxic to humans and animals, industrial effluent contains significant levels of COD and BOD, suspended particles and colloids, salts, and some other hard materials [4]. To deal with textile wastewater treatment issues, energy, water, and chemicals are required. There are numerous advantages to adsorption over other water treatment methods that are investigated as a viable option [5].
Various adsorbent forms are tried, including polar and nonpolar adsorbents. High surface-area adsorbent materials have effectively extracted different dye compounds from textile effluent. Various essential uses for nanomaterials have also been demonstrated [6–8]. Nanoparticles of titanium diboride (TiB2) were employed in multiple material science applications: high-performance solar cells and photocatalytic devices using TiB2-based nanotubes or nanoflowers, TiB2 nanoparticles, and a PVDF membrane covered with a TiB2 layer amplified for photocatalytic wastewater purification [9–11]. A polymer matrix alters the material’s properties, such as combining polypropylene, polypyrrole, polyamide, or polylactic acid. Environmental scientists have been considering polymeric nanoadsorbents based on polypyrrole for several years.
The polymer has many properties that make it an ideal solution for water pollution problems [12]. Scientists have found that polypyrrole-based nanocomposites effectively clean the environment of heavy metal ions and radioactive pollutants, pigments, chemical compounds, and pesticides. Recent studies highlight photovoltaic efficiency, optical features, degradation capacity of photocatalytic materials, physical characteristics, and electric characteristics [13–15]. The chemical polymerization production of polypyrrole-coated titanium diboride (PPy@TiB2) has positively affected the environment. In the adsorption investigation, several traits and parameters were analyzed. Scientists have used the produced PPy@TiB2 nanomaterial for wastewater dye removal due to its excellent performance and ease of reusing [16].
2. Experimentation
2.1. Methods and Materials
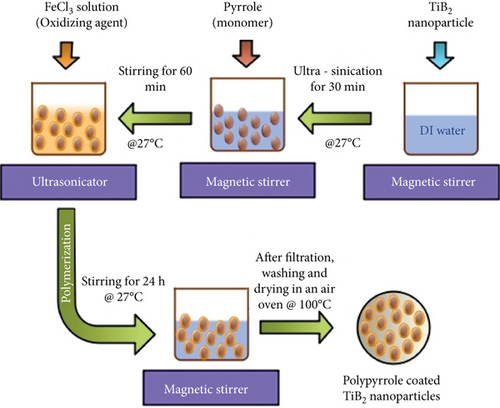
In the presence of a PPy monomer, a chemical polymerization approach is used to create a PPy@TiB2 nanoadsorbent. There were 2 mL of pyrrole monomer and 30 minutes of ultrasonication at 27°C to prepare TiB2 nanoparticles. The pyrrole monomer was allowed to adsorb on the TiB2 nanoparticles’ surfaces by swirling the dispersion for 60 minutes at 27°C [17, 18]. Iron was added to the TiB2 dispersion as an oxidizing agent to polymerize the pyrrole on the nanoparticles’ surfaces. The mixture was stirred for an additional 24 hours at 27°C using an electric stirrer. A four-hour oven drying at 100°C removed the contaminants and unreacted oxidants after cleaning the PPy@TiB2 nanoadsorbent with deionized water and acetone after polymerization. An illustration of TiB2 nanoparticles coated with polypyrrole is indicated in Figure 1.
2.2. Characterization
PPy@TiB2 nanoadsorbent including TEM, HR-TEM, and fast Fourier transform (FFT) were synthesized. TESCAN FE-SEM, elemental mapping, and EDX analyze the PPy@TiB2 nanoadsorbent earlier and the subsequent adsorption. X-ray diffraction measurements were determined using Cu Kα radiation with a 10° to 90° (2Ɵ) wavelength range [19]. The nitrogen adsorption technique measures pore size distributions and particular surface area. Using an FTIR spectrometer, it was necessary to conduct pre- and postadsorption studies on the nanoadsorbent, nano-PPy@TiB2 [20].
2.3. Adsorption Studies
Ci starting concentration of Congo red color
Cf CR dye’s ending concentration
3. Results and Discussions
3.1. Properties of PPy@TiB2 Nanoparticles
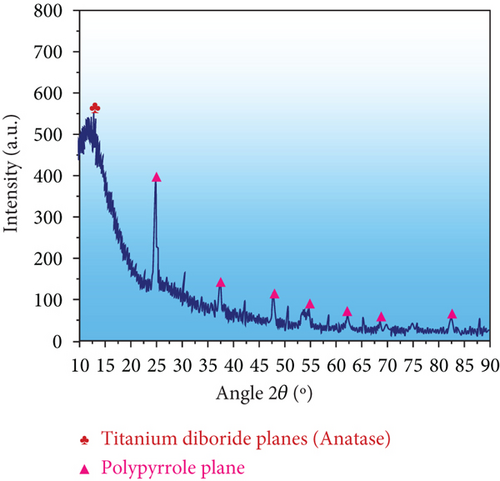
Investigation of PPy@TiB2 nanocrystalline adsorbent structure was done using XRD. As-synthesized PPy@TiB2 is indicated in Figure 2(a). Results showed that TiB2 nanoparticles in composite form with PPy polymer were anatase crystalline. There were no visible phases other than TiB2 in Figure 2(a), which verify the XRD pattern of its different stages (rutile and brookite). It discovered that PPy@TiB2 nanocomposite reduced the crystalline phase of TiB2 and PPy’s amorphous nature by interacting with TiB2. XRD data suggest that the surface morphology of TiB2 nanoparticles with conducting polymer PPy was successful, as demonstrated by these results [25, 26]. Furthermore, TEM and HR-TEM analysis strongly support these findings.
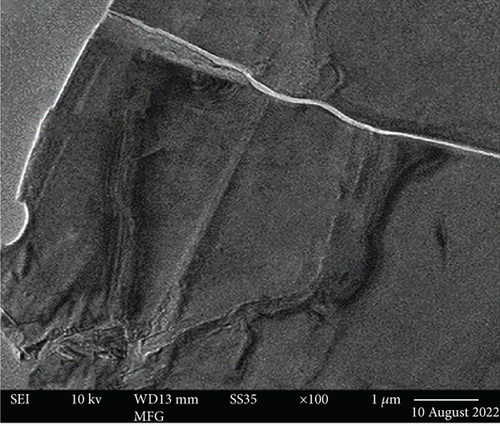
Yet, Figure 2(b) shows the TEM patterns of the synthesized PPy@TiB2. The TEM image of the synthesized PPy@TiB2 showed that only the TiB2 facet had PPy polymer deposited on it, regardless of the other aspect [27]. A patch of unilluminated PPy polymer showed TiB2 nanoparticles scattered everywhere, while PPy polymer granules with TiB2 nanoparticles interacted tightly. TiB2’s high contrast made it distinct from PPy, which has lower contrast (Figure 2(b)). This nanoadsorbent formed using TiB2 in the TEM image inset clearly showed the crystalline structure of the TiB2 [28]. High resolution-TEM and FFT confirm that TiB2 nanocomposite PPy@TiB2 nanocomposite had an anatase crystalline phase as shown in supplemental Figures 3(a) and 3(b).
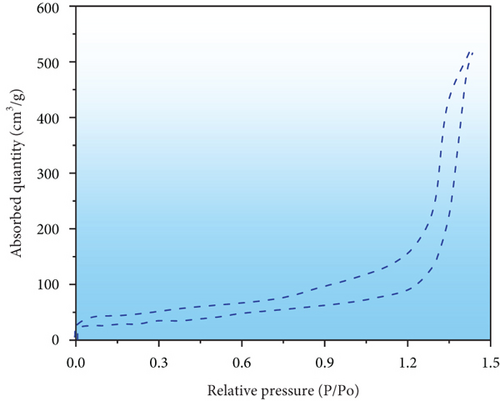
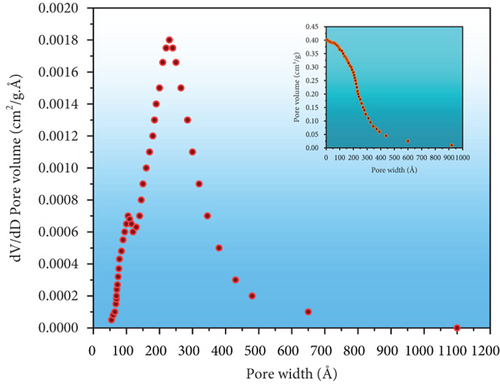
The surface, structural characteristics, and pore geometries of the PPy@TiB2 nanospecific adsorbent were determined by the isotherm of nitrogen attachment shown in Figure 3(a). It reveals that saturation is observed at higher pressures, with a gradual increase in adsorption up to roughly 0.70 relative pressure (P/Po) [29]. Because of this, mesoporous adsorbents have a unique isotherm. The average pore diameters of the nanoadsorbent with 62.27 m2/g surface area are 245.307 Å for adsorption and 216.698 Å for desorption using the nitrogen adsorption-desorption isotherm and the BJH technique [30]. In Figure 3(b), the average BET pore sizes for adsorption and desorption were 232.0041 Å and 247.2938 Å, respectively. According to IUPAC guidelines, mesoporous materials have pore diameters between 20 and 500 nm. Thus, the PPy@TiB2 nanoadsorbent favours the mesoporous character of the material because of its pore sizes. Desorption is showed to be possible in Figure 3(a), where the desorption sum pore volume (0.385022 cm3/gram) is greater than the adsorption sum pore volume (0.361217 cm3/gram) at P/Po = 0.982. It shows that reversible desorption is conceivable. The regeneration results confirmed this tendency even more conclusively. A mesopore capillary condensation is present in the isotherm, in accordance with IUPAC’s classifications of physisorption isotherm/hysteresis loops [31].
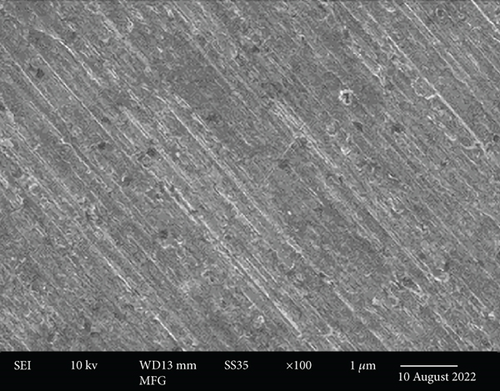
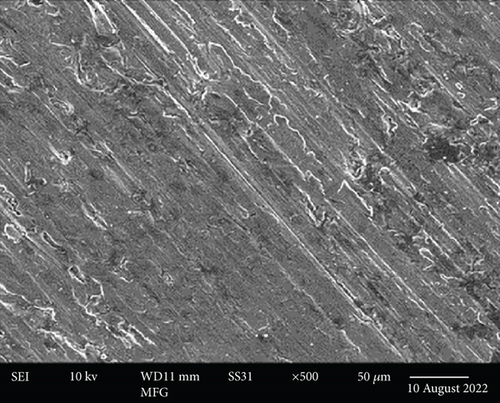
These images were taken at three different magnification levels and show the material’s granular structure. As the magnification increased, the brightness decreased, indicating that the brightest particles were on the surface while the dullest particles were discovered deep within the layer (Figures 4(a) and 4(b)). It appeared like the character was uniform and smooth. Nanoparticles prepared before CR adsorption became more dispersed and bulkier in their microstructures.
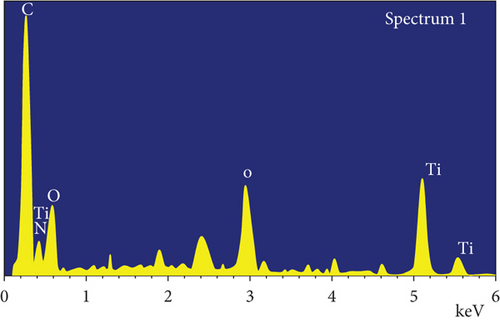
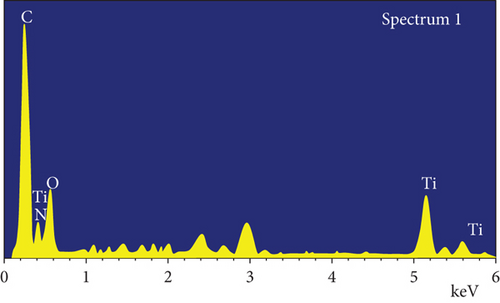
Additionally, the components in the adsorbed PPy@TiB2 were found out by FESEM-EDX analysis. As depicted in Figure 5, pure and CR-adsorbed PPy@TiB2 samples have different elemental compositions. In the EDX spectra, carbon, oxygen, nitrogen, and titanium (Ti) are all visible (Figure 5(a)). Because of their relative atomic weights of 50.75 and 28.21%, C and O atoms may have an effect on PPy@TiB2’s adsorption to CR dye molecules. In Figure 5(b), Na, C, and O atoms with high atomic masses indicate as evidence that CR molecules adsorb onto PPy@TiB2. Elements in PPy@TiB2 and CR-adsorbed PPy@TiB2 were studied further by an elemental mapping experiment [32, 33]. Before and after CR dye adsorption on PPy@TiB2, the elemental mapping is indicated in Figure 6. In the PPy@TiB2 nanoadsorbent, carbon, oxygen, nitrogen, and titanium were all evenly distributed. C, O, and Na distributions were validated by exposing the nanoadsorbent PPy@TiB2 nanoadsorbent to CR molecules [32, 33].


3.2. Behaviour of Adsorption
3.2.1. Impact of pH
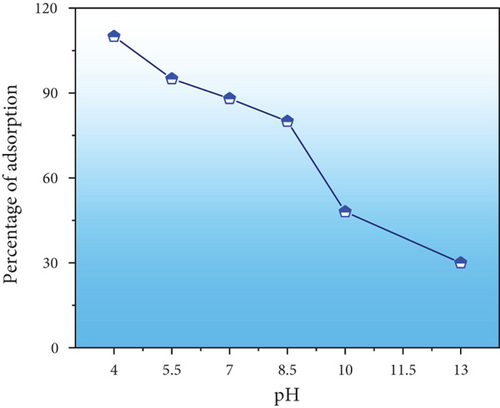
When the aqueous phase’s pH alters, it alters both the binding sites and ionization processes in this experiment [34, 35]. Figure 7(a) illustrates the percentage of Congo red adsorption by PPy@TiB2 at different pH values (4.0, 5.5, 7, 8.5, 10.0, and 13.0). The starting pH level of 4.0 (98.75%) had the highest adsorption rate, which decreased as the pH increased. Positively charged PPy@TiB2 surface was inhibited by electrostatic contact with negatively charged CR (due to the presence of two –SO3 groups) [36]. Both Congo red and PPy@TiB2 became negatively charged as the pH increased and the adsorption percentage reduced [37].
3.2.2. Effect of Adsorbent Dose
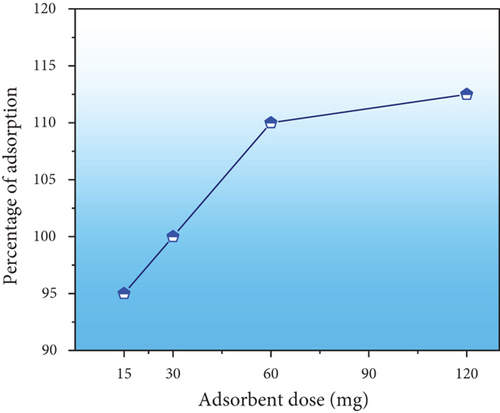
The amount of PPy@TiB2 used had a beneficial impact on the adsorption percentage (Figure 7(b)). The percentage of adsorption rate was increased to obtain the equilibrium state of maximum adsorption [38]. Adsorption on the PPy@TiB2 surface increases when the dose increases as the number of adsorption sites increases. The optimum PPy@TiB2 amount attains to be 0.05 gm due to this study.
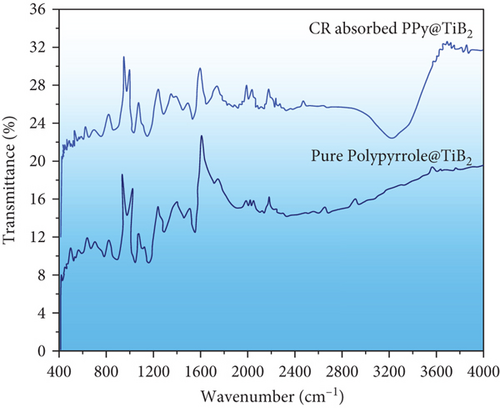
The AT-FTIR spectrum of pure PPy@TiB2 and that of CR-adsorbed PPy@TiB2 is indicated in Figure 8. Band assignments and wavenumbers are shown in Table 1 for the two samples, including the pure TiB2 and TiB2+CR-adsorbed PPy@TiB2 FTIR bands. Most peaks experienced a minor shift to the lower wavenumbers after CR dye adsorbs on PPy@TiB2 [39]. Therefore, these shifting peak values make it clear that the CR dye was successfully adsorbing onto PPy@TiB2.
| FTIR peaks of PPy@TiB2 (wavenumber cm-1) | Peaks role | FTIR peaks of Congo red-adsorped PPy@TiB2 (wavenumber cm-1) | Peaks role |
|---|---|---|---|
| 1537.64 | Carbon-carbon pyrrole bond stretching vibration | 1521.56 | Carbon-carbon pyrrole bond stretching vibration |
| 1447.79 | Conjugated C-N band for stretching | 1436.68 | Conjugated C-N band for stretching |
| 1291.17 | A band of conjugated deformation in the plane of C-H | 1272.28 | A band of conjugated deformation in the plane of C-H |
| 1142.18 | Conjugated carbon-nitrogen stretching vibrations | 1136.32 | Conjugated carbon-nitrogen stretching vibrations |
| 1034.13 | Nitrogen-hydrogen in the planar deformation band | 1025.04 | Nitrogen-hydrogen in the planar deformation band |
| 992.25, 882.29, 780.08 | Deformations of the pyrrole ring G-H in and out of the plane | 988.32, 860.58, 754.42 | Deformations of the pyrrole ring G-H in and out of the plane |
| 664.89 | Characteristic peak of TiB2 | 649.33 | Characteristic peak of TiB2 |
| 478.71 | Stretching mode for the titanium-boride bond | 477.51 | Stretching mode for the titanium-boride bond |
3.2.3. Effect of Adsorption Time
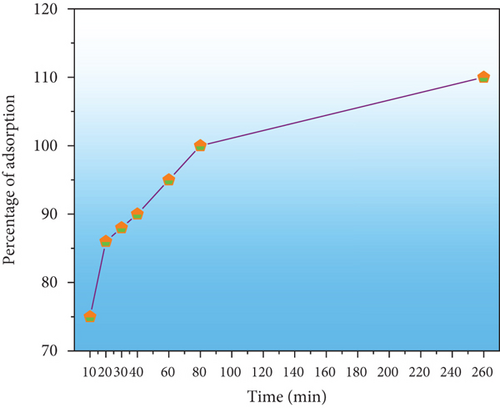
In adsorption experiments, adsorption time is critical. CR adsorption is illustrated in various time intervals in Figure 9(a). During the first 30 minutes of the investigation, the percentage of CR slowly adsorbing into the PPy@TiB2 grew dramatically, reaching a maximum (110%) after 260 minutes. CR adsorption was stable, indicating that it attains the equilibrium phase. For the nanoadsorbent PPy@TiB2 nanoadsorbent, 260 minutes show the optimal duration for carbon dioxide adsorption. When PPy@TiB2 is adsorbed, the diffusion process is evidenced by the gradual rise in the adsorbed percentage [40].
3.2.4. Regeneration Study
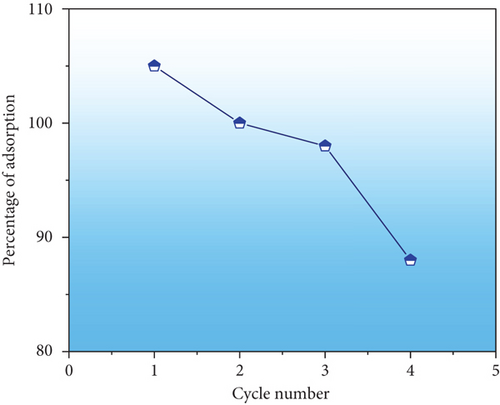
The exhausted adsorbent (Congo red-adsorbed PPy@TiB2) was evaluated on how well it can revitalize in a regeneration study [41]. It is shown in Figure 9(b) that NaOH was used as a desorbing agent for four cycles. This PPy@TiB2 nevertheless showed outstanding regeneration efficacy with an adsorption decrease from 98.75 to 97% in Figure 9(b). PPy@TiB2 proves to be a valuable and economical material for removing CR. The reproducibility of PPy@TiB2 for eliminating CR from textile wastewater was established.
3.2.5. Adsorption Mechanism
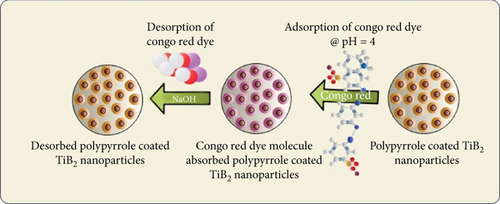
The dynamic, active sites on the PPy@TiB2 surface allowed CR to adsorb on it. A schematic diagram of CR dye molecule adsorption and desorption onto PPy@TiB2 nanoadsorbent is indicated in Figure 10. Chemical polymerization was employed to synthesize nanocomposite using TiB2 nanoparticles. Dispersed TiB2 nanoparticles were used to adsorb the Polypyrrole monomer. Then, the pyrrole-adsorbed TiB2 dispersal is treated with the FeCl3 solution as an oxidizing agent. Finally, CR adsorption was determined using the polymerized PPy@TiB2 nanoadsorbent. Carbo-oxygen-nitrogen-titanium elements make up its surface. Adsorption of textile wastewater is made more accessible with the final polymer form’s increased surface area and chemical functionality. This positive charge is created by protonating the PPy@TiB2 surface functional groups at pH = 4. This positive charge is used to interact with CR’s negative −SO3 groups. Due to the negative CR’s electrostatic attraction to the TiB2 surface, the adsorption is reduced as pH rises, whereas deprotonation caused a decrease in surface charge density.
4. Conclusion
Chemical polymerization with pyrrole (monomer) and ferric chloride successfully converted tiny titanium diboride nanoparticles (oxidizing agent). Polypyrrole originates on the surface of TiB2 nanocomposites. PPy@TiB2 nanoparticles were formed, and CR molecules could adhere to them, according to spectroscopic, structural, and morphological studies. It discovered that pH = 4260 minutes of contact hours, 60 mg of adsorbent, and a Congo red dye concentration of 10 ppm were the ideal adsorption conditions. After four cycles, a nanoadsorbent could maintain 90% of the CR color. The outcomes show that polypyrrole-coated titanium oxide nanoparticles are an effective treatment option for colored wastewater containing dye.
Conflicts of Interest
The authors declare that they have no conflicts of interest.
Open Research
Data Availability
All authors confirmed that all necessary data are available in the manuscript.


