Research on Hysteretic Models for Prestressed and Non-Prestressed Steel Reinforced Concrete Frames
Abstract
The beam-column fibre model is used to simulate the entire hysteretic process of the prestressed and non-prestressed steel reinforced concrete frame, and the results are compared with the test results. Based on the analysis of a large number of parameters, the hysteretic curve characteristics of this kind of composite frame are discussed, and the load-displacement hysteretic models of single-storey and single-span composite frame are established. The models can comprehensively consider the influence of axial compression ratio and column slenderness ratio and can predict the hysteretic behaviour of this kind of composite frame under horizontal loads. The load-displacement hysteretic models are consistent with the numerical simulation results. Relevant research can provide reference for simplifying the elastic-plastic dynamic analysis of structures.
1. Introduction
Prestressed steel reinforced concrete structures have the advantages of high bearing capacity and good seismic performance, which have been widely used in practical engineering, especially in the super-span and out-jacketing frame structure [1–4]. However, due to the uneven distribution of lateral stiffness and bearing capacity along the height of the out-jacketing building, it is necessary to have a comprehensive grasp of its overall seismic performance under rare earthquakes [5, 6]. As mathematical models of the relationship between restoring force and deformation obtained after abstraction and simplification, the hysteretic models can better reflect the seismic performance of structures or components and have been extensively studied.
At present, at the level of components, Xue et al. [7] established the M-φ hysteretic models of prestressed steel reinforced concrete beams. Zheng et al. [8] proposed the M-φ hysteretic models of angle-steel concrete columns based on the experimental results and numerical simulations. At the level of frame structure, Wang et al. [9] built a practical hysteretic model for concrete filled steel tubular frame, which can effectively predict the mechanical behaviour of the frame. Hu et al. [10] presented the hysteretic models of steel frames infilled with the reinforced concrete deep beam with the skeleton curves as a three-fold line based on the test results. Wang et al. [11] developed a simplified hysteretic model based on the analysis of experimental results, which can better describe the hysteretic performance of the frame under repeated loads. It can be seen that almost of the above studies involve the hysteretic characteristics of the combined frame proposed in this paper, and the idea and method of establishing the hysteretic model provide an important reference basis for the study in this paper.
For this reason, a numerical model of a single-storey and single-span frame was proposed for prestressed and non-prestressed steel reinforced concrete frames, which was compared with the tested results. Through the analysis of a large number of parameters by using the numerical model, the characteristics of hysteretic curves of this type of the composite frame were analysed, and the horizontal load-displacement hysteresis models of this type of single-storey and single-span composite frame were obtained by statistical regression and compared with the results of numerical calculation, which provided a reasonable basis for the elastoplastic dynamic analysis of simplified structure.
2. Numerical Models
2.1. The Establishment of the Models
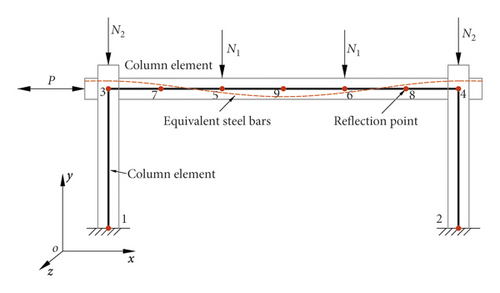
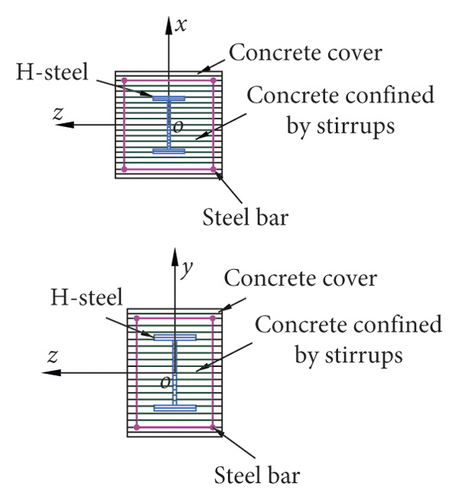
In this paper, a numerical analysis model of a single-storey and single-span frame was established for both prestressed and non-prestressed steel reinforced concrete frame structures based on the seismic analysis platform OpenSees [12]. The prestressed tendons in the frame beams were arranged in the form of three-segment parabola and each cross section had a certain variation, so the lumped plastic hinge fibre element named Beam with Hinges Element was used to simulate the beams. Since the cross section was the same in the axial direction for frame columns, the distributed plastic hinges beam-column fibre element named Nonlinear Beam Column Element was adopted in this paper. Reference [13] describes the two-stage principle of prestressing: in the first stage, the concentrate forces and moments at two beam ends and the equivalent load on beam between joints are conceived as external loads when effective prestressing stress is built though tensioning the tendons; in the second stage, the redundant strength exceeding the effective prestressing stress in tendons is used to resist the additional external loads, and thus the tendons with redundant strength could be thought as materials. The node arrangement and section division of the prestressed steel concrete frame model as well as loading patterns are presented in Figure 1. In the figure, the frame beam is divided into 6 elements according to the prestressed equivalent load, the vertical load distribution, and the midspan point. The nodes were, respectively, set at the beam end, the middle span, the point of inflection for prestressed reinforcement, and the vertical concentrated load points. Each frame column was divided into one element, and the bottom of the frame column was rigidly connected to the foundation. The horizontal cyclic load P was imposed on node 3 at the left end of the frame beam, the vertical concentrated forces N1 were applied on nodes 3 and 4, and concentrated loads N2 were exerted on nodes 5 and 6 on the beam. When the cross-sectional area of the prestressed tendons was zero, the model can be transformed into a non-prestressed steel reinforced concrete frame. For the beams and columns, the cross-sectional concrete was divided into two portions due to the confinement effect of stirrups, which were concrete cover and concrete confined by stirrups. In addition, the connection of beams and columns in the numerical model is rigidly connected.
3. Material Constitutive Relationship
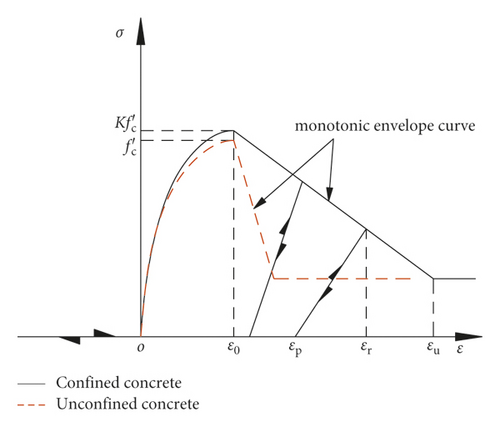
The concrete adopted the model Concrete01 provided in OpenSees (see Figure 2). In the figure, fc′ is the compressive strength of concrete cylinder, K is the coefficient of strength increase due to constraint consideration, ε0 is the peak strain, εp is the compressive strain after unloading, εr is the compressive strain at the unloading point, and εu is the ultimate compressive strain. No influence of concrete under tension was considered in this model, and the stress-strain relationship of uniaxial compression was from the Kent–Park model modified by Scott [14–16]. The hysteretic rule of Concrete01 model was based on the hysteretic model provided by Karsan and Jirsa. To simplify the analysis, the confinement effect of the steel embedded in the beam and column was not considered in the modelling. Therefore, beam and column sections were only divided into concrete core and concrete cover without stirrup confinement, and confined and unconfined concrete models were adopted, respectively.
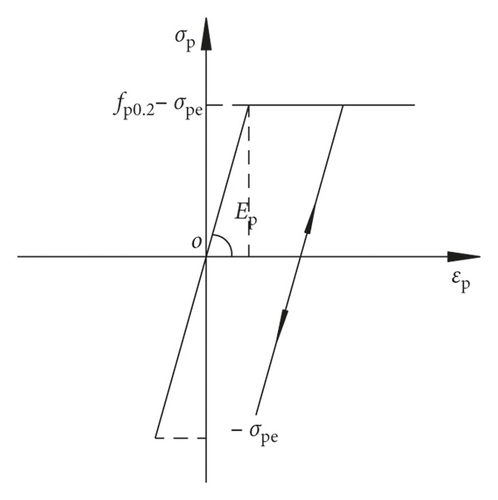
The steel adopted the steel02 model in OpenSees, which was a bilinear kinematic hardening model considering the Bauschinger effect. The prestressed reinforcement adopted the Elastic Perfectly Plastic Material model in OpenSees. According to the two-stage principle of prestressing, the residual strength of the prestressed tendons took the stress-strain relationship displayed in Figure 3, and unloading and reloading were carried out along a straight line, after the effective prestress was deducted from the second-stage prestressed tendons of the external load. In the figure, fp0.2 is the conditional yield strength, σpe is the effective prestress of prestressed reinforcement, and Ep is the initial stiffness.
3.1. Test Verification
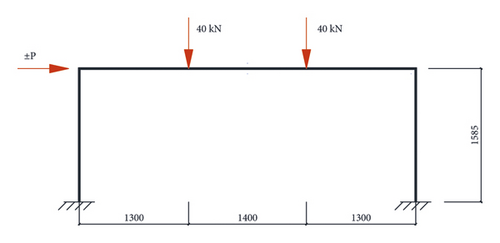
Fu et al. [3] fabricated one specimen of ordinary steel reinforced concrete frame and one of prestressed steel reinforced concrete frame according to the scale of 1/3 on the basis of practical engineering. The two specimens were named SRCF and PSRCF, respectively, and the reinforcements are described in Figures 4(a) and 4(b). Figure 4(c) gives the loading patterns, where two vertical concentrate loads of 40 kN were imposed on the beam, and a horizontal cyclic load ± P was applied at left end of the beam. The two frame specimens were designed according to “strong column and weak beam” and “strong joints and weak members.” The column cross section dimensions of the two frame specimens were the same, both were 230 mm × 230 mm, and welded H-shaped steel HN130 × 110 × 4×10 was arranged in the columns. The cross section size of the frame beam of the specimen SRCF was 150 mm × 230 mm, and the size of the H-shaped steel placed in the centre was HN130 × 50 × 4×14. The frame beam section size of the prestressed specimen PSRCF was 150 mm × 230 mm, and the size of the embedded welded H-shaped steel was HN130 × 50 × 4 × 8. In order to facilitate the arrangement of the prestressed tendons, the section steel web was offset on one side, and a steel strand with grade of 1860 and a diameter of 12.7 mm was taken as the prestressed reinforcement. By measurement, the tension control stress was 1395 MPa and the actual effective prestress was 970 MPa.
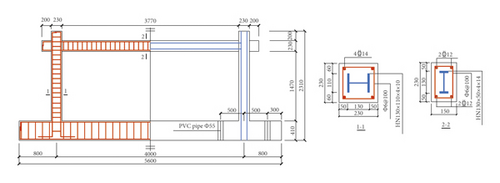
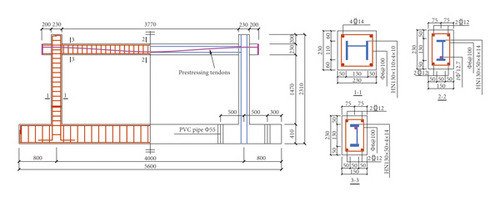
The strength grade of stirrups of beams and columns was HPB235, while the strength grade of longitudinal reinforcements was HRB400 and the structural steels were welded with Q235 steel plates. The specimens were poured on-site and made of commercial fine stone concrete. The measured compressive strength fcu of concrete cube was 41 MPa, and the modulus of elasticity Ec was 3.17 × 10⁴ MPa. The tested yield strength fy of  25,
25,  14,
14,  12, and
  6 steel bars was 412 MPa, 398 MPa, 487 MPa, and 305 MPa, respectively. In the test, the horizontal load and displacement were measured. The hysteretic properties of two steel concrete frame specimens under low horizontal cyclic loading were studied, and the hysteretic curves, skeleton curves, and energy dissipation capacities of the specimens were investigated.
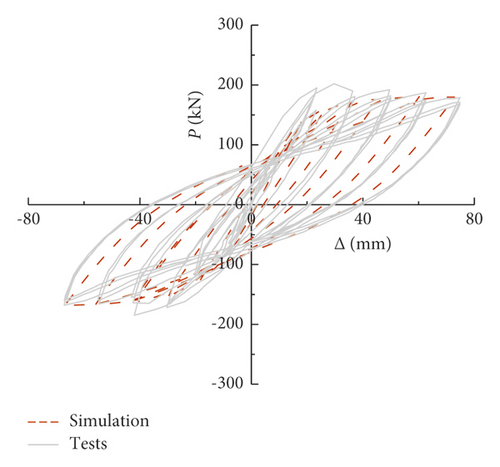
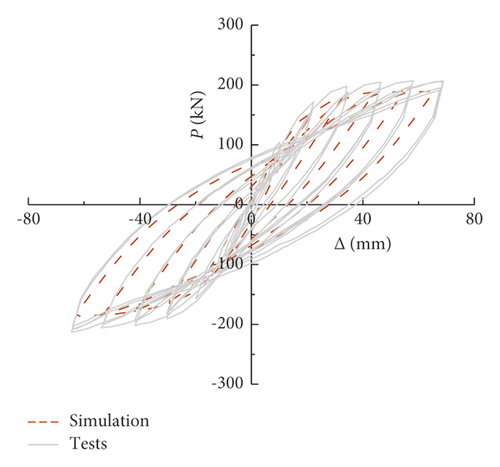
The comparison between the numerical calculation and the experimental hysteresis curves was described (see Figure 5). It can be seen that the calculated curves and the experimental curves generally agree with each other in bearing capacity, stiffness degradation, and hysteresis loop shape, reflecting the correctness of the model built.
4. Hysteresis Curve Characteristics
4.1. Impact Parameters
In order to further study the hysteretic characteristics of prestressed and non-prestressed steel reinforced concrete frames, parameter analysis was conducted to observe the main influence factors on the seismic performance in this paper, which include the column slenderness ratio (β), axial compression ratio (n0), compressive strength of concrete cube (fcu), sectional resistance moment of shaped steel in beams and columns (Wss-c and Wss-b), ratio of longitudinal reinforcement in beams and columns (ρs-b and ρs-c), yield strength of shaped steel in beams and columns (fss-b and fss-c), yield strength of longitudinal bars in beams and columns (fy-b and fy-c), and prestressing degree (λ).
The hysteretic analysis parameters of prestressed and non-prestressed steel reinforced concrete frames are presented in Table 1.
| PSRCF | SRCF | |||
|---|---|---|---|---|
| Parameter category | Parameter change range | Remarks | Parameter′s range | Remarks |
| Column slenderness ratio β | 6; 8; 10; 12 | Corresponding column height: 1500 mm; 2000 mm; 2500 mm; 3000 mm | 6; 8; 10; 12 | Corresponding column height: 1500 mm; 2000 mm; 2500 mm; 3000 mm |
| Axial compression ratio n0 | 0.1; 0.2; …; 0.8 | — | 0.1; 0.2; …; 0.8 | — |
| Concrete strength fcu (MPa) | 30, 40, 50 | — | 30, 40, 50 | — |
| Sectional resistance moment of shaped steel in beam Wss-b (mm3) | 82.126, 64.521 | Corresponding H-shaped steel: H180 × 50 × 4×8; H150 × 50 × 4×8 | 82.126, 64.521 | Corresponding H-shaped steel: H180 × 50 × 4×8; H150 × 50 × 4×8 |
| Sectional resistance moment of shaped steel in column Wss-c (mm3) | 256.281, 206.098 | H180 × 150 × 4 × 10 H150 × 150 × 4×10 | 256.281, 206.098 | H180 × 150 × 4 × 10 H150 × 150 × 4×10 |
| Reinforcement ratio of longitudinal steel bars in beam ρs-b | 0.785%, 1.131%, 1.539% | 4 10, 4 10, 4 12, 4 12, 4 14 14 |
0.785%, 1.131%, 1.539% | 4 10, 4 10, 4 12, 4 12, 4 14 14 |
| Reinforcement ratio of longitudinal steel bars in column ρs-c | 0.724%, 0.985%, 1.287% | 4 12, 4 12, 4 14, 4 14, 4 16 16 |
0.724%, 0.985%, 1.287% | 4 12, 4 12, 4 14, 4 14, 4 16 16 |
| Yield strength for shaped steels fss-b and fss-c (MPa) | 235, 345, 390 | Q235, Q345, Q390 | 235, 345, 390 | Q235, Q345, Q390 |
| Yield strength of longitudinal steel bars fy-b and fy-c (MPa) | 300, 335, 400 | HPB300, HRB335, HRB400 | 300, 335, 400 | HPB300, HRB335, HRB400 |
| Prestressed degree λ | 0.31, 0.45, 0.54 | 1 s9.5, 1 s9.5, 1 s12.7, 1 s12.7, 1 s15.2 s15.2 |
— | — |
4.2. Parameter Analysis
- (1)
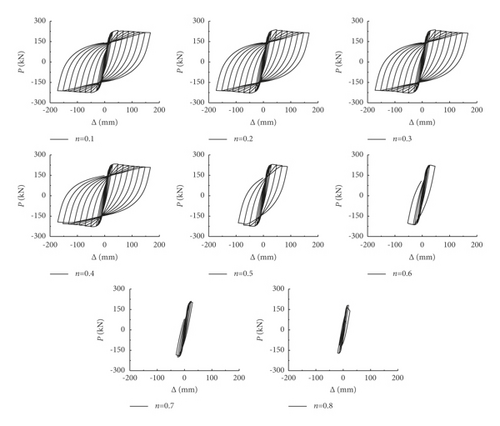
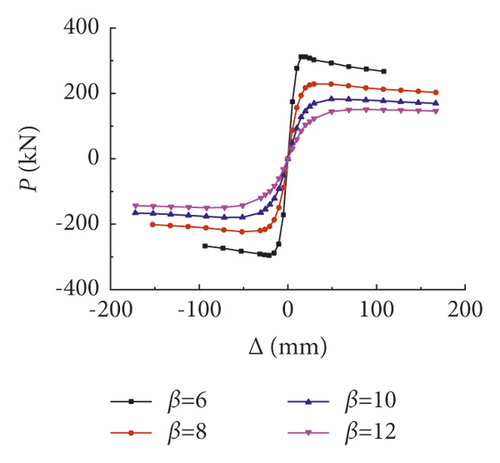
The peak load of prestressed frame decreased with the increase of column slenderness ratio, but the displacement corresponding to the peak load increased; after the skeleton curves reached the peak loads, the descending segment gradually became gentle and the ductility was improved obviously; the hysteretic curves of the frame behaved plump and no pinching occurred.
- (2)
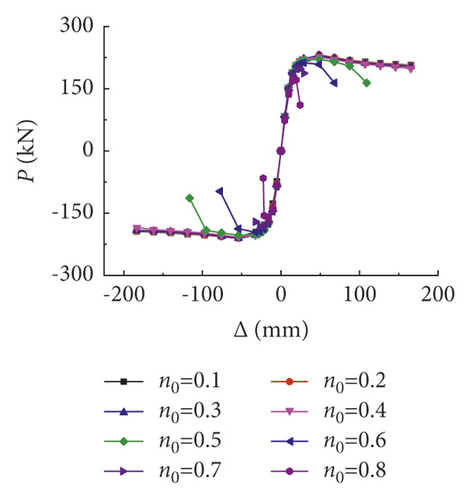
When the axial compression ratio was relatively small, the hysteretic curves were plump and the hysteretic loops had shuttle shape; as the axial compression ratio increased, the horizontal peak load first increased and then decreased; when the axial compression ratio was greater than 0.5, the horizontal displacement at peak load was decreased, and the ductility of the frame was obviously reduced. At this time, the hysteresis loops pinched a certain amount.
- (3)
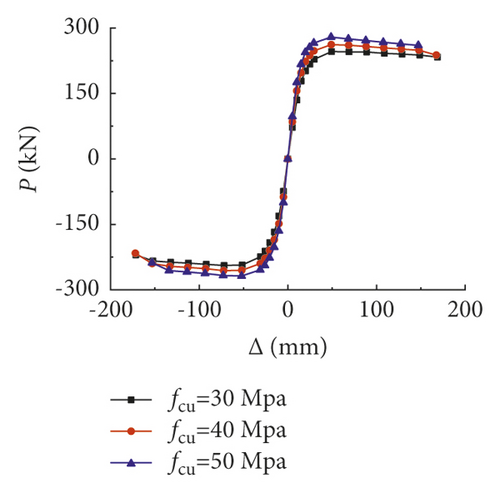
With the increase of cubic concrete strength, the peak loads of the skeleton curves were enhanced, the displacement corresponding to the peak load had almost no changes, and the stiffnesses of the descending segments were the same.
- (4)
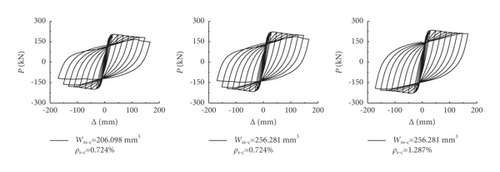
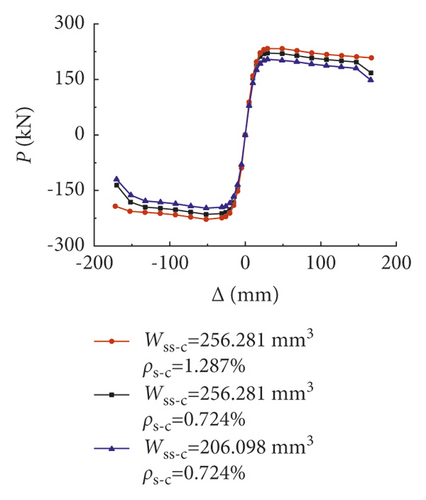
With the increase of the sectional resistance moment of shaped steel and longitudinal reinforcement ratio in columns, the hysteretic curves became fuller, and the horizontal peak load increased, while the displacements corresponding to the peak loads as well as the stiffnesses of descending segments kept almost unchanged.
- (5)
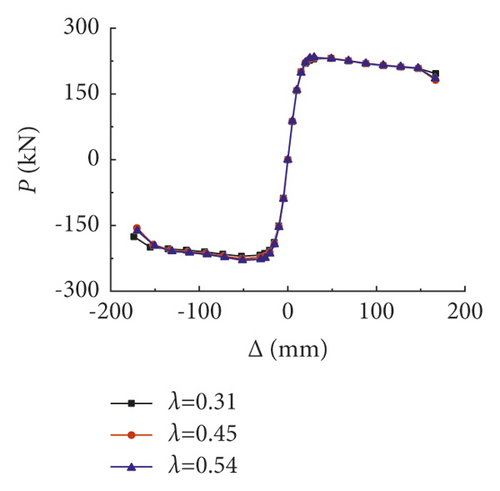
Due to the existence of internal shaped steels, the hysteretic curves with varying prestressed degree showed no apparent distinction. The increase of prestressed degree can only slightly increase the horizontal bearing capacity of the frame; however, it had little influence on the initial stiffness, the displacement at peak load, and the stiffness of the descending branch of the skeleton curves.



| Analytical parameters | Ky (kN/mm) | Δy (mm) | Δm (mm) | Pm (kN) | Kd (kN/mm) |
|---|---|---|---|---|---|
| β = 6 | 27.3 | 10.2 | 19.7 | 312.1 | 0.503 |
| β = 8 | 12.4 | 16.3 | 29.5 | 228.7 | 0.187 |
| β = 10 | 6.5 | 24.7 | 49.2 | 182.8 | 0.110 |
| β = 12 | 3.8 | 34.3 | 88.4 | 150.7 | 0.058 |
| n0 = 0.1 | 9.7 | 20.6 | 48.7 | 226.6 | 0.171 |
| n0 = 0.3 | 11.0 | 18.4 | 48.6 | 230.4 | 0.230 |
| n0 = 0.5 | 12.2 | 16.2 | 48.6 | 221.2 | 0.660 |
| n0 = 0.7 | 12.7 | 14.0 | 24.2 | 197.8 | 2.135 |
| fcu = 30 MPa | 9.1 | 23.6 | 49.4 | 246.0 | 0.106 |
| fcu = 40 MPa | 10.6 | 21.5 | 49.0 | 262.1 | 0.203 |
| fcu = 50 MPa | 12.2 | 20.1 | 48.8 | 279.2 | 0.192 |
| Wss-c = 256.281; ρs-s = 1.287% | 12.2 | 16.0 | 29.5 | 221.2 | 0.263 |
| Wss-c = 268.281; ρs-c = 0.724% | 12.6 | 16.3 | 29.5 | 233.3 | 0.182 |
| Wss-c = 206.098; ρs-c = 0.724% | 11.2 | 16.2 | 29.5 | 204.3 | 0.247 |
| λ = 0.31 | 12.7 | 16.2 | 49.1 | 233.3 | 0.314 |
| λ = 0.45 | 12.6 | 16.2 | 29.5 | 232.1 | 0.270 |
| λ = 0.54 | 12.6 | 16.4 | 29.7 | 233.3 | 0.259 |
Other factors, such as the sectional resistance moment of shaped steel and longitudinal reinforcement ratio in the beam, the yield strength of the shaped steel, and the longitudinal reinforcement both in beams and columns, had the same effects as the sectional resistance moment of shaped steel in the columns. In addition, the influence of various analysis parameters on the hysteretic and skeleton curves for the non-prestressed steel reinforced concrete frame was analogous to that of the prestressed ones, which were omitted here.
4.3. Characteristics of Hysteresis Curves
As can be seen by calculated hysteretic curves, in the initial stage of loading, the hysteretic curves behaved as a straight line passing through the origin in two directions, and the loading and unloading curves coincided, which means that the composite frame is in the elastic working stage; as the loading displacement increased, the skeleton curves gradually deviated from the straight line, and a certain unloading deformation appeared, and as the unloading displacement increases, the unloading stiffness decreases slightly. When the axial compression ratio did not exceed the value of 0.5, the calculated hysteretic curves were relatively plump, showing a stable shuttle shape, and no obvious pinch formed.
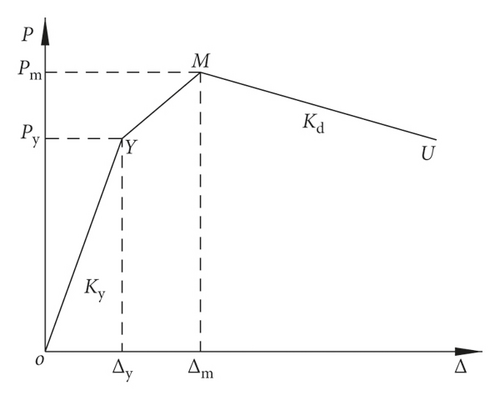
It can be found from the skeleton curves that the column slenderness ratio and axial compression ratio had significant influence on the initial stiffness, displacement at peak load, and the stiffness of the descending segment, while the other factors had almost no impact on the shape of the skeleton curves.
5. Horizontal Load-Displacement Hysteretic Models
Based on the analysis of a large number of parameters, the horizontal load-displacement hysteretic models of single-storey and single-span prestressed and non-prestressed steel reinforced concrete frames were regressed in this paper, which were suitable for such frame structure.
5.1. Skeleton Curves
- (1)
According to the initial bending stiffness of the beam and column section, the size of the specimen, and the load distribution patterns, elastic theory and numerical regression can be used to establish the expression of the initial frame stiffness Ky as follows:
(2) -
Among them,
(3) -
where n0 is the axial compression ratio; Ke is the elastic lateral stiffness of the composite frame under horizontal load; EIc and EIb represent the sectional stiffness of the column and beam, respectively; L is the beam length; and H is the total height of the column.
- (2)
The expression of the regressed horizontal yield load Py is taken as
(4) -
where
(5) -
where Mbu1 and Mbu2 represent, respectively, the flexural capacity at the two ends of the beam in the direction of bending deformation and Mcu1 and Mcu2 represent, respectively, the flexural capacity at the bottom of the two columns.
- (3)
By the analysis, the expression of peak load Pm is given as
(6) - (4)
Through regression analysis, the expression of the displacement Δm corresponding to the peak load is as follows:
(7) - (5)
The expression of the stiffness of the descending section Kd is given below by regression.
6. Hysteresis Rules
- (1)
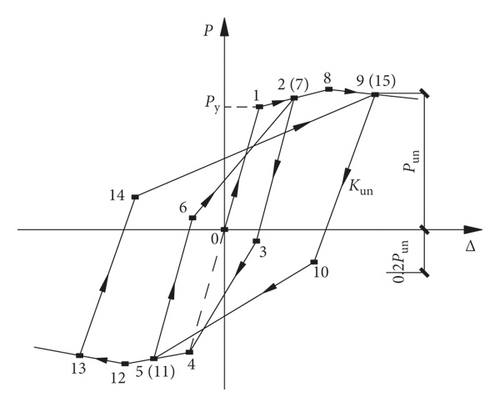
Loading and unloading rules for elastic segment: before the horizontal load reaches the yield load Py, loading and unloading are carried out along the skeleton curves; the unloading stiffness is taken as the initial stiffness, regardless of the stiffness degradation and residual deformation.
- (2)
Loading and unloading rules for elastoplastic stage: the loading stiffness is the incremental stiffness after yielding when the restoring force exceeds the positive or negative yield load Py and does not reach the ultimate bearing capacity Pu in the positive or negative directions. According to a large number of calculated results and statistical regression, the unloading stiffness Kun is reduced from the initial stiffness, which can be obtained as follows:
(9) - (3)
Unloading rules for descending segment: when the restoring force exceeds the limit horizontal load Pu in the positive or negative direction, the loading stiffness is taken as the stiffness of the descending segment of the skeleton curves, and the unloading stiffness of the descending segment is still computed in accordance with equation (9).
- (4)
Reverse reloading rules: after unloading in the forward direction and subsequent loading in the reverse direction, when the maximum displacement experienced in the reverse direction does not exceed the yield displacement Δy, the loading curve will directly point to the reverse yield point from P = 0.2Pun. When the maximum displacement experienced in the reverse direction exceeds the yield displacement Δy, loading curve points directly from P = 0.2Pun to the maximum displacement point experienced in the reverse direction; when unloading in the reverse direction and reloading in the forward direction, the loading curve will point from P = 0.2Pun to the maximum displacement point experienced in the forward direction.
6.1. Hysteresis Model Validation
The comparison between the hysteretic curves obtained by numerical calculation and the P-Δ hysteretic models established in this paper is presented in Figure 10. The results indicate that the hysteretic curves of numerical calculation are close to the hysteretic model. It can be found that the hysteretic models established in this paper are reliable and can be used to predict the hysteretic performance of prestressed and non-prestressed steel reinforced concrete frames under horizontal loads.

7. Conclusions
- (1)
The single-storey and single-span prestressed and non-prestressed steel reinforced concrete frame numerical models established can appropriately reflect the test results and have high reliability.
- (2)
The calculation results of the numerical model showed that the prestressed and non-prestressed steel reinforced concrete frames had full hysteretic loop area and stable shuttle shape without obvious pinching, which showed good energy dissipation capacity.
- (3)
With the increase of column slenderness ratio, the frame stiffness and peak load decreased while the ductility increased; with the increase of axial compression ratio, the frame displacement ductility decreased, showing that its deformation ability is reduced.
- (4)
According to the parameter analysis, the hysteresis model of single-storey and single-span prestressed and non-prestressed steel reinforced concrete frames was established, which can better predict the hysteretic performance of such composite frame under horizontal load.
Conflicts of Interest
The authors declare that they have no conflicts of interest.
Acknowledgments
The authors appreciate the support of the National Natural Science Foundation of China (51878589), China Postdoctoral Science Foundation (2019M651762), Six Talent Peaks Project of Jiangsu Province (2017-JZ-038), Science and Technology Planning Project of Yangzhou City (YZ2018068), and Project of Innovation and Entrepreneurship Plan of Jiangsu Province (2019). The authors also appreciate the contribution of Guanpu Xu, Zaixian Chen, Xinyu Li, Jinyu Shi, and Ahmed Ahmad Omar.
Open Research
Data Availability
The data used to support the findings of this study are available from the corresponding author upon request.


