Research on Maize Disease Recognition Method Based on Improved ResNet50
Abstract
In order to solve the problem of accuracy and speed of disease identification in real-time spraying operation in maize field, an improved ResNet50 maize disease identification model was proposed. Firstly, this paper uses the Adam algorithm to optimize the model, adjusts the learning strategy through the inclined triangle learning rate, increases L2 regularization to reduce over fitting, and adopts exit strategy and ReLU incentive function. Then, the first convolution kernel of the ResNet50 model is modified into three 3 x 3 small convolution kernels. Finally, the ratio of training set to verification set is 3 : 1. Through experimental comparison, the recognition accuracy of the maize disease recognition model proposed in this paper is higher than that of other models. The image recognition accuracy in the data set is 98.52%, the image recognition accuracy in the farmland is 97.826%, and the average recognition speed is 204 ms, which meets the accuracy and speed requirements of maize field spraying operation and provides technical support for the research of maize field spraying equipment.
1. Introduction
Maize is an important food crop, feed crop, and industrial raw material crop in China. It is the second largest crop after rice. China’s maize planting area and total output have ranked second in the world. With the development of maize production, there are many kinds of maize diseases, most of which are caused by fungi, bacteria, and viruses [1]. How to diagnose maize diseases quickly and accurately and take corresponding control measures is of great significance to maize production. If only by human visual observation and experience judgment, it is easy to be misdiagnosed, time-consuming, laborious, and consumable, and maize disease cannot be diagnosed and treated in time, resulting in low maize production efficiency. With the continuous development of computer technology, using image recognition technology for disease diagnosis and detection has become an important research direction of crop disease diagnosis and detection [2]. Automatic recognition of plant diseases based on images is mainly based on traditional image processing techniques and convolutional neural network (CNN) techniques. According to the common leaf diseases of maize, Yang et al. [3], Chen et al. [4], Zhang S. and Zhang C. [5], and Zhu and Xue [6] used SVM (support vector machine) classification method, genetic algorithm, local discriminant mapping (LDP), and local linear embedding (LLE) algorithm on the server side to reduce the extracted disease features, with the correct recognition rate of 93.2%, 90.0%, 94.4%, and 99.5%, respectively. The above research of disease recognition methods based on traditional image processing technology has achieved some results, but the operation of these methods is too cumbersome, the robustness is poor, and the feature extraction method is not universal, which makes the generalization ability of the whole method poor.
In recent years, the deep learning method has also been widely used in maize disease identification. For example, Liu applied triplet loss double convolution neural network structure to learn disease characteristics, and the accuracy was more than 90% [7]. Zhang et al. used image processing and BP neural network to establish the maize leaf disease recognition model, with an accuracy of 93.4% [8]. Xu et al. designed a new full connection layer based on the vgg16 model, with an accuracy of 95.33% [9]. Fan et al. proposed an improved CNN model with the recognition accuracy of 97.10% [10]. Fan Xiangpeng et al. proposed an improved faster R-CNN model, with an average accuracy of 97.23% and a single image taking 0.296 s [11]. Yang et al. proposed the mobile netv2 model based on migration, and its recognition accuracy is 97.23% [12]. Li et al. proposed a ResNet model based on asymmetric residual network, with an accuracy of 97.25% [13]. In conclusion, the deep learning method has achieved good results in the research of maize disease identification, especially based on the ResNet model. However, in order to implement the spraying operation in the field in real time, in addition to the recognition accuracy, the recognition time of a single picture should be guaranteed. Therefore, this study intends to improve the ResNet model, not only to improve the recognition accuracy but also to improve the recognition speed.
2. Data and Methods
2.1. Experimental Data
The research objects of this study are maize mosaic disease, gray spot disease, rust disease, and leaf blight disease. The maize disease images are classified and identified, and maize health images are also prepared. A total of 2309 images of five kinds of maize diseases were collected.
2.2. Data to Enhance
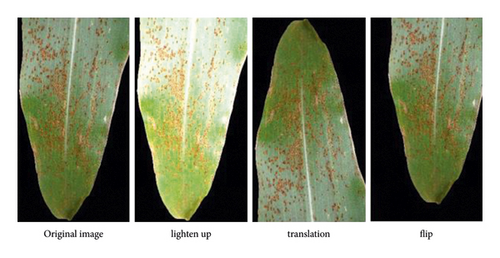
In order to improve the accuracy of maize disease identification, the data enhancement methods, such as brightening, translation, and flipping, were used to expand the data set. The number of mosaic disease images in the original data set increased from 815 to 3260, the number of gray spot images increased from 265 to 668, and the number of rust images increased from 355 to 1420. The number of leaf blight pictures increased from 498 to 1,992, and the number of normal maize pictures increased from 376 to 1,504, as shown in Table 1. Sample expansion example is shown in Figure 1.
| Maize disease name | Number of original images | Number of enhanced images |
|---|---|---|
| Mosaic disease | 815 | 3260 |
| Gray leaf spot | 265 | 668 |
| Rust | 355 | 1420 |
| Maize leaf blight | 498 | 1992 |
| Maize health | 376 | 1504 |
2.3. Selection of Proportion
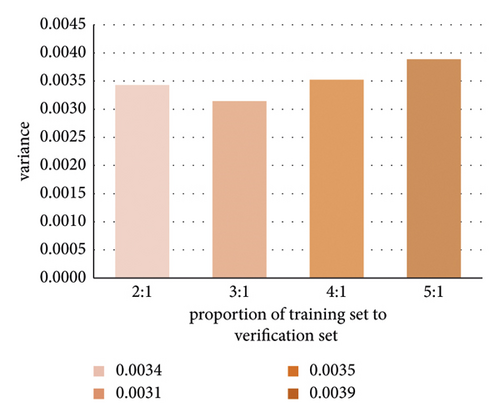
Due to the different proportions of training set and verification set, the stability of maize disease image recognition accuracy will also be affected. In order to reduce the uncertainty caused by this impact as much as possible, this study verifies that the proportion of training set and verification set is 2 : 1, 3 : 1, 4 : 1, and 5 : 1, respectively. Each proportion is run 10 times, and each image is randomly allocated according to the proportion to obtain the accuracy of verification. Then, the variance of each proportion is calculated to obtain the results shown in Figure 2. As can be seen from Figure 2, when the ratio of training set to verification set is 3 : 1, the variance of verification accuracy is the smallest, which is 0.0031. Therefore, this proportion is used for calculation in this study.
2.4. Test Set Data Acquisition
In order to test the recognition effect of this research algorithm on real environmental data with noise, 276 disease images of maize fields were taken by smartphone in the project experimental base in August 2021. Each maize disease image was confirmed by plant protection experts, and finally 76 healthy images, 93 maize leaf blight images, 82 maize gray leaf spot images, and 25 mosaic images were obtained. No pictures of rust were taken during the collection of maize diseases.
2.5. Program Running Environment
All the codes in this experiment are completed under the framework: PaddlePaddle 1.6.0 (Python 3.7).
2.5.1. Framework Environment
GPU is Tesla V100. Video MEM is 16 GB;
2.5.2. Hardware Environment
Hardware environment is as follows: Intel (R) core (TM) i3-4005u CPU @ 1.70 g; GPU uses NVIDIA geforce940mx; 2 GB video memory; and Windows 7 64 bit operating system.
3. ResNet50 Model
The ResNet50 network is divided into six main parts, namely, the input module, four blocks (3, 4, 6, and 3 in each module), and the output module. The building block of the network model is essentially residual block structure. ReLU activation functions were used at each level, and batch canonicalization units were added to improve the adaptability of the model. The ADAM optimizer is selected to improve the accuracy of network recognition. Dimensional parameters of each block of ResNet50 network and the two-dimensional output dimensions of each block are shown in Table 2.
| Layer name | Net | Output |
|---|---|---|
| Conv1 | 7 × 7,64, stride2 | 112 × 112 |
| Conv2_x |
|
56 × 56 |
| Conv3_x | 28 × 28 | |
| Conv4_x | 14 × 14 | |
| Conv5_x | 7 × 7 | |
| Average pool, 1000-d fc, SoftMax | 1 × 1 |
4. Model Improvement
4.1. Parameter Adjustment
The essence of model structure optimization is to minimize the iteration of loss function. In this paper, adaptive motion estimation (Adam) is used to optimize the model, instead of the traditional SGD (stochastic gradient descent) method. The essence of the Adam algorithm is to dynamically adjust the first-order moment estimation (beta1) and the second-order moment estimation (beta2) of each parameter gradient according to the loss function. It is characterized by high calculation efficiency and small memory, which is suitable for solving the problems of large sample size and parameter optimization.
Among them, J is the function training loss value, θ is the model internal weight parameter, λ is the L2 regular term coefficient, x is the batch training sample size, p is the expected classification probability, and q is the predicted classification probability. In addition, the first and second fully connected layers in this article add the dropout strategy layer to prevent overfitting. The SoftMax function is used as the final output in the last fully connected layer. The SoftMax function is often used as a classifier for neural network models. Through function operations, the probability of the input sample being identified as a certain category is calculated. After a series of parameter adjustments, the maximum probability value corresponding to the correct category is obtained. The SoftMax function is easy to calculate, and the result is simple and fast.
4.2. Model Improvement
The first layer of the standard ResNet50 network is implemented through 7 ∗7 convolution layer so that the receptive field is large and enough image features can be extracted. However, most of the maize disease images in this study have small and large number of disease spots, so more effective microfeatures need to be extracted. Therefore, the original layer 1 of ResNet50 network is improved, using three 3 ∗3 stacking layers to replace 7 ∗7 stacking layers as shown in the bold part in Table 3. The improvement also effectively reduces the amount of calculation, assuming that the input and output characteristic graph size of convolution layer is the same as X; the number of three 3 ∗3 convolution layer parameters is 3 ∗(3 ∗3 ∗ x) ∗ x = 27x2; the number of seven ∗7 convolution layer parameters is (7 ∗7 ∗ x) ∗ x = 49x2, so the improved network can bring better performance in maize disease recognition without changing the initial receptive field.
| Layer name | Net | Output |
|---|---|---|
| Conv1 |
|
112 × 112 |
| Conv2_x | 56 × 56 | |
| Conv3_x | 28 × 28 | |
| Conv4_x | 14 × 14 | |
| Conv5_x | 7 × 7 | |
| Average pool, 1000-d fc, SoftMax | 1 × 1 |
5. Results and Analysis
5.1. Model Implementation
-
Step 1. Basic work is loading data file.
-
Step 2. Pretraining model is loaded.
-
Step 3. Data are ready to load image data set.
-
Step 4. A data reader is generated, and then a reader is generated for image classification. The reader is responsible for preprocessing the data of the dataset, and then the data are organized and input in a specific format to the model for training.
-
Step 5. Before fine-tune, set the optimization strategy and parameters for running the ResNet50 model.
-
Step 6. A fine tune task is built. With the appropriate pretraining model and the data set to be migrated, a task is built.
-
Step 7. Run the fine-tune task, train the model parameters, and establish the corn disease identification model.
-
Step 8. Model is evaluated.
5.2. Impact of Different Excitation Functions
In the neural network structure, an excitation function is often added to ensure that the network output is a nonlinear function. Common excitation functions are Sigmoid function, Tanh function, and ReLU function. Figure 3 shows the results of the experiment with different activation functions.
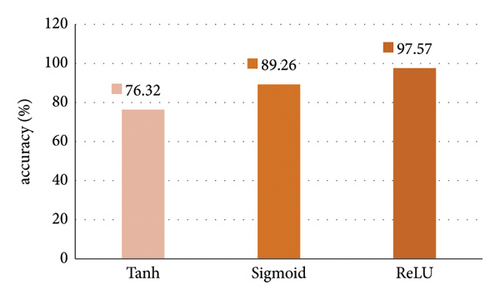
Obviously, when using the ReLU function, the recognition accuracy rate is the highest. The ReLU excitation function is a piecewise form, making its forward, backward, and derivative forms all piecewise, which makes it easier to optimize learning and solve the model convergence problem.
5.3. Comparison of Methods
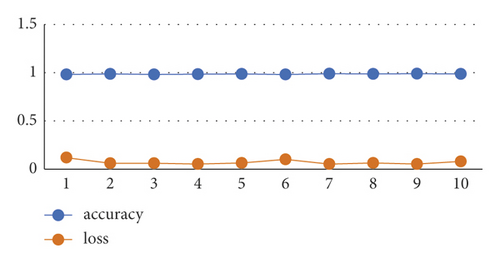
Using the previously determined maize disease training set and verification set, the improved ResNet50 model was trained and verified for 10 times, and the recognition accuracy and loss value of maize disease as shown in Figure 4 are obtained. The average value of maize disease identification accuracy is 0.9852, and the average value of loss value is 0.0707.
In order to verify the feasibility of this research method, the method in reference [7–13], ResNet50, and the improved ResNet50 model are compared, and the results shown in Table 4 are obtained. It can be seen that the average recognition accuracy of the improved ResNet50 model in this paper is the highest, reaching 98.52%. Therefore, the method proposed in this paper is suitable for maize disease image recognition.
5.4. Test in Farmland Environment
The model established in this study is tested by using the maize disease images actually collected in the farmland environment, and the average recognition accuracy is 97.826%. The specific recognition results are shown in Table 5. Because the characteristics of maize leaf blight and gray leaf spot are obvious when collecting maize disease images, the recognition accuracy is 100%; one mosaic virus was identified as healthy, and the accuracy was 96%; affected by light and dust, health images were identified as 1 mosaic, 3 leaf blight and 1 gray leaf spot. The recognition accuracy was 93.4%.
| Disease name | Error number | Correct number | Accuracy (%) |
|---|---|---|---|
| Mosaic disease | 1 | 24 | 96 |
| Gray leaf spot | 0 | 82 | 100 |
| Leaf blight | 0 | 93 | 100 |
| Health | 5 | 71 | 93.4 |
5.5. Recognition Speed
In order to test the recognition speed of the model established in this paper, the data set and maize disease images in farmland are tested for 10 times in each case. The specific parameters and recognition speed are shown in Table 6 and Figure 5. Figure 5 shows the comparison between the data set in 10 tests and the recognition speed of maize disease leaflets in farmland; the average speed of single image recognition is given in Table 6. It can be seen that the image resolution of maize disease in the data set is low and the speed of model recognition is fast, with an average of 63.78 ms; in farmland, the resolution is high and the speed of model recognition is slow, with an average of 204 ms. This recognition speed is higher than that of reference [11]. If the length of the sprayer is 4 m and the traveling speed is 6.24 km/h [14], it takes 2.3 s from obtaining the disease image to spraying, while the max time for maize disease recognition is 0.204 s, which saves a lot of time for other operations of the sprayer.
| Source | Resolution | Number | Average speed (ms) | Speed/pic (ms) |
|---|---|---|---|---|
| Dataset | 256 ∗554 | 554 | 35335.3 | 63.78 |
| Farmland | 1844 ∗4000 | 276 | 56304.2 | 204.00 |

6. Conclusion
In this paper, based on the ResNet50 model, the exponential decay method is used to adjust the learning rate, and L2 regular term is added to the cross-entropy function to punish the weight. In order to avoid over fitting in the training process, dropout strategy and ReLU incentive function are used between the network layers. The first layer of the ResNet50 model was changed into three 3 × 3 convolution layers to improve the recognition accuracy of small disease spots of maize diseases.
In this paper, five maize diseases are identified, including maize mosaic disease, gray leaf disease, rust, leaf blight disease, and maize health. The recognition rates of training set are 98.52%, and the average correct rate of verification set without training is 97.826%, which achieves satisfactory recognition effect. In terms of identification speed, the average identification speed is 204 ms, which meets the speed requirements of the sprayer by identifying the maize diseases collected in the farmland environment for 10 times.
In this paper, the maize disease image recognition model established in this paper does not need to manually extract the characteristics of the input image and only needs a simple category annotation, which not only saves a lot of manpower and time but also does not need to master too much professional knowledge of maize disease. The model has strong generalization ability and good robustness.
In order to realize variable spraying in maize field, it is necessary to collect more disease images with different incidence levels of the same disease, so as to realize the identification of disease occurrence level and provide theoretical basis for the calculation of variable dosage.
Conflicts of Interest
The authors declare that they have no conflicts of interest.
Acknowledgments
This research was funded by National Natural Science Foundation Youth Fund (Grant no. 32001418) and Planning Project of Jilin Provincial Science and Technology Department (Grant nos. 20170204020NY and 20200402106NC).
Open Research
Data Availability
The training and verification dataset in this paper comes from the PlantVillage dataset. The test data are collected in the actual environment and can be obtained from the author of the article.


