Influence of Cavity Width on Attenuation Characteristic of Gas Explosion Wave
Abstract
This study aimed to investigate the influence of cavity width on the attenuation characteristic of gas explosion wave. Attenuation mechanism of gas explosion wave through cavity was obtained by numerical simulation. The gas explosion shock wave energy can be greatly attenuated through the cavity structure in five stages, namely, plane wave, expansion, oblique reflection, Mach reflection, and reflection stack, to ensure that it is eliminated. Cavities with various width sizes, namely, 500 ∗300 ∗200, 500 ∗500 ∗200, and 500 ∗800 ∗200 (length ∗width ∗height, unit: mm), were experimented to further investigate the attenuation characteristics through a self-established large-size pipe gas explosion experimental system with 200 mm diameter and 36 m length. Results showed an evident attenuation effect on flame duration light intensity (FDLI) and peak overpressure with increasing cavity width. Compared with 300 mm, the overall FDLI decreased by 83.0%, and the peak overpressure decreased by 71.2% when the cavity width was 800 mm. The fitting curves of the FDLI and peak overpressure attenuation factors to width-diameter demonstrated that the critical width-diameter was 2.19 when the FDLI attenuation factor was 1. The FDLI attenuation factor sharply decreased at the width-diameter ratio range from 1.5 to 2.5 and basically remained steady at 0.17 at the width-diameter ratio range from 2.7 to 4.0. The peak overpressure attenuation factor gradually decreased with the increase of width-diameter ratio and changed from 0.93 to 0.28 with width-diameter ratio from 1.5 to 4.0. The research results can serve as a good reference for the design of gas explosion wave-absorbing structures.
1. Introduction
Gas explosion is a dynamic disaster phenomenon that occurs in the coal-mining process when gas enrichment reaches its limit and meets a fire source. The high-temperature and high-pressure shock wave generated by the explosion propagates along the tunnel pipe network, causing heavy casualties and serious damage to roadways, support structures, and equipment [1–5]. Gas explosion prevention mainly includes preventive technical measures to counteract the gas accumulation and fire source generation in coal mines and mitigating measures (such as explosion isolation and suppression) to limit or control the gas explosion shock wave propagation. Many scholars have focused on theoretical and experimental research on gas explosion suppression. Yoshidaa et al. [6], Xu et al. [7], Parra et al. [8], Song and Zhang [9], and Nakahara et al. [10] pointed out that water mist has a good effect on gas explosion suppression under certain conditions and the combination of different additives to achieve a suppression effect. Dry powders, such as NH4H2P2O4 [11, 12], ABC [13], and NaHCO3/red-mud [14], have been used in explosion suppression studies. The results demonstrated that powder concentration, explosion suppression dose, powder pyrolysis characteristics, and thermal decomposition products can have a different influence on gas explosion inhibition. A number of studies have been conducted to suppress gas explosion overpressure and quench flame propagation by using porous materials, including porous media [15], foam ceramics [16], wire mesh [17, 18], metal foam [19, 20], and combined wire mesh and foam ceramics [21, 22]. The results showed that the foam iron nickel with great thickness, small aperture, and high nickel content are beneficial to the flame wave attenuation. The effect of combining wire mesh and foam ceramics on attenuation of explosion overpressure and flame temperature is better than that of each. Foam ceramics can attenuate the maximum overpressure of gas explosion by up to 50%, inhibit flame propagation, and quench flames.
Many studies on various pipeline structures and vacuum chambers have reported the influence of these mechanisms on gas explosion propagation. Shao et al. [23–25] conducted experimental research on the influencing factors of the vacuum chamber on explosion suppression. The results showed that the vacuum chamber can effectively suppress the explosion flame and overpressure with any vacuum degree. The vacuum chamber with different diaphragm thicknesses has a variable suppression effect. The explosion suppression effect is related to the break-up time of the diaphragm and the position of the explosion flame front. Niu et al. [26] established a complex transversal pipe network to study the overpressure evolution laws and flame propagation characteristics after methane explosion; these researchers found that a high-pressure area exists in the middle of the transversal branch, and the flame sustaining time and surface damage are minimal at the transversal branch. Sun et al. [27] used numerical methods to investigate the explosion-proof distance and the propagation characteristics of gas explosions with four types of pipe cross-sectional areas. The results demonstrated that maximum overpressure, density, temperature, gas velocity, explosion-proof distance, and combustion rate decrease with the increase of the equivalent pipe diameter. Lin et al. [28] conducted an experiment on the effect of premixed methane-air explosion overpressure by using three different types of bifurcation pipe; the result showed that the peak overpressure had a downtrend before the bifurcation, a sharp increase after the bifurcation until the maximum was reached, and a downtrend at the pipe end. The pipe shapes, such as 90° bends [29, 30], U-bend [31, 32], open-ended pipe [33], pipe with holes [34], and vortex shedding [35] are used to investigate the characteristics of gas explosion propagation.
Previous studies have focused on the propagation characteristics of gas explosion with different absorbing energy materials, pipe network structure, pipe shape, and vacuum chamber. The cavity structure exhibits several characteristics, such as strong damage resistance and reuse, but it is rarely reported to suppress gas explosion propagation using the cavity structure. In this work, the numerical simulation and experimental research are performed to investigate the relevant parameter evolution laws of the gas explosion shock wave through the cavity structure and reveal the quantitative relationship between shock wave attenuation and width of the cavity structure. The research results present a new technique for reducing gas explosion hazard.
2. Cavity Attenuation Wave Numerical Analysis
2.1. Continuous Differential Equation of Gas Explosion
The kinetic process of a gas explosion in a pipe network is expressed by the conservation of mass, momentum, energy, and component. The equations in the Cartesian coordinate are as follows:
- (1)
The gas explosion is simplified as the ideal gas expansion process by heat.
- (2)
The pipe and cavity inner wall are regarded as an adiabatic surface without heat exchange. The radiative heat release in the propagation process of the blast wave and the fluid-solid coupling effect between the solid wall and shock flow are ignored.
- (3)
The gas and air are evenly mixed in accordance with Moore’s law and in a static state before ignition.
- (4)
The gas explosion process is realized in two steps, and the gas mixture of wave front is still in a static state.
- (5)
The Mach stem is a plane shock wave and perpendicular to the solid wall.
2.2. Gas Explosion Chemical Reaction Model
As this study does not simultaneously include the detonation cellular structure part and consider the calculation amount of the elementary reaction model, a two-step reaction model with higher accuracy is adopted, which can be written as follows.
Step 1.
Step 2.
The energy release is small in Step 1 and large in Step 2. The chemical reaction rate formulas corresponding to the reaction model are presented as follows:
The induced reaction rate is expressed by
The rate of exothermic chemical reaction is calculated by
In this study, the Steger-Warming method [36] is used to construct the difference scheme for physical quantities, and the equation is as follows:
In spatial dimension, the WENO format [37] is used for discretization. In time dimension, the LU-SSOR method [38] is adopted for discretization and the time discretization equation:
The equation, with the retained first-order accuracy , can be expressed as follows:
2.3. Numerical Simulation Model
The gas explosion simulation pipe was designed with a 200 mm inner diameter, 11 m length initiation detonation section, 2.5 m length stable section, and 22.5 m length propagation. The numerical monitoring sample points, called 1#, 2#, and 3#, were arranged at different positions before and after the cavity structure to investigate the parameter variation of the gas explosion propagation process. The gas explosion propagations in the cavities with dimensions of 500 ∗300 ∗200, 500 ∗500 ∗200, and 500 ∗800 ∗200 were simulated, and the data of representative cavity (500 ∗500 ∗200) were chosen for analyzing the attenuation wave mechanism. The numerical simulation geometric model is shown in Figure 1.

In order to determine the grid size, the step length of iteration time was 0.00001 s, and grid size of 0.5 ∗ 0.5 mm, 1.0 ∗ 1.0 mm, and 2.0 ∗ 2.0 mm was set, respectively, to analyze the grid independence. When the grid size was refined from 2.0 ∗ 2.0 mm, and 1.0 ∗ 1.0 mm to 0.5 ∗ 0.5 mm, the maximum overpressure increased by 8.4% and 0.5%, respectively. The simulation results were very close when the grid size was 1.0 ∗ 1.0 mm and 0.5 ∗ 0.5 mm. Considering the calculation efficiency, storage space, and accuracy, the tetrahedral grid was used for numerical simulation, the grid size was 1.0 ∗ 1.0 mm. The numerical simulation grid diagram is shown in Figure 2.

In this study, the difference scheme was constructed for physical quantities via the finite volume method and Steger-Warming method. The spatial dimension was discretized in the format of WENO, and the time dimension was discretized through the LU-SSOR method. Material properties were as follows: gas concentration and oxygen concentration were 9.5% and 20.9%, respectively, γ = 1.25, Ct = 70, and μ = 2.5 × 10⁻⁵. The initial conditions were P0 = 2.5 × 10⁻⁵, T0 = 293 K, and v = 0 m/s. The boundary conditions were: the wall surfaces of pipeline and cavity were adiabatic, without slippage.
2.4. Numerical Simulation Results and Analysis of Shock Wave
The numerical simulation results of the gas explosion shock wave overpressure before and after the 500 ∗500 ∗200 cavity structure are shown in Figure 3.

- (1)
Figure 3(a) shows that the gas explosion shock wave propagates forward in the form of a plane wave, and the overpressure of the shock wave changes in a uniform gradient, which enters the cavity structure before.
- (2)
Figures 3(b) and 3(c) show that when the gas explosion shock wave enters the cavity structure, the plane wave becomes spherical and forms the vortex area in the propagation process due to the sudden expansion of the propagation section. Under the combined action of diffraction and expansion, the overpressure distribution displays phenomena such as concentrated enhancement zone at the center of the cavity structure, vortex attenuation zone at both sides, and gradient spherical diffusion zone at the front of the shock wave.
- (3)
In Figure 3(d), along with the combined effects of reflection and superposition in the gas explosion shock wave propagation process within the cavity structure, the gas explosion shock wave high-pressure area transmits to both sides of the cavity structure, and sparse waves generate in the cavity structure center. The Mach reflection appears, the overpressure concentrated area forms on both sides of the cavity structure, and the concentrated area repeatedly reflects in the propagation process due to the superposition of the shock wave reflection on both sides of the wall.
- (4)
Figure 3(e) shows that when the gas explosion shock wave propagates to the cavity structure outlet because of the section reduction, the overpressure concentrated area on both sides of the cavity structure is blocked and reflected. The shock wave attenuation area after the outlet of the cavity structure is simultaneously formed.
- (5)
Figures 3(f) and 3(g) show that the overpressure of the gas explosion shock wave gradually attenuates with the forward propagation in the pipe. The reflection wave gradually attenuates in the backward propagation process and generates a local overpressure concentrated area under the reflection superposition and other comprehensive effects after encountering the cavity wall. Accordingly, the local overpressure oscillation occurs.
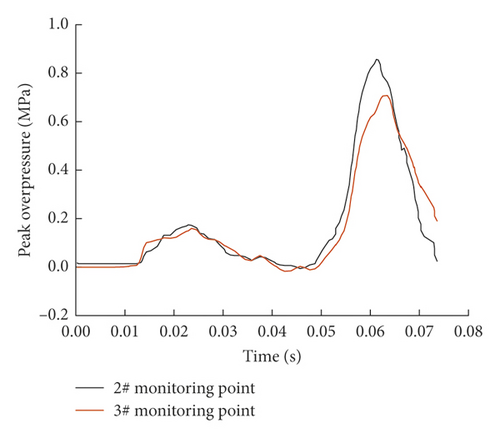
The simulation results of shock wave pressure over time with 500 ∗500 ∗200 cavity are shown in Figure 4. The peak overpressure at 2# and 3# were 0.852 and 0.709, respectively, and the overpressure decreased by approximately 16.7%. In addition, according to the numerical simulation results of 500 ∗300 ∗200 and 500 ∗800 ∗200 cavities, the peak overpressure decreased by approximately 4.1% and 80%, respectively. In conclusion, the gas explosion shock wave energy can be greatly attenuated through the cavity structure by the aforementioned five stages, namely, plane wave, expansion, oblique reflection, Mach reflection, and reflection stack.
2.5. Numerical Simulation Results and Analysis of Flame
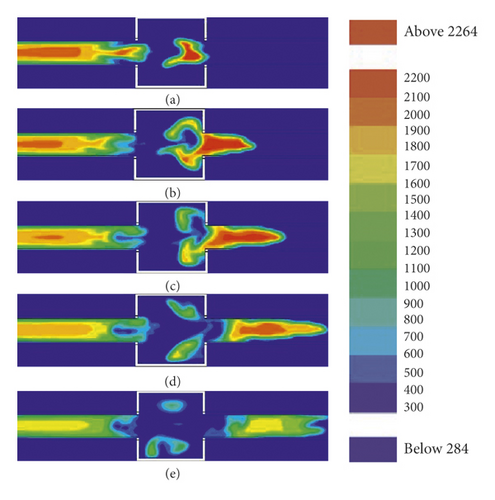
The numerical simulation results of the gas explosion flame temperature (temperature scale: K) before and after the 500 ∗500 ∗200 cavity structure are shown in Figure 5.
- (1)
After the premixed gas is ignited, it forms a spherical flame and spreads forward. Part of the flame directly enters the straight pipe through the cavity, and the flame in the cavity is stretched along the axial direction, as shown in Figure 5(a).
- (2)
The flame passing through the cavity continues to propagate forward along the straight pipe, and the other part is blocked by the cavity outlet wall due to the sudden contraction of the propagation section, as shown in Figure 5(b).
- (3)
The blocked flame generates reflection on the outlet wall surface and diffuses along the cavity wall surface. As the contact area between the flame and the cavity wall surface increases, the energy consumed for friction increases greatly, as shown in Figures 5(c) and 5(d).
- (4)
The flame diffracts in the cavity and the formed reverse propagation flame spreads to the inlet of the cavity, and the flame turbulivity increases; however, the excessive turbulivity is not conducive to the flame propagation, as shown in Figure 5(e).
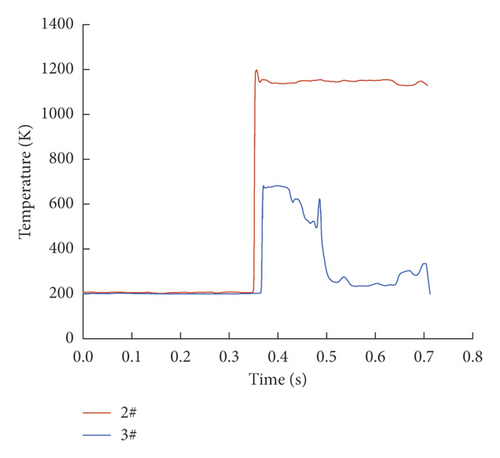
The explosion flame has the occurrence of expansion and dissipation after entering the cavity. The siphon effect of the explosion causes the flame to be stretched. Part of the flame directly passes through the outlet of the cavity, and the other part is propagated back by the cavity wall surface. Due to the different reflection angles, part of the flame enters the cavity inlet and the other part is blocked by the cavity wall and reflects again. The repeated friction between the flame and the cavity wall consumes a lot of energy, and the flame gradually disappears with the depletion of premixed gas. The temperature curve of the explosion flame before and after passing through the cavity size of 500 ∗500 ∗200 is shown in Figure 6. It can be seen that the maximum flame temperature at 2# measuring point in front of the cavity is 1195 K and suddenly drops to 682 K at 3# measuring point after the cavity. The explosion flame energy is greatly attenuated, which shows that this size cavity has a good suppression effect on the explosion flame.
3. Gas Explosion Experimental Systems
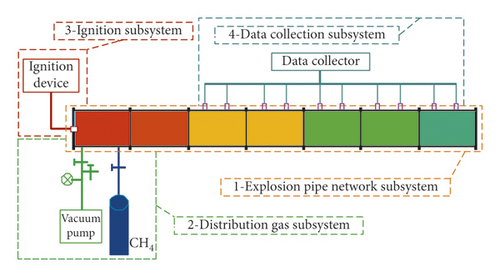
The experimental system is shown in Figure 7, which mainly consists of the pipe network, distribution gas, ignition, and data collection subsystems. The literature [39] showed that the detonation wave can be generated and propagated when the pipe diameter D ≥ λ/π (λ is the detonation cell size of the gas). λ is about 340 mm for gas, so the pipe size needs to be greater than 108 mm. About the pipe wall thickness, the gas explosion pressure generally does not exceed 3 MPa. According to the requirements of pressure vessel specifications, the wall thickness should be greater than 7 mm. The designed explosion pipe is a 200 mm diameter steel round pipe with 10 mm thickness and 36 m length. The arrangement of a certain number of orifices on the pipe is intended for gas distribution, pressure collection, and flame signal collection, i.e., pressure and flame sensor installation. Figure 8 shows a photograph of the gas explosion experimental system.

4. Cavity Attenuation Wave Experiment
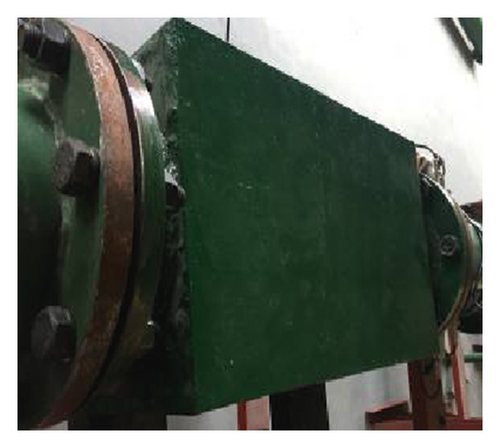
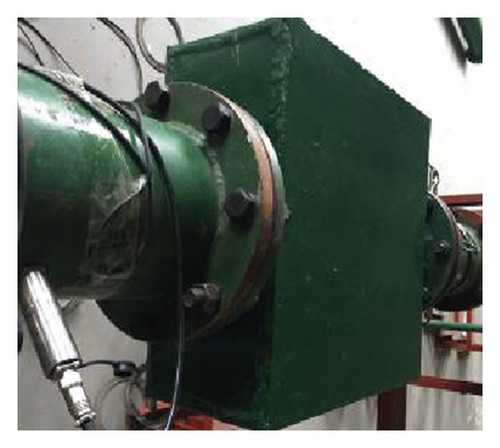
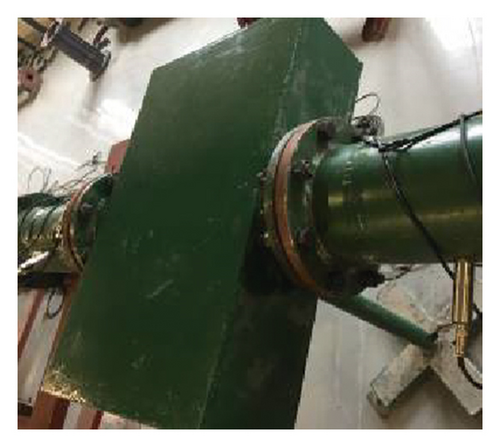
The cavities with different width sizes, namely, 500 ∗300 ∗200, 500 ∗500 ∗200, and 500 ∗800 ∗200, were made of 10 mm thick steel. The cavity structure was connected to the explosion pipe before and after and 13.5 m far from the ignition electrode. The flame sensor is a photosensitive triode induction element, its on-state current is positively correlated with the light intensity, and light signal changes to an electrical signal. The flame sensor information was used with the flame light intensity integration against time to represent the flame strength in the flame propagation process, which is defined as the flame duration light intensity (FDLI). Pressure and flame sensors were arranged before and behind the explosion tube and cavity to collect the shock wave overpressure and FDLI information. The flame sensor is the photosensitive triode sensor CKG100, and the response time is less than 100 μs. The pressure sensor is the high frequency piezoelectric sensor CYG1401 F, and the response time is less than 1 ms. The experimental gas concentration is 9.5%. The initiation detonation section and the stability section were separated by 0.4 mm thickness polyethylene sealing film. The premixed gas was filled before the film and stirred evenly by circulating pump for 25 min. During the experiment, the end of the pipeline system was closed. The ignition was used 36 V safety voltage and ignition energy is 10 J. The installation of the three cavities is shown in the photograph in Figure 9. Figure 10 shows the layout of sensors and cavity. The flame and pressure sensors were numbered F1, F2, F3, P1, and P2 from near to far according to the position of the ignition electrode. The specific parameters of distance (L) and length-diameter ratio (L/D) are shown in Table 1.
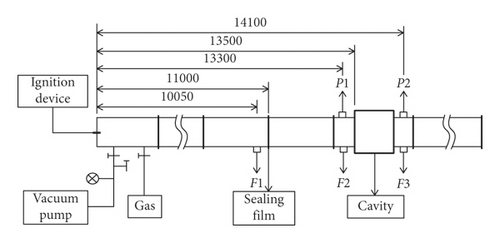
| Flame sensor | F1 | F2 | F3 | |
|---|---|---|---|---|
| Location | L (m) | 10.05 | 13.3 | 14.1 |
| L/D | 50.25 | 66.5 | 70.5 | |
| Pressure sensor | / | P1 | P2 | |
| Location | L (m) | / | 13.3 | 14.1 |
| L/D | / | 66.5 | 70.5 | |
5. Attenuation Wave Results and Discussion
This approach was conducted to investigate the effects of cavity structures with different widths on the gas explosion shock wave overpressure and FDLI. Three sets of gas explosion experiment were carried out for each cavity structure, and one typical set of experimental data was selected for result analysis.
5.1. Flame Duration Light Intensity Influence of Different Width Cavities
The FDLI attenuation rate of gas explosion is defined as the ratio of FDLI attenuation value at measuring points F2 and F3 in front of and behind the cavity to the FDLI at F2.
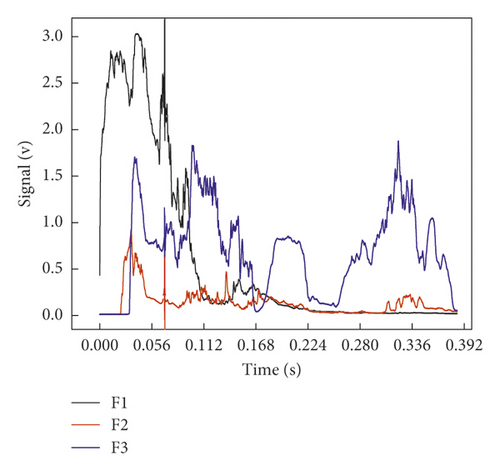
As shown in Figure 11(a) and Table 2, in the gas explosion propagation experiment of 500 ∗300 ∗200 cavity, the FDLIs at F2 and F3 were 0.0340 and 0.1342, respectively, and the FDLI attenuation was –294% after the shock wave passed through the cavity. The oscillation on the frontal surface of primary flame was severe behind the cavity, and the secondary flame was obviously increased, and the FDLI at the cavity outlet was increased by 2.94 times, indicating that the cavity width was small, the gas not fully exploded was propagated into the cavity for continuous reaction, the energy released in the reaction zone was larger than the energy dissipated by local resistance of the cavity, and the explosive reaction was still in an accelerated phase, so the FDLI at the cavity outlet was increased.
| Flame sensor number | F2 | F3 | |
|---|---|---|---|
| Flame duration light intensity | 500 ∗300 ∗200 | 0.0340 | 0.1342 |
| 500 ∗500 ∗200 | 0.0173 | 0.0071 | |
| 500 ∗800 ∗200 | 0.0384 | 0.0065 | |
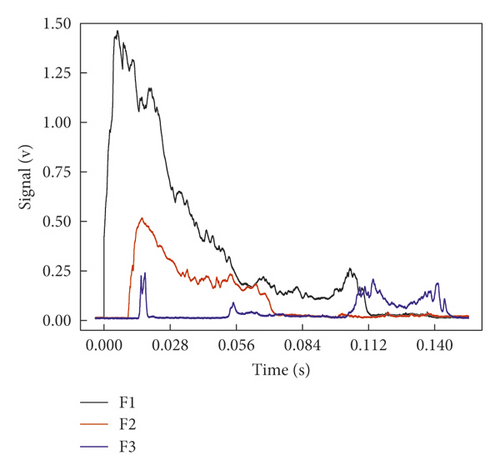
From Figure 11(b) and Table 2, in the gas explosion propagation experiment of 500 ∗500 ∗200 cavity, the FDLIs at F2 and F3 were 0.0173 and 0.0071, respectively, and the attenuation rate of FDLI was 58.9% after the explosion wave passed through the cavity. The average speed of flame was obtained by dividing the interval between the two measuring points by the time difference for the flame signal to reach the two measuring points. As shown in Figure 11(b), the average flame speed between F1 and F2 was 358 m/s, indicating that the explosion already reached the detonation state in front of the cavity. With the increase in the cavity width, the swelling capacity and disturbance time of flame were increased, so was its energy dissipation. Even though the secondary flame was enhanced, the FDLI behind the cavity was obviously weakened, which was similar to the influence of the change in pipeline section on the gas explosion propagation characteristic in the literature [27].
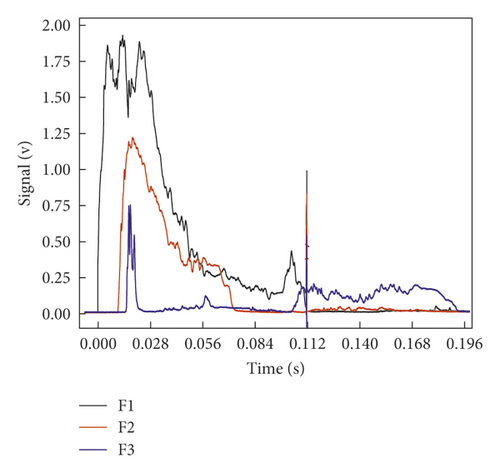
As shown in Figure 11(c), in the gas explosion propagation experiment of 500 ∗800 ∗200 cavity, the FDLIs at F2 and F3 were 0.0384 and 0.0065, respectively, and the FDLI attenuation rate was 83.0% behind the cavity was passed. With the further increase in the cavity width, the transverse diffusion space of the cavity was enlarged, the Mach number and oblique reflection presented backward and forward oscillation, and the energy sharply dropped in front of the cavity outlet.
From the numerical simulation of the gas explosion flame propagation passing through the cavity, the temperature at the cavity outlet declined with the increase in the cavity width. Although the temperature during the explosion process could not be measured, it could be found that the FDLI at the outlet of cavity with width of greater than 500 mm was reduced, indicating that FDLI is correlated with the temperature, and the increase in the cavity width contributes to the energy dissipation.
5.2. Peak Overpressure Influence of Different Width Cavities
The peak overpressure attenuation rate of gas explosion is defined as the ratio of the attenuation value of peak overpressure of shock waves at measuring points P1 and P2 in front of and behind the cavity to the peak overpressure at P1.
As shown in Figure 12(a) and Table 3, the peak overpressures at P1 and P2 were 0.744 and 0.694, respectively, in the gas exploration propagation experiment of 500 ∗300 ∗200 cavity, and the peak overpressure attenuation rate was 6.7%. Based on the abovementioned simulation and theoretical analysis, the shock wave would experience repeated multiform reflection after passing through the suddenly expanded section and rigid wall surface, and partial reflected wave would be transferred from cavity outlet and inlet, but partial energy also presented vortical attenuation, and the total energy was small. As the ratio of cavity width to pipe diameter was small (300/200 = 1.5), most of the shock wave entering the cavity would present inertial propagation along the axial direction of pipeline, and although the peak overpressure at the cavity outlet was reduced, the attenuation amplitude was not large.
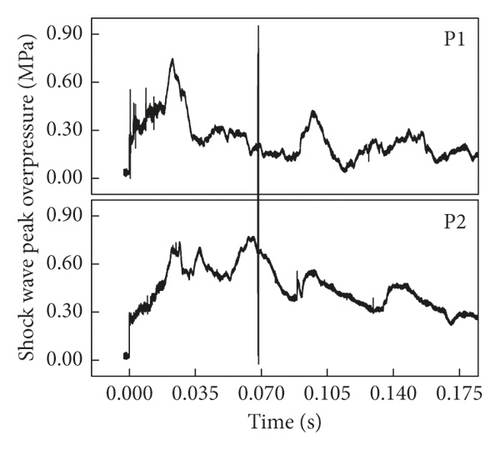
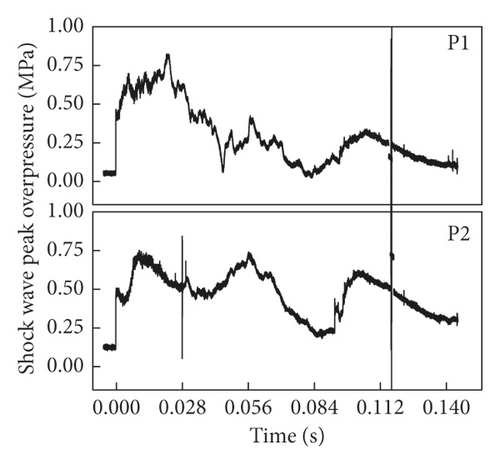
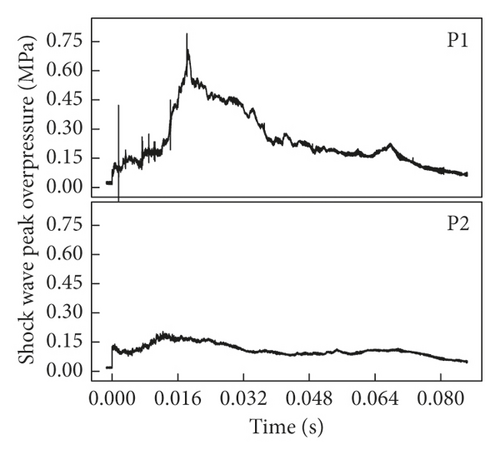
| Flame sensor number | P1 | P2 | |
|---|---|---|---|
| Peak overpressure information(MPa) | 500 ∗300 ∗200 | 0.744 | 0.694 |
| 500 ∗500 ∗200 | 0.820 | 0.730 | |
| 500 ∗800 ∗200 | 0.706 | 0.203 | |
From Figure 12(b) and Table 3, the peak overpressures at P1 and P2 were 0.820 and 0.730, respectively, in the gas explosion propagation experiment of 500 ∗500 ∗200, and the peak overpressure attenuation rate was 10.9% after passing through the cavity. With the increase in the ratio of cavity width to pipe diameter (500/200 = 2.5), the angle between the spherical wave formed inside the cavity and the side wall of the cavity became small, and the possible oblique reflection was increased, thus aggravating the local overpressure oscillation. Because most of the reflected wave on the wall surface at the cavity inlet would still be transferred to the outlet, the attenuation rate of peak overpressure at the cavity outlet would be increased somehow.
It could be known from Figure 12(c) and Table 3 that in the gas explosion propagation experiment of 500 ∗800 ∗200 cavity, the peak overpressures at P1 and P2 were 0.706 and 0.203, respectively, and the overpressure attenuation rate was 71.2% after passing through the cavity. The cavity width was 4 times of pipe diameter, the oscillation space of shock wave inside the cavity was larger, and under the action of superposed reflection, the overpressure of shock wave was transferred to the wall surface of the cavity and dissipated. The ratio of the area of pipeline outlet to the area of cavity wall surface became small, so the peak overpressure at cavity outlet was obviously attenuated.
In conclusion, the shock wave passing through the suddenly enlarged section can occur in the aforementioned five processes. Accordingly, the energy is rapidly consumed. The larger the cavity width is, the larger the spherical wave front becomes. The angle between the spherical wave and cavity wall is small, and Mach and oblique reflections are more likely to occur. Consequently, substantial shock wave energy is consumed. The larger the cavity size is, the more energy is confined inside the cavity when the converging shock wave passes through the cavity outlet. The shock wave reflects back and forth, thereby resulting in additional oscillations in the cavity. The abovementioned phenomenon is the physical essence of reducing the gas explosion shock wave energy using the cavity.
The overpressure attenuation rates obtained through the experiment and simulation of cavity 300 mm in width were 6.7% and 4.1%, respectively, those of cavity with width of 500 mm were 10.9% and 16.7%, respectively, and those of cavity with width of 800 mm were 71.2% and 80%, respectively. By comparison, the maximum deviation of overpressure attenuation rate between experiment and simulation was 8.8%, and the results are in good agreement. Therefore, the numerical simulation results are reliable, and the calculation model and algorithm used are reasonable.
5.3. Quantization Relation of Cavity Width on Gas Explosion Effect
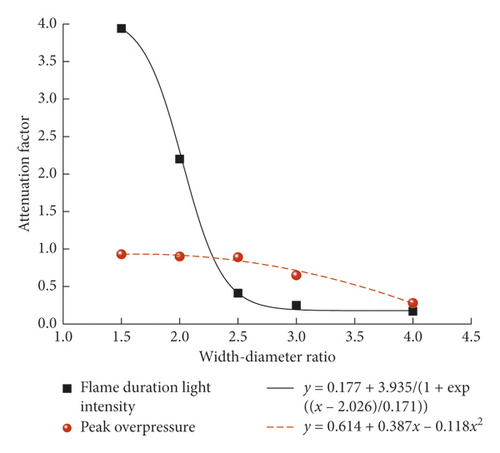
The width-diameter ratio is defined as the ratio of the cavity width to the pipe diameter, which is a characteristic quantity of a certain diameter pipe and the different width cavities and length-diameter and the height-diameter ratios, to study the quantitative relation of the cavity width on the gas explosion effect. The ratio of the same explosion parameters before and after the cavity is defined as attenuation factor D, which represents the characteristic quantity of the explosion parameter attenuation. D > 1 is parameter enhancement, and D < 1 is parameter attenuation. The length-diameter and height-diameter ratios of the aforementioned experimental cavity are 2.5 and 1, respectively. The experimental data under cavity widths of 400 mm and 600 mm were added for the curve fitting, in an effort to more reliably quantify the relationship between the cavity width change and attenuation of gas explosion wave. The width-diameter ratio is taken as the x-coordinate, and the attenuation factor of the FDLI and shock wave peak overpressure are taken as the y-coordinate; and the quantitative relation of the different width-diameter ratio cavity on the gas explosion effect is obtained, as shown in Figure 13. The fitting equation for the FDLI change is expressed as y = 0.177 + 3.935/(1 + exp((x − 2.026)/0.171)) and that for the peak overpressure change is expressed as y = 0.614 + 0.387x − 0.118x2. When the width-diameter is small, the peak overpressure presents an attenuation phenomenon, but the effect is insignificant. The FDLI exhibits no attenuation but presents an enhancement effect. The measured peak overpressure attenuation factor is 0.93, and the FDLI attenuation factor is 3.94 with the width-diameter ratio as 1.5. When the width-diameter ratios range from 1.5 to 2.5, the peak overpressure attenuation factor slightly decreases, and the FDLI attenuation factor sharply decreases. The measured peak overpressure attenuation factor is 0.89, and the FDLI attenuation factor is 0.41 with the width-diameter ratio as 2.5. When the width-diameter ratio is larger than 2.7, the peak overpressure attenuation gradually decreased, and the FDLI attenuation factor basically remained the same. The measured peak overpressure attenuation factor is 0.28, and the FDLI attenuation factor is 0.17 with the width-diameter ratio as 4.0. When the FDLI attenuation factor is equal to one, the width-diameter ratio is 2.19, which is the critical width-diameter ratio. The peak overpressure and FDLI have attenuation with the width-diameter ratio larger than the critical one. The fitting curve illustrates that the attenuation wave effect is evident with the width-diameter ratio larger than 2.7 and tends to be optimal with the width-diameter ratio of approximately 4.0.
6. Conclusions
- (1)
The explosion wave passing through the cavity occur five stages of plane wave, expansion, oblique reflection, Mach reflection, and reflection stack. Due to the process of expansion and reflection in the above five stages, the shock wave energy is significantly weakened, which could be reflected in the experiment and numerical simulation, and also proved the reasonability of the calculation model and algorithm.
- (2)
When the cavity width is smaller, the energy released from the reaction zone is greater than that consumed by the local resistance of the cavity, and the flame energy increases. With the increase of the cavity width, the expansion capacity and disturbance time of the flame increase, the transverse diffusion space of the cavity increase, and the energy dissipation of the flame also increases for oscillating back and forth of the Mach reflection and the oblique reflection, resulting in a sharp drop in energy before the cavity outlet. Compared with the cavity width of 300 mm, when the cavity width is 500 mm and 800 mm, the attenuation of the overall FDLI is 58.9% and 83.0%, respectively.
- (3)
The larger the cavity width is, the larger the spherical wave front becomes, the angle between the spherical wave and cavity wall is smaller, and Mach and oblique reflections are more likely to occur. Meanwhile, with the decrease of the energy inside the cavity and the reflection back and forth of the converging shock wave at the cavity outlet, the additional oscillations occur inside the cavity. The above phenomenon is the physical essence of reducing the gas explosion shock wave energy using the cavity. Compared with the cavity width of 300 mm, when the cavity width is 500 mm and 800 mm, the attenuation of the peak overpressure is 10.9% and 71.2%, respectively. Therefore, increasing the cavity width can significantly improve the attenuation wave effect.
- (4)
The fitting equation of the FDLI attenuation factor and width-diameter ratio is expressed as y = 0.177 + 3.935/(1 + exp((x − 2.026)/0.171)) and shows a positive correlation. Meanwhile, the fitting equation of the peak overpressure attenuation factor and width-diameter ratio is expressed as y = 0.614 + 0.387x − 0.118x2. The critical width-diameter ratio is 2.19 when the FDLI attenuation factor is equal to one. The attenuation wave effect is evident with a width-diameter ratio larger than 2.7. The attenuation wave effect tends to be optimal with a 4.0 width-diameter ratio. The peak overpressure attenuation factor is approximately 0.28, and the FDLI attenuation factor is 0.17.
Conflicts of Interest
The authors declare that there are no conflicts of interest regarding the publication of this paper.
Acknowledgments
This work was supported by the National Natural Science Foundation of China (11472007) and University Natural Science Research Project in Anhui Province (KJ2019A0098 and 1808085ME160).
Open Research
Data Availability
All data included in this study are available upon request by contacting the corresponding author.


