Application of a Modified Low-Field NMR Method on Methane Adsorption of Medium-Rank Coals
Abstract
Methane adsorption capacity is an important parameter for coalbed methane (CBM) exploitation and development. Traditional examination methods are mostly time-consuming and could not detect the dynamic processes of adsorption. In this study, a modified low-field nuclear magnetic resonance (NMR) method that compensates for these shortcomings was used to quantitatively examine the methane adsorption capacity of seven medium-rank coals. Based on the typical T2 amplitudes obtained from low-field NMR measurement, the volume of adsorbed methane was calculated. The results indicate that the Langmuir volume of seven samples is in a range of 18.9–31.85 m3/t which increases as the coal rank increases. The pore size in range 1-10 nm is the main contributor for gas adsorption in these medium-rank coal samples. Comparing the adsorption isotherms of these coal samples from the modified low-field NMR method and volumetric method, the absolute deviations between these two methods are less than 1.03 m3/t while the relative deviations fall within 4.76%. The absolute deviations and relative deviations decrease as vitrinite reflectance (Ro) increases from 1.08% to 1.80%. These results show that the modified low-field NMR method is credible to measure the methane adsorption capacity and the precision of this method may be influenced by coal rank.
1. Introduction
The gas adsorption property in a coal seam was controlled by its physical and chemical structure [1, 2]. Therefore, the adsorption characteristic of gas in a coal seam is comparatively complex in comparison to that in traditional reservoirs. Previous researches about adsorption mainly focus on theory and model of methane adsorption [3–6], controlling factors of the gas adsorption process [7–16], and competitive adsorption mechanism [17–22]. Generally, coalbed methane is mainly stored as an adsorbed phase in the micropores, and a few parts are stored as a free phase in macropores and fractures. Thus, the measurement of adsorbed methane in a reservoir is critical for choosing a favorable exploration area and designing engineering parameters during production processes.
Methane adsorption property in coal is usually determined according to the (a) volumetric method [23–29], (b) gravimetric method [30–32], or (c) manometric method [33–35]. These methods could not continuously detect the dynamic process of adsorption and are always time-consuming. Thus, researchers tried to obtain the adsorption property by other methods.
As an instantaneous, in situ, and dynamic method, the low-field NMR method has been used in the field of unconventional reservoir characterization (i.e., permeability, porosity, and wettability) in recent years [36–47]. There are, however, quite few studies involving low-field NMR relaxation characteristics of adsorbed methane in coal. Guo et al. [48] used a low-field NMR amplitude index from bulk methane to quantify the mass and volume of adsorbed methane in two low volatile bituminous coals, without distinguishing the bulk methane and adsorbed methane relaxation properties. Yao et al. [49] and Xie [43] built an NMR transparent isotherm adsorption experimental setup to evaluate the capacity of methane in coal. The deviations between their method and traditional volumetric method are in range of 0.50%–11.09%. Then, Yao et al. [50] improved the low-field NMR method by taking a factor “pipeline volume” into consideration and applied it to calculate the adsorbed methane volume in two shale samples. The calculated adsorbed methane volumes fit well with values from the gravimetric method. As an organic rock, the pore property (i.e., types, structure, and pore size distribution) of coal is different to that of shale rock which would influence the gas adsorption performance in reservoirs. However, to the best of the authors’ knowledge, the suitability of this modified low-field NMR method [50] on a coal sample and the influence of the coal rank on the results from this method have never been discussed. In this study, the problems mentioned above were analyzed based on the experimental results of seven coal samples in medium-rank range according to the volumetric method, Yao et al.’s low-field NMR method [49], and our modified low-field NMR method, respectively.
2. Sample and Methods
2.1. Sample Preparation
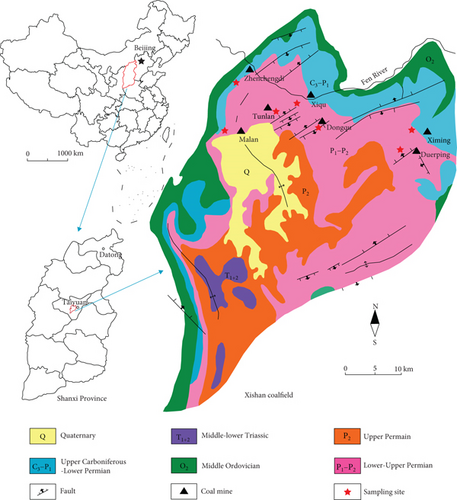
Seven fresh block samples were obtained from underground coal mines (Malan mine (ML), Tunlan mine (TL), Dongqu mine (DQ), Xiqu mine (XQ), Ximing mine (XM), Zhenchengdi mine (ZCD), and Duerping mine (DEP)) in the Xishan coalfield, China (Figure 1). Each sample was crushed and sieved into a size range of 0.18–0.25 mm and 0.1 mm to 1 mm for methane isotherm adsorption and vitrinite reflectance (Ro) measurements, respectively.
2.2. Volumetric Method
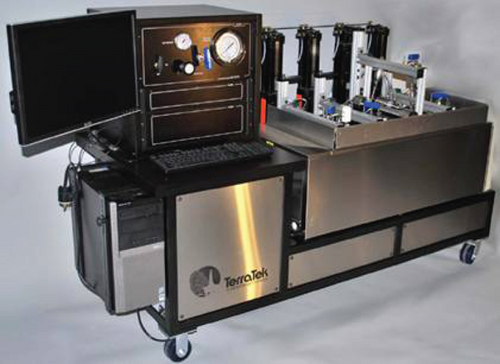
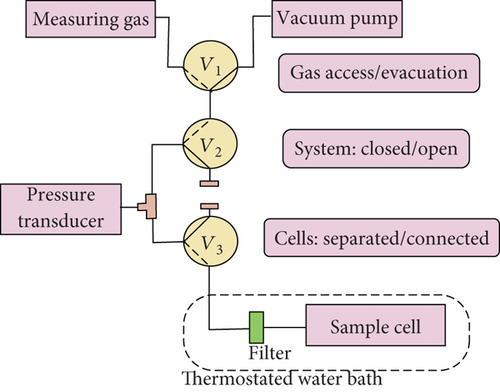
According to GB/T 19560-2008, the experiment of methane adsorption using the volumetric method was accomplished. The volumetric apparatus mainly includes the reference cell, sample cell, and temperature control system (Figure 2(a)). Figure 2(b) is a simplified diagram of the volumetric method. At constant temperature of 30°C, the Langmuir volume of adsorbed methane was calculated under a dry basis. The theoretical background and experimental procedures for the volumetric method of gas adsorption isotherms on coal are discussed in detail in the literature [22, 26]. This experiment was conducted in the North China Petroleum Technology Service using the ISO-300 ISOTHERM DESORPTION instrument.
2.3. Low-Field NMR Relaxation Method
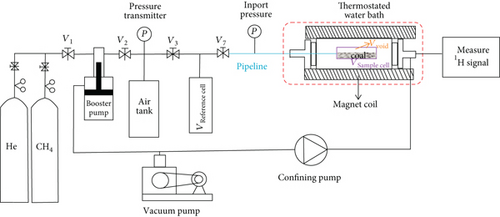
The low-field NMR measurement apparatus used in this study is a MacroMR12-150H-I spectrometer, manufactured by Niumag Corporation Ltd., China. The instrument has a frequency of 12.98 MHz, a magnetic strength of 0.5 T, and a magnet coil with the diameter of 60 mm. The magnetic uniformity is as low as 30ppm, and relaxation from gas diffusion could be ignored. Figure 3 is a simplified diagram of low-field NMR, mainly consisting of five parts: a gas supply system, a booster pump, a vacuum pump, a NMR measurement apparatus, and a temperature control device.
In this study, a Carr–Purcell–Meiboom–Gill (CPMG) sequence was used for measuring transverse relaxation times (T2). The CPMG measurement parameters were appropriately set to maximize the amount of information acquired for coal samples. The parameters echo spacing (TE) and number of trains (NS) for the NMR experiment were 0.2 ms and 64, respectively. The wait time of 5000 ms and number of echoes (NECH) of 18000 were used to ensure that the complete decay curve would be recorded. The experimental procedures were as follows:
First, some helium with pressure less than 3 MPa was injected into the reference cell, and wait for five hours to check air tightness. Second, three conditions were set to calculate the volume of the reference cell, pipeline, and sample cell. Third, methane gas was injected into the sample cell to check for methane signal. A relationship between the mass of bulk methane and amplitude was built at a constant temperature of 30°C. After that, the coal samples which had been dried in a dry box at 110°C for 1 hour were loaded into the sample cell. Then, methane gas was injected into the sample cell for adsorption measurements. Finally, the low-field NMR measurement of the sample cell was conducted with a time interval of 1 h until two successive results had negligible fluctuation.
Seven coal samples were computed independently at six different pressures by repeating the experimental procedures above. Every sample placed in the sample cell was in the range of 28 to 30 g.
2.4. The Theory of NMR Measurements for Methane Gas
Nuclear magnetic resonance occurs when the nucleus of a hydrogen proton (i.e., water, gas, and oil) enters the static magnetic field magnetization and the RF plus gradient field excitation. Using the relaxation distribution and the relaxation time, the number of hydrogen atoms in the methane gas would be detected.
3. Result
3.1. Characteristics of Coal Samples
The vitrinite reflectance (Ro) measurements were acquired using a Zeiss Axioskop 40 A photometer microscope, following conventional methods according to China National Standards GB/T 6948-2008 [53]. The mean maximum vitrinite reflectance (Ro) data of seven coal samples ranges from 1.08% to 1.80%, as shown in Table 1. Meanwhile, the vitrinite accounts for between 61.2 and 76.8%, while inertinite ranges from 21.2 to 35.6%, and almost no liptinite is present. The proportion of mineral matter (visible) ranges from 0.3 to 3.2%.
| Sample ID | Vitrinite reflectance (Ro%) | Maceral and mineral (vol.%) | |||
|---|---|---|---|---|---|
| Vitrinite | Inertinite | Liptinite | Mineral | ||
| ML-2 | 1.08 | 76.8 | 21.2 | — | 2.0 |
| ZCD-2 | 1.21 | 66.9 | 32.3 | — | 0.8 |
| TL-2 | 1.24 | 74.9 | 24.7 | 0.4 | |
| XQ-2 | 1.32 | 64.0 | 35.2 | 0.8 | |
| XM-2 | 1.61 | 61.2 | 35.6 | — | 3.2 |
| DEP-3 | 1.71 | 75.2 | 22.8 | — | 2.0 |
| DQ-2 | 1.80 | 68.7 | 31.0 | — | 0.3 |
3.2. The Result of Methane Adsorption by the Volumetric Method
The results of methane adsorption experiment from the volumetric method are shown in Table 2. The volume of adsorbed methane was calculated and translated to the volume of methane at the standard state (101.325 Pa, 0°C).
| Sample | Parameter | Sequence | |||||
|---|---|---|---|---|---|---|---|
| 1 | 2 | 3 | 4 | 5 | 6 | ||
| ML | P (MPa) | 0.618 | 1.095 | 2.245 | 3.814 | 6.017 | 7.518 |
| V (m3/t) | 3.378 | 5.807 | 9.279 | 11.971 | 13.900 | 14.197 | |
| ZCD | P (MPa) | 0.697 | 1.205 | 2.337 | 3.822 | 5.983 | 7.581 |
| V (m3/t) | 3.527 | 5.593 | 8.341 | 11.005 | 12.959 | 15.088 | |
| TL | P (MPa) | 0.695 | 1.251 | 2.405 | 3.809 | 6.082 | 1.793 |
| V (m3/t) | 5.464 | 7.892 | 11.043 | 13.149 | 15.416 | 17.546 | |
| XQ | P (MPa) | 0.625 | 1.141 | 2.249 | 3.682 | 5.980 | 7.642 |
| V (m3/t) | 3.574 | 6.278 | 9.531 | 12.321 | 14.424 | 15.546 | |
| XM | P (MPa) | 0.563 | 1.060 | 2.172 | 3.764 | 5.902 | 7.846 |
| V (m3/t) | 3.918 | 6.410 | 10.919 | 14.198 | 16.211 | 18.653 | |
| DEP | P (MPa) | 0.672 | 1.172 | 2.241 | 3.927 | 6.016 | 7.643 |
| V (m3/t) | 5.426 | 8.306 | 11.763 | 14.781 | 17.039 | 19.573 | |
| DQ | P (MPa) | 0.699 | 1.172 | 2.301 | 3.994 | 6.039 | 7.669 |
| V (m3/t) | 6.543 | 11.544 | 16.104 | 19.938 | 22.739 | 24.585 | |
3.3. Results by the Modified Low-Field NMR Method
3.3.1. The Volumes of the Reference Cell, Sample Cell, and Pipeline
The volumes of each part of the test system are the fundamental parameters for calculating methane adsorption volume using the modified low-field NMR method. Yao et al. [49] pointed that a small degree of helium sorption (which cannot be excluded but also not quantified) might lead to an underestimation of the sample cell volume for both methods. So, methane gas was used to minimize this deviation in this experiment. Three assumed conditions were designed to calculate the volumes of the sample cell, reference cell, and pipeline. The calculation procedure is as follows (Figure 4).
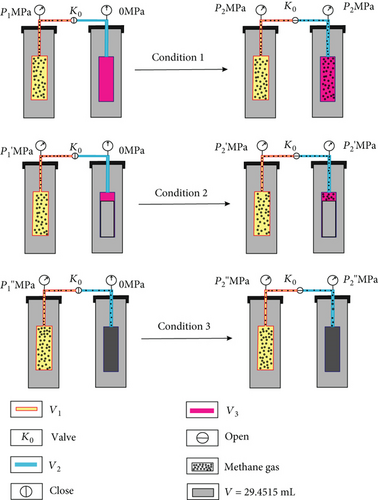
According to equations (3)–(5), the volumes of the sample cell, reference cell, and pipeline were calculated (Table 3).
| Sequence | Condition | Parameters | |||||
|---|---|---|---|---|---|---|---|
| 1 | 2 | 3 | V1 | V2 | V3 | ||
| First time | Pi (MPa) | 1.62 | 1.99 | 1.89 | 39.6693 | 8.0854 | 41.5012 |
| Pe (MPa) | 0.72 | 1.32 | 1.57 | ||||
| Second time | Pi (MPa) | 2.51 | 1.72 | 2.19 | 38.6185 | 7.8713 | 41.4746 |
| Pe (MPa) | 1.12 | 1.14 | 1.83 | ||||
| Third time | Pi (MPa) | 2.56 | 2.65 | 2.72 | 38.7619 | 8.3061 | 40.7465 |
| Pe (MPa) | 1.13 | 1.76 | 2.24 | ||||
| Average | 39.0166 | 8.0876 | 41.2407 | ||||
- Pi and Pe stand for the injection pressure and equilibrium pressure, respectively.
The pressure operation processes (conditions 1–3) were repeated three times to minimize experiment deviation (Table 3).
3.3.2. The Relaxation Properties of Bulk Methane
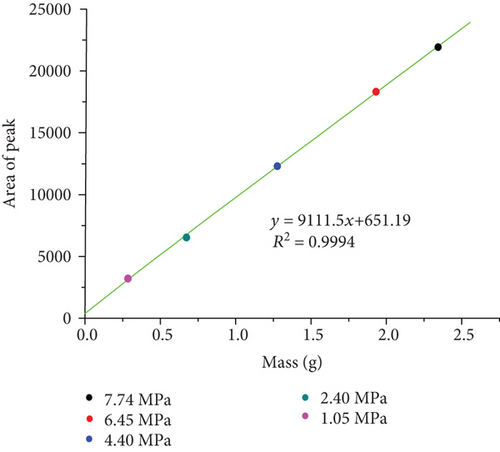
| P (MPa) | 1.05 | 2.40 | 4.40 | 6.45 | 7.74 |
| Mass (g) | 0.2875 | 0.6718 | 1.2715 | 1.9231 | 2.3503 |
| Relaxation area | 3292.59 | 6616.73 | 12339.10 | 18419.58 | 21850.10 |
As shown in Figure 5(a), the relaxation time of bulk methane is relatively large, which exhibits an obvious peak at 70 ms–2000 ms. The relaxation area and relaxation times of bulk methane gradually increase with the increase in pressure, which is consistent with the work of Guo et al. [48] and Yao et al. [49, 50]. Morriss et al. [51] proved that the mean free path of methane molecules declines with the increase in pressure, which results in the increase in bulk methane relaxation time.

3.3.3. The Relaxation Properties of Methane in Coal
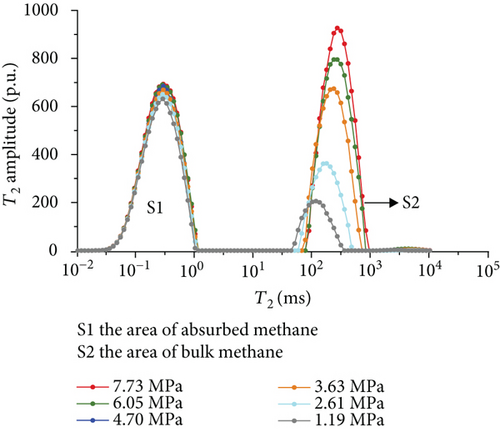
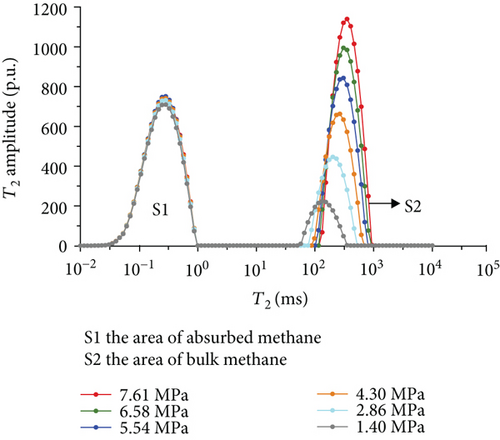
In this experiment, six random pressures were selected between 0 and 8 MPa. The methane isotherm adsorption of coal samples was carried out according to the steps mentioned in Section 2.
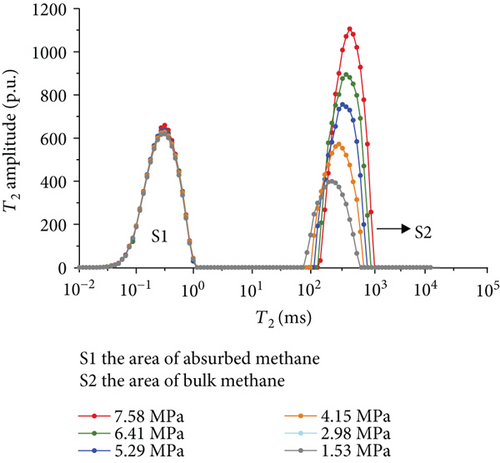
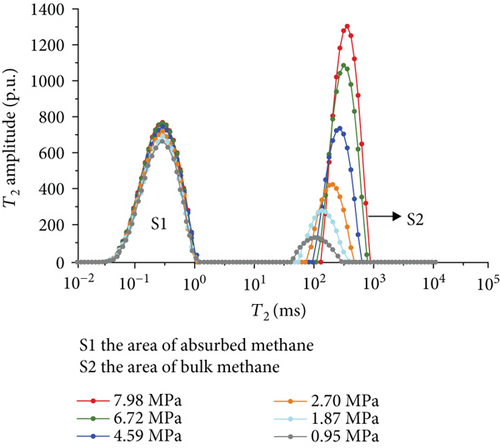
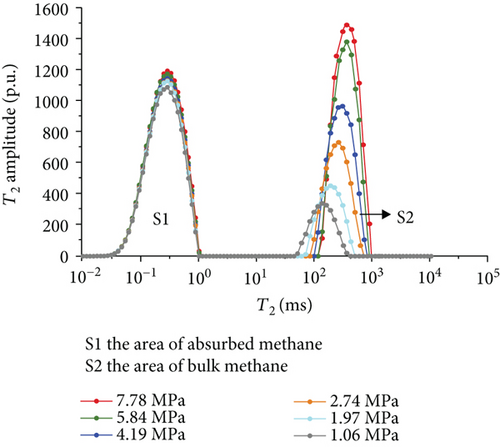
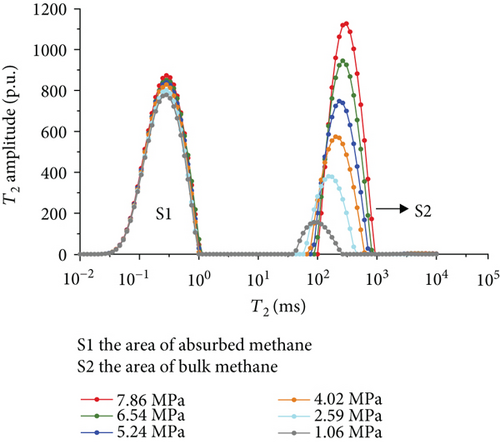
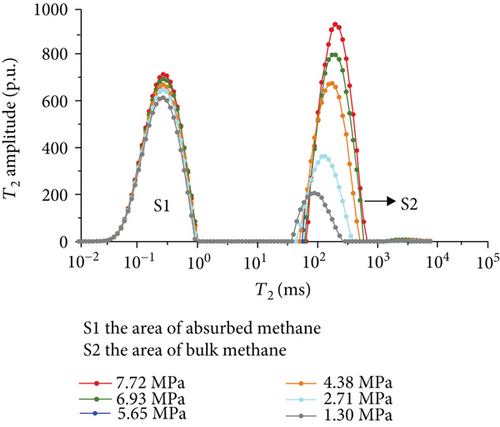
Figure 6 shows the methane relaxation spectra of seven samples at different pressures. Compared to the T2 spectra of bulk methane, these spectra show a bimodal structure. This indicates that there are two different relaxations of methane (S1 and S2). The methane relaxation time in micropores is faster than that in macropores as a response for pore radius (equation (2)). Therefore, the relaxation area of the second peak (S2) represents bulk methane in macropores (T2 relaxation time is between 75 ms and 1000 ms), and the relaxation area of the first peak (S1) represents adsorbed methane in micropores or on the surface of the coal matrix (T2 relaxation time is <1 ms). As the pressure increases, the starting value of relaxation time represents that adsorbed methane does not change while bulk methane increases. The peak position of each spectrum shows the similar characteristic with a starting value, which indicates that the pressure has no influence on the methane relaxation in the adsorbed phase.
3.3.4. The Methane Adsorption by Modified Low-Field NMR
| Sample | Parameters | Sequence | |||||
|---|---|---|---|---|---|---|---|
| 1 | 2 | 3 | 4 | 5 | 6 | ||
| ML | P (MPa) | 1.19 | 2.61 | 3.63 | 4.70 | 6.05 | 7.73 |
| S1 | 7897.07 | 8424.60 | 8796.56 | 8746.33 | 9179.86 | 9341.07 | |
| V∗ (m3/t) | 6.479 | 10.090 | 11.394 | 12.288 | 13.252 | 14.779 | |
| ZCD | P (MPa) | 1.40 | 2.86 | 4.30 | 5.54 | 6.58 | 7.61 |
| S1 | 8935.66 | 9224.92 | 9391.05 | 9450.81 | 9444.28 | 9431.63 | |
| V∗ (m3/t) | 6.599 | 9.833 | 11.620 | 12.976 | 14.059 | 14.948 | |
| TL | P (MPa) | 1.39 | 2.80 | 4.06 | 5.20 | 6.30 | 7.54 |
| S1 | 1704.017 | 3933.606 | 5624.065 | 7407.862 | 9207.367 | 11112.86 | |
| V∗ (m3/t) | 7.620 | 11.659 | 13.077 | 14.210 | 15.360 | 16.076 | |
| XQ | P (MPa) | 0.95 | 1.87 | 2.70 | 4.59 | 6.72 | 7.98 |
| S1 | 3594.01 | 9297.04 | 9314.20 | 10060.46 | 10062.72 | 10032.34 | |
| V∗ (m3/t) | 5.355 | 8.493 | 10.397 | 12.773 | 14.742 | 16.089 | |
| XM | P (MPa) | 0.97 | 1.97 | 2.74 | 4.19 | 5.84 | 7.78 |
| S1 | 13403.84 | 14419.56 | 14586.88 | 14808.96 | 15510.67 | 15556.58 | |
| V∗ (m3/t) | 6.073 | 9.685 | 11.575 | 13.830 | 15.757 | 17.372 | |
| DEP | P (MPa) | 1.06 | 2.59 | 4.02 | 5.24 | 6.54 | 7.86 |
| S1 | 9913.70 | 10210.35 | 10476.55 | 10911.88 | 11332.63 | 11377.45 | |
| V∗ (m3/t) | 7.940 | 11.095 | 14.480 | 16.720 | 17.660 | 18.802 | |
| DQ | P (MPa) | 1.30 | 2.71 | 4.38 | 5.65 | 6.93 | 7.72 |
| S1 | 9533.81 | 9830.48 | 10296.58 | 10531.93 | 10872.74 | 10997.56 | |
| V∗ (m3/t) | 10988 | 15.506 | 19.860 | 21.093 | 23.314 | 23.810 | |
- V∗ is the volume of adsorbed methane determined by the low-field NMR method.
4. Discussion
4.1. The Suitability of the Modified Low-Field NMR Method
The low-field NMR as an in situ and dynamic method has been extensively applied to describe unconventional reservoir physical properties. In recent years, it is used to calculate the volume of adsorbed methane [50]. In contrast to the volumetric method, the low-field NMR modified method has many advantages.
Firstly, fewer mass of coal samples was required in the low-field NMR method (about 30 g), while the volumetric method needs coal samples of 200 g. Secondly, the low-field NMR method are mostly time saving. Thirdly, the pore size distribution of coal samples can be analyzed by the data of T2 spectra. What is more, low-field NMR could perform real-time monitoring of the adsorption process.
The data of low-field NMR relaxation were processed according to Yao et al.’s low-field NMR method [49] and our modified low-field NMR method, respectively. The deviations between the results of the volumetric method and these two low-field NMR methods are shown in Table 6. The absolute deviations calculated according to Yao et al.’s method [49] vary from 1.36 m3/t to 5.37 m3/t while relative deviations range from 5.79 to 24.42%. The absolute deviations from the modified NMR method fall in the range of 0.13–1.03 m3/t while relative deviations are <4.76%. The modified NMR method produced a relatively lower deviation compared with Yao et al.’s method [49], which indicates that the modified low-field NMR method is more suitable for measuring the amount of adsorbed methane (Figure 7).
| Sample | ML | ZCD | TL | XQ | XM | DEP | DQ |
|---|---|---|---|---|---|---|---|
| VLa (m3/t) | 19.76 | 21.64 | 21.98 | 21.28 | 25.64 | 25.13 | 32.15 |
| VLb (m3/t) | 16.37 | 19.42 | 16.61 | 19.92 | 21.01 | 21.19 | 28.09 |
| VLc (m3/t) | 18.90 | 20.61 | 21.19 | 20.49 | 25.06 | 25.00 | 31.85 |
| PLa (MPa) | 2.69 | 3.63 | 2.30 | 2.82 | 3.10 | 2.52 | 2.37 |
| PLb (MPa) | 2.35 | 3.18 | 1.64 | 1.93 | 2.50 | 2.32 | 2.20 |
| PLc (MPa) | 2.36 | 3.06 | 2.22 | 2.72 | 2.97 | 2.73 | 2.65 |
| (m3/t) | 3.39 | 1.82 | 5.37 | 1.36 | 4.65 | 3.94 | 4.06 |
| (m3/t) | 0.86 | 1.03 | 0.79 | 0.79 | 0.58 | 0.13 | 0.30 |
| (%) | 17.18 | 5.79 | 24.42 | 6.37 | 18.07 | 15.68 | 12.64 |
| (%) | 4.35% | 4.76% | 3.40% | 3.71% | 2.31% | 0.52% | 0.93% |
- aThe result based on the volumetric method; bthe result based on Yao et al.’s method [49]; cthe result based on modified low-field NMR.
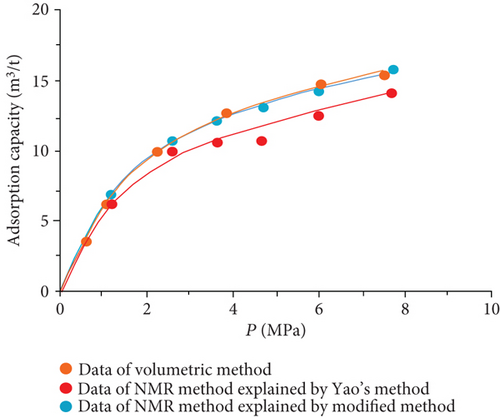
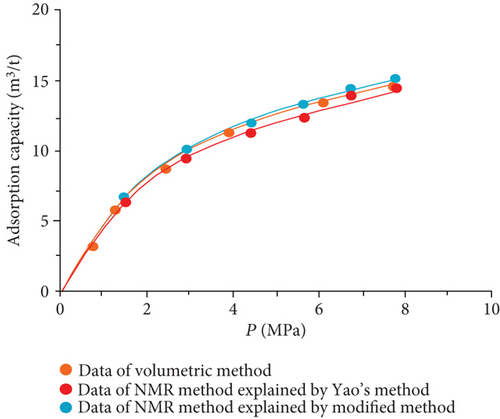
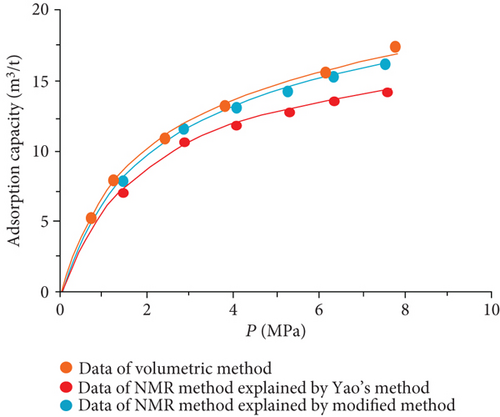
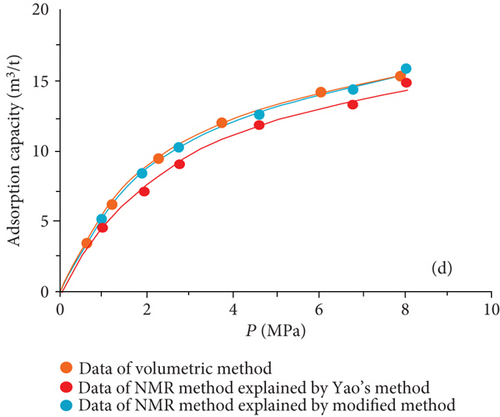

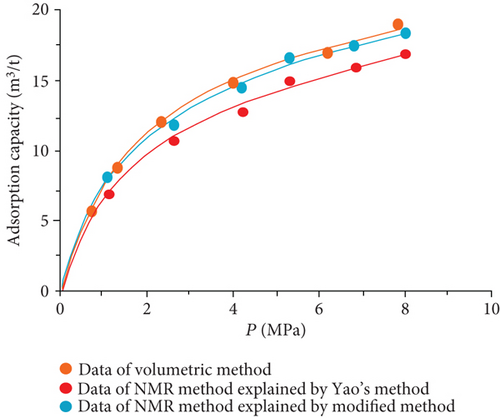
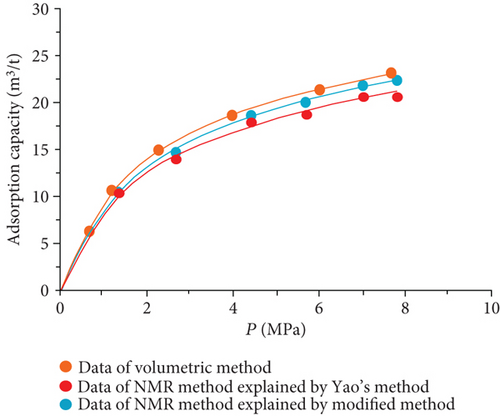
It was also found that the result of the modified low-filed NMR method lightly underestimates that of the volumetric method (Figure 7). Three possible reasons may explain this phenomenon. Firstly, the temperature error of the sample cell holder may bring in influence on the signal of bulk methane. Secondly, the accuracy of low-field NMR instrument may result in deviations (i.e., the accuracy of the pressure gauge used in the NMR method is only 0.01, while the accuracy of the pressure gauge of the volumetric apparatus is 0.001). Moreover, for the needs of all sample cell signals are captured by the NMR system, a little part of the pipeline connected with the sample cell is also located in the magnet coil. These signals in this area may be treated as a signal of the sample cell during the relaxation signal collection. These signals would lead to an additional mass of bulk methane in the reference cell.
4.2. Adsorption Equilibration Time by Low-Field NMR
The volumetric method could not monitor the mass of adsorbed methane in real time. The adsorption equilibrium time can only be determined by monitoring pressure changes. But the low-field NMR method with a set time interval of signal collection can detect the methane adsorption dynamic process.
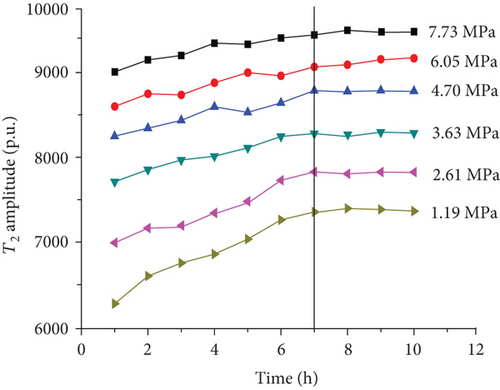
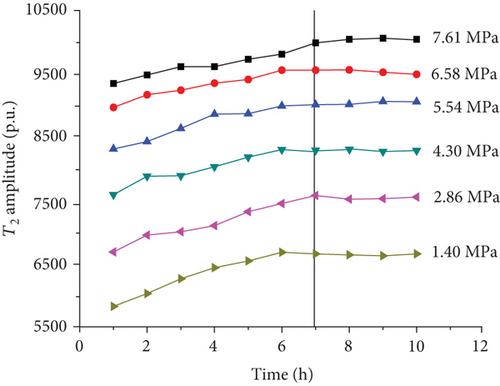
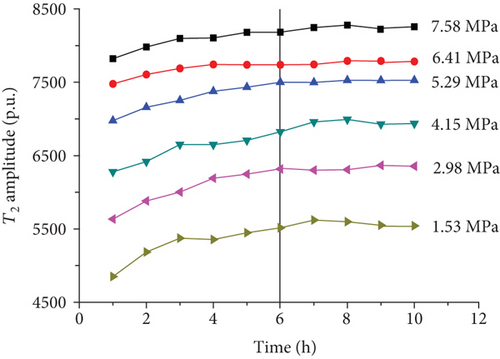
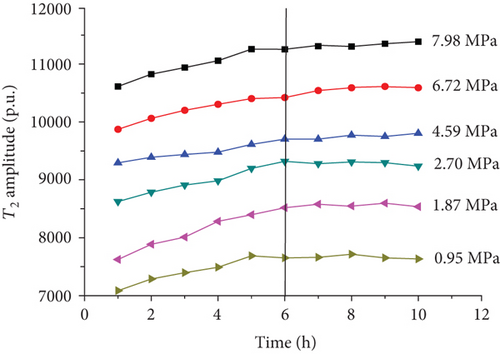
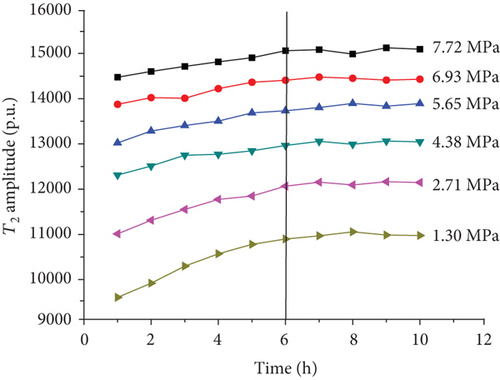
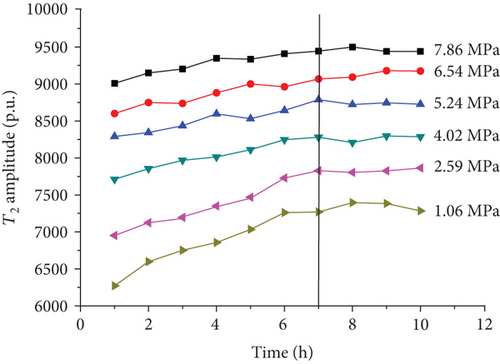
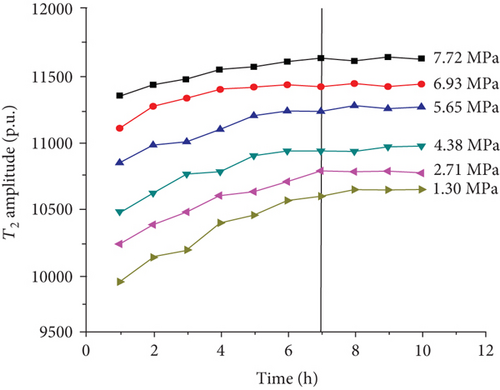
For each coal sample, six experiment pressures were set approximately homogeneous distributed in a range of 0–8 MPa. Ten CPMG measurements were completed in each pressure condition. Figure 8 shows the integrated T2 amplitudes of S1 (“adsorbed methane”) as a function of time after methane addition for each sample. The T2 amplitudes of adsorbed methane (S1) increase rapidly during the first four hours and then increase slowly in the following two or three hours. Finally, the T2 amplitudes of adsorbed methane reached an essentially stable value, which indicates sample entering an equilibrium condition (Figure 8).
4.3. Pore Size Distribution in the Process of Adsorption
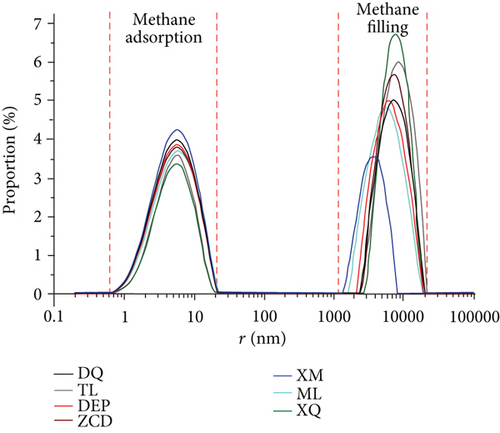
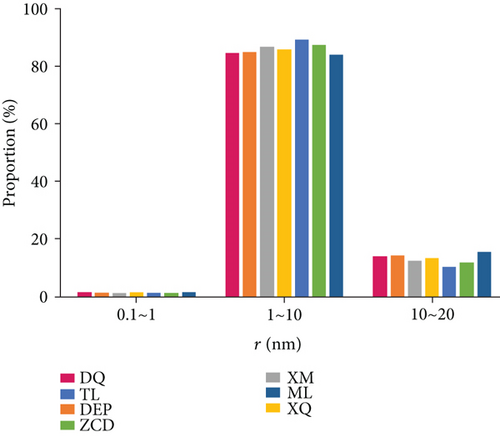
Previous researches proposed that micropores (<2 nm) and mesopores (2-50 nm) are significant for coalbed methane adsorption while macropores (>50 nm) mainly contribute spaces for free gas [54, 55]. In this study, the pore size distribution for each sample was calculated from the NMR data using equation (2). As shown in Figure 9(a), the pore is mainly distributed in two ranges (0.5-20 nm and 1000-20000 nm). The relaxation in pore size range of 1000-20000 nm represents the signal of free gas (i.e., free gas in the intergranular pore or void space), while the signal of adsorption gas exists in pore size range of 0.5-20 nm. The main adsorption spaces of seven samples are all in the range of 1–10 nm (Figure 9(b)). The 10-20 nm pore space contributes less than 20% to methane adsorption. The pore size in the range of 0.1~1 nm only slightly affected the methane adsorption property.
4.4. Influence of Coal Rank on Adsorption by the Modified Low-Field NMR Method
Methane adsorption capacity was affected by multiple factors, e.g., coal rank, maceral composition, and physical and chemical structure. As shown in Figure 10(a), the methane adsorption capacity rose while the coal rank of the sample increased as generally accepted.
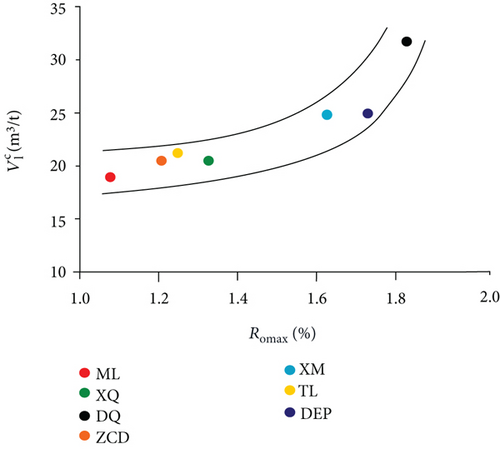
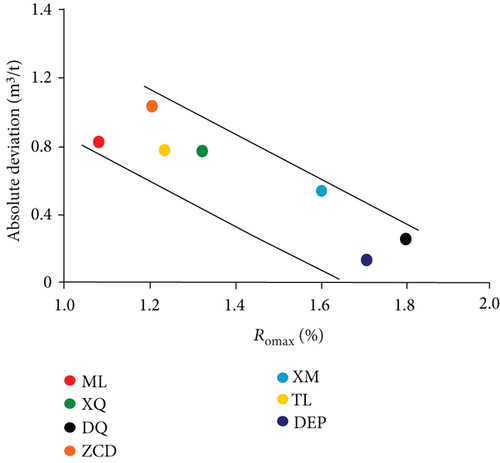
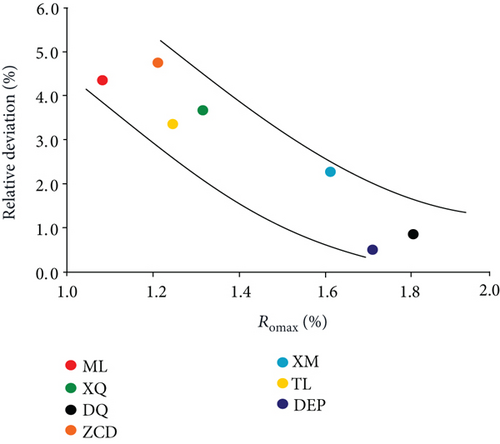
Comparison of the results of adsorption experiments (modified low-field NMR method and volumetric method) shows that the absolute deviations and relative deviations become smaller while the Ro increases (Figures 10(b) and 10(c)). In the range of Ro from 1.08% to 1.80%, the modified low-field NMR method shows a strong selective suitability on relative higher rank coal. Therefore, further work will need to explain the suitability of the low-field NMR method on other coal ranks.
5. Conclusion
Based on the experimental data of the low-field NMR and volumetric method, this paper analyzed the suitability of the modified low-field NMR method in coal. The nuclear magnetic T2 relaxation spectra of coal samples have bimodal structure characteristic. The first peak represents adsorbed methane corresponding to T2 < 1 ms, and the second peak characterizes bulk methane with ranges from 75 ms to 1000 ms. The pore size in the range of 1-10 nm is the main contributor for gas adsorption in medium-rank coals. During the dynamic adsorption process, the T2 amplitude increases rapidly during the first four hours and then increases slowly in the following two or three hours until the sample enters an equilibrium condition. The modified NMR method produced a relatively lower deviation from the volumetric method compared with Yao et al.’s method (2014). The results of modified low-field NMR agrees well with those of the traditional volumetric method that absolute deviations do not exceed 1.03 m3/t while relative deviations are <4.76%. The deviations between the NMR and volumetric method decreased with Ro from 1.08% to 1.80% indicating that the modified low-field NMR method shows a strong selective suitability on relatively higher rank coals in this maturity range.
Conflicts of Interest
The authors declare that they have no conflicts of interest.
Acknowledgments
This research was funded by the National Natural Science Foundation of China (41973077, 41902178, and U1910204); the Natural Science Foundation of Shanxi Province, China (201701D221026, 20181101013); and the Open Fund of Beijing Key Laboratory of Unconventional Natural Gas Geological Evaluation and Development Engineering, China University of Geosciences (Beijing) (2019BJ02001).
Open Research
Data Availability
All data are derived from our experimental results, which can be provided in the appendix of the paper if necessary.


