An Estimation Model for Hydraulic Conductivity of Low-Permeability and Unfilled Fractured Granite in Underground Water-Sealed Storage Caverns
Abstract
The permeability of rock mass is closely related to the stability and safety of underground structure, especially in underground water-sealed storage caverns. With regard to the estimation approaches in predicting the hydraulic conductivity of fractured granite in water-sealed storage caverns, there are some limitations of parameter selection leading to poor applicability. Focusing on the contribution of the water conduction fractures (WCF) to the hydraulic conductivity, we attempted to propose a novel model, the CA model, for estimating its hydraulic conductivity based on the fracture orientation index and the normal stress index by analyzing the borehole wall imaging results and borehole water-pressure test results in the site of underground water-sealed storage caverns. The results indicated that the proposed model is suitable for low-permeability and unfilled fractured granite, exhibiting good effectiveness by clarifying the relation between geomechanical parameters and hydraulic behavior. Further, the parameters upon which the proposed model is based are representative and easy to obtain, which has certain guiding significance and reference value for analyzing the permeability characteristics of similar rock masses.
1. Introduction
At present, many underground water-sealed storage caverns are located in the low-permeability and unfilled fractured granite area. A large number of random joints result in distinct heterogeneity and anisotropy in the permeability of fractured granite. With the abovementioned features of granite, most underground water-sealed storage caverns for oil or liquefied petroleum gas make the groundwater flow in complex fracture networks, forming a stable seepage field by constructing a water curtain system, so as to achieve the long-term storage of oil or liquefied petroleum gas. However, groundwater seepage may not only weaken the granite strength but form local high-pressure seepage resulted from water-sealed conditions, resulting in some geological disasters such as block falling or block sliding.
Therefore, the groundwater seepage characteristics of fractured granite in these water-sealed storage cavern areas become a critical issue to study the stability of surrounding granite and the evolution of seepage field. Specifically, the construction of the seepage medium model, as well as the determination of hydraulic conductivity, is the most essential question. Currently, the seepage medium model of the rock mass can be divided into three categories: the equivalent continuum medium model [1–3], double-medium model [4, 5], and discrete fracture network (DFN) model [6–8]. However, the equivalent continuum model is only applicable to large-scale loose or broken rock with a representative elementary volume (REV). In addition to a small-scale REV, the input parameters of the dual medium model are complex and possess a wide range of assumptions. Meanwhile, the two types of continuous medium models do not involve the specific spatial distribution of the water conduction fractures (WCF), and they are difficult to characterize the heterogeneity and discontinuity of seepage in the rock mass, making them unsuitable for the underground water-sealed storage caverns. Note that the WCF is a class of rock mass fracture belonging to the primary seepage zone. Generally, primary seepage zones are some fractures with high permeability or distinct systematic distributions as well as a combination of the two in rock mass. The DFN model assumes that flow and solute transport occur primarily within fractures [9]. Therefore, by accurately describing the geometric parameters (orientation, spacing and aperture, etc.) and hydraulic parameters (hydraulic aperture, etc.) of each fracture in the fracture network, the geometric and hydraulic characteristics of the WCF can be described. Thus, the heterogeneity and seepage anisotropy of the fractured rock mass can be determined. This model has been widely used in the stability and seepage analysis of high and steep rock slopes and underground caverns with small research areas and requires high research degree and calculation accuracy [10, 11]. In summary, the fractured granite of the underground water-sealed storage cavern can be examined as a fractured seepage network comprising WCF, enabling seepage calculations to be conducted using the DFN model with a calibrated hydraulic conductivity.
Methods for determining the hydraulic conductivity of fractured rock mass mainly include the field hydraulic test method, inverse analysis method, and empirical estimation method. The field hydraulic test method [12, 13] obtains the hydraulic conductivity of rock mass via an analytical calculation of water-pressure test and pumping test data in situ. However, because of its high cost as well as technology and time requirements, its precision and scope are limited, and it is difficult to reflect the hydraulic conductivity characteristics of the rock mass of the entire study area. Meanwhile, the inverse analysis method [14, 15] is based on the monitoring data of groundwater flow rate or velocity. The hydraulic conductivity of a rock mass is calculated via analytical or numerical methods, but it often provides a no-unique solution, which affects the accuracy. Finally, the empirical estimation methods mainly include the fracture network measurement method, fracture network numerical test method, and geological index estimation method. Among these, in the fracture network measurement method [16–18], the geometric parameters of fractures in the measurement and statistic area are substituted into the permeability tensor formula to obtain the initial value of the equivalent permeability tensor, which must then be corrected using the hydraulic test method or inverse analysis method. The fracture network numerical test method [19–21] was proposed by Long et al. [19] to determine the REV and equivalent permeability tensor of rock mass. However, the understanding of the existence and size effect of the REV is not uniform, which makes it difficult to establish the numerical model.
The geological index estimation method can be divided into single index and comprehensive index estimation methods. Currently, many scholars use a single index, such as depth [22, 23], P-wave velocity (Vp) [24], geoelectrical parameters [25], or rock quality designation (RQD) [26, 27], to establish an empirical formula to predict the hydraulic conductivity of rock mass. Moreover, existing estimation models based on the comprehensive index have also made great progress. Hsu et al. [28, 29] defined a comprehensive index HC that considers the RQD, depth index (DI), lithology permeability index (LPI), and gouge content designation (GCD) index and estimated the hydraulic conductivity of fractured sedimentary rock by establishing a power function relationship between the hydraulic conductivity (K) and HC index. Song et al. [30] proposed the RMP index, which considers the RQD, rock integrity designation (RID), fracture aperture designation (AD), and LPI and established a power function relationship to estimate the hydraulic conductivity of the underground water-sealed caverns for liquefied petroleum gas (LPG) engineering site. Chen et al. [31] developed the ZRF model, which considers the buried depth (Z), RQD, and GCD, in order to estimate the hydraulic conductivity of the granite in a hydropower station. Thus, geological index estimation models are simple and practical and have a certain application value in stability and permeability research of rock mass engineering. However, as geological indices of rock mass are adopted mainly to characterize rock mass mechanics, the indices may not be entirely applicable to hydraulic behavior [32]. Therefore, the proposed models lack key parameters, such as the fracture orientation and hydraulic aperture, which control the hydraulic conductivity of rock mass and cannot form a connection between the seepage model of the fractured media and permeability of the fractured rock mass.
Based on the field test results of borehole water-pressure tests and borehole wall imaging tests of rock mass in a underground water-sealed storage cavern, this paper discusses the existing estimation indices and models and innovatively introduces geometric characteristic parameters such as the fracture orientation, number, and aperture of the WCF. Finally, we proposed a new model for estimating hydraulic conductivity that uses normal stress on the WCF and fracture orientation as its basic parameters. In addition, this model examines the influence of RQD, fracture spacing, and density on the permeability of the rock mass by considering the number of fractures. Based on the estimation results, it is proven that the proposed model can accurately reflect the permeability characteristics of fractured granite in the study area, thereby providing a reference for estimating the hydraulic conductivity and engineering application of other rock masses.
2. Hydraulic Conductivity Distribution Characteristics of Rock Mass in the Underground Water-Sealed Storage Caverns
2.1. Geological and Hydrogeological Setting
In this study, the underground water-sealed storage cavern area is situated in the eastern coastal area of Shandong Province, China. The research object of this study is a water-sealed storage cavern for propane on the east side of the project area. As shown in Figure 1, the study area is located in a transition zone between hills and alluvial plains. The altitude of the ground surface ranges from 15 m to 40 m, the topographic slope gradient is less than 5°, and the overall dip direction of the slope is westward. Because of the construction of ancillary facilities on the ground, the surface morphology is required to create a flat with the final elevation of approximately 30 m. In the study area, fine-grained monzonitic granite and marble occurred in the northeast of it, and the surface is covered with thin Quaternary overburden. The grained monzonitic granite was formed in the early stages of the Yanshan period which has a blocky structure and is generally medium to coarse grained. It is relatively hard rock accounting for more than 80% of the cavern rock mass. The rock mass of the slightly weathering layer has high strength, and the fractures range from extremely low developed to low developed. This is the main rock constructing the cavern, and the basic quality grade of the rock mass is II-III. The cavern construction is greatly influenced by secondary faults and joints distributed in the engineering area. According to the survey results of faults and discontinuities, the faults within the cavern site mainly include fault F9 and fracture zone P9. The remaining faults or fracture zones are far from the caverns and are small scale, barely influencing the cavern construction.
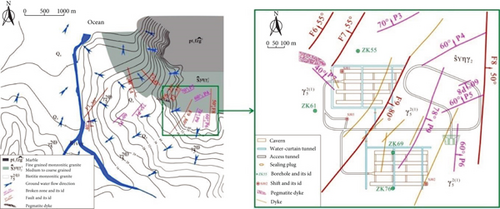
The hydrogeological survey revealed that the groundwater is mainly recharged by the vertical infiltration of atmospheric precipitation and lateral groundwater in mountainous areas, whereas it is mostly discharged by surface runoff with small infiltration. As illustrated in Figure 1, groundwater flows from higher altitudes areas of the eastern mountains to the western and northern regions and finally into the adjacent river and ocean. According to the laboratory and in situ test results, the granite matrix has very low permeability and porosity. Because of the development of joints, the low-permeability value of the rock matrix, and the large hydraulic gradient in the slightly weathered granite, groundwater mainly flows through the complex fracture network. Moreover, it appears to be the primary pathway in some broken areas and fracture concentrated belts. Therefore, the hydrogeological conditions of the study area highly obey the assumption of the fracture network model.
Borehole wall imaging tests were conducted in 28 boreholes using borehole televiewer technology and the latest digital panoramic borehole camera system (DPBCS) [38]. The DPBCS were employed as follows: a digital high-definition camera device in front of the probe can record a continuous, magnetically orientated, digital, 360° color image of the borehole wall. The depth and plane orientation are measured by the wheel and magnetic electronic compass of the DPBCS, respectively, and the annular borehole wall image is obtained. Then, in the flattened pattern, the annular borehole wall image is converted into a two-dimensional panoramic image in the order of N-E-S-W-N. Using the established coordinate system, it is reduced to a real borehole wall image. Finally, image interpretation software can be used to process the image to obtain the orientation, location, geometrical aperture, spacing, and filling content. After completing abovementioned steps, it was found that the fractures of the slightly weathered rock mass were basically closed, and there was no filled medium inside. However, not all the data from DPBCS and interpretation software are available, and geometrical aperture is also difficult to accurately process as the use of rigorous mathematical formulas and interpretation algorithms produce errors. Therefore, this study mainly conducted permeability analyses and hydraulic conductivity estimations based on the fracture orientation, number, spacing, and other geometric parameters.
2.2. Analysis of Borehole Water-Pressure Test Data
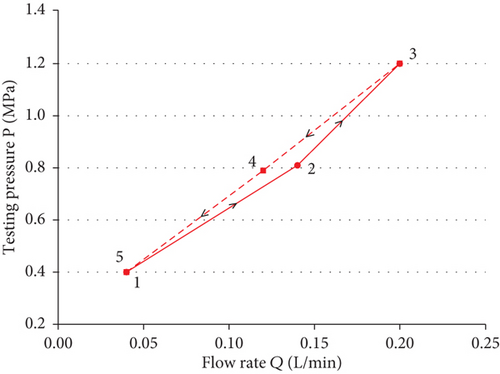
In accordance with the Chinese code of water-pressure tests in boreholes for water resources and hydropower engineering (CCWPT) [39], a total of 609 test sections were then subjected to double-packer water-pressure tests adopted intelligent water-pressure testers. Each test section is divided into three levels of pressure and three or five stages owing to the depth of the test section. Figure 2 shows the basic curve between the test pressure (P) and input flow (Q) of the test section when five stages existed. According to the CCWPT, if the absolute differences in the flow rate between stages 4 and 2 (or between stages 3 and 1 if there are only three stages) and between stages 5 and 1 are less than 1 L/min, or the relative errors are less than 5%, the boost and the buck phases in the P-Q curve can be considered to be basically coincident. In this study, the flow rate of every stage was invariably less than 1 L/min; so, the absolute difference was less than 1 L/min. Thus, the P-Q curves conform to the type of laminar flow, meaning that the fracture water flowing in the low-permeability and unfilled fractured granite was considered to be laminar flow.
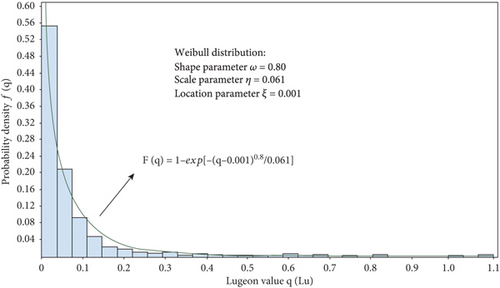
The distribution of the Lugeon values in the fresh or slightly weathered granite is illustrated in Figure 3. A three-parameter Weibull distribution was used to fit the results, revealing a shape parameter of 0.80, a scale parameter of 0.061, and a location parameter of 0.001. In addition, the results show that the permeability of the cavern site is mainly distributed in 0.001–0.20 Lu, with an average of 0.082 Lu and a maximum of 1.098 Lu. Therefore, according to the CCWPT, the rock mass in the study area is mainly low permeability or extremely low permeability.
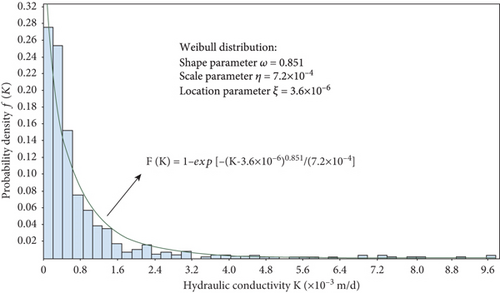
2.3. Applicability of the Single Index Estimation Method of Hydraulic Conductivity
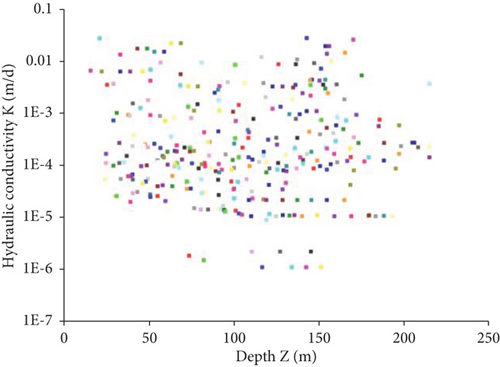
At present, many empirical models use a single index, such as depth (Z or DI), P-wave velocity of rock mass (Vp), or rock quality designation (RQD), to estimate the hydraulic conductivity of rock mass. These indices are mostly based on the relationship between the degree of fracture development and the corresponding index. Then, we explored whether the above indices are suitable for estimating the hydraulic conductivity of fractured granite in the study area.
- (1)
In a small portion of the boreholes, with increasing depth, the hydraulic conductivity of the rock mass remained basically unchanged, only experiencing a very slight fluctuation
- (2)
In a small portion of the boreholes, with increasing depth, the hydraulic conductivity of the rock mass remained basically unchanged, and only in dense local fractures or large fractures did the hydraulic conductivity increase sharply
- (3)
In most boreholes, the hydraulic conductivity of the rock mass changes irregularly with increasing depth, and the relationship between the hydraulic conductivity and depth is disordered
Based on the core logging results of the boreholes and the test results of the P-wave velocity, the average P-wave velocity of the rock mass in each borehole was found to be between 4.8 km/s and 5.2 km/s. Further, it was found that most boreholes are similar to the K-RQD and K-Vp curves of ZK55 shown in Figures 6 and 7, respectively, which both exhibit no obvious regularity and large dispersion.
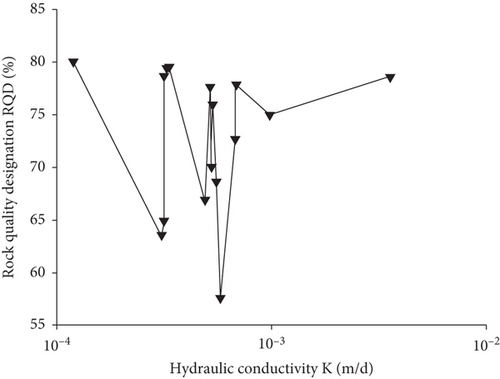
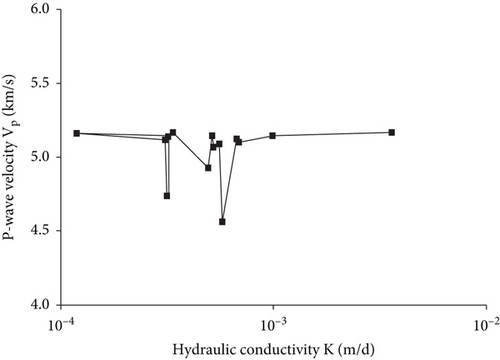
In summary, the single index method of estimating hydraulic conductivity, including the index of depth, RQD, and P-wave velocity, is not suitable to directly estimate the hydraulic conductivity of the rock mass in the study area. Therefore, based on the paradigm of the comprehensive index estimation method, a new estimation model to estimate the hydraulic conductivity of low-permeability and unfilled fractured granite in underground water-sealed storage caverns must be proposed considering the comprehensive effect of multiple indices.
3. Hydraulic Conductivity Estimation Model of Low-Permeability and Unfilled Fractured Granite
3.1. Model Construction and Parameter Selection
Snow [16] considered the number of fractures to reflect the spacing and density of the fractures by superposing the hydraulic conductivity tensor of all the WCF, which is actually the contribution of rock integrity parameters to the hydraulic conductivity. Further, the snow model is suitable for laminar flow and clean fractures, which are consistent with the characteristics of the granite in the study area. Therefore, the snow model can be simplified into two parts: the orientation of all fractures and the hydraulic aperture. According to the superposition principle of the hydraulic conductivity tensor and considering the number of fractures, the fracture orientation index and hydraulic aperture index were tentatively selected to establish a new model for predicting the hydraulic conductivity of the low-permeability and unfilled fractured granite in underground water-sealed storage caverns. The hydraulic aperture is mainly controlled by normal stress, contact area, geometrical aperture, and roughness of the fracture, and it is difficult to determine the hydraulic aperture directly. Previous relevant studies [34, 41, 42] show that the quantitative relationship exists distinctly between normal stress and fracture hydraulic aperture. Fortunately, the normal stress of fractures is relatively easy to obtain in engineering; so, it was selected to replace the index of hydraulic aperture for the construction of the estimation model. Therefore, the normal stress, as a comprehensive index, combined with the orientation index of the discontinuity can comprehensively characterize the hydraulic behavior of the fracture.
The hydraulic conductivity tensor of the rock mass is based on the permeability characteristics of the WCF. However, according to the results of the borehole water-pressure tests and borehole wall imaging tests in the study area, it was found that not all fractures are the WCF, and most have no seepage significance. As the orientation of the WCF determines the primary seepage direction of the rock mass, the fracture network model needs to be characterized emphatically. Therefore, in the case of existing fracture orientation index, the proposed model introduces orientation index of the WCF to characterize the contribution of the hydraulic characteristics of the WCF to the permeability of the rock mass.
3.2. Novel Model for Estimating Hydraulic Conductivity of Fractured Granite in Water-Sealed Storage Caverns
- (1)
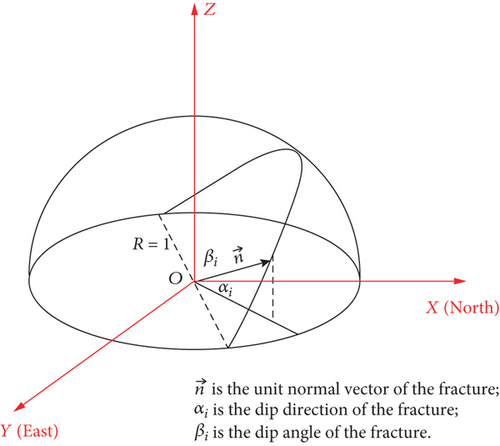
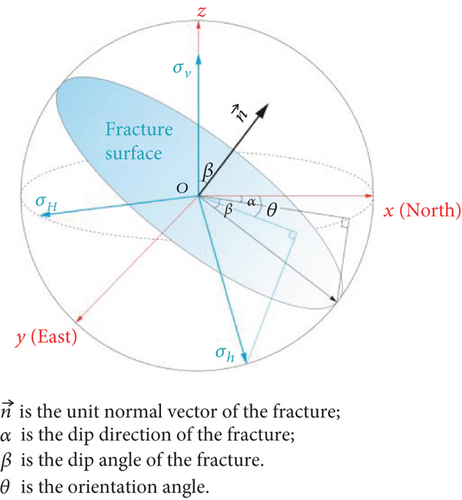
The method for obtaining the index A. It is assumed that the contribution of the orientation of n fractures to the hydraulic conductivity of the rock mass at a certain depth range is An. Based on the principle of permeability tensor superposition, the following formula can be obtained:
- (2)
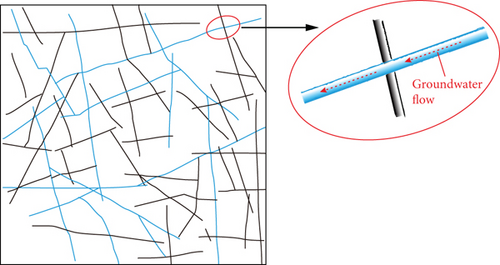
The method for obtaining the index Cwcf. To obtain Cwcf, the identification and selection of WCF should be conducted first to determine the mathematical relationship between the hydraulic parameters of the WCF and the hydraulic conductivity of the rock mass. Firstly, based on borehole wall image tests and water-pressure tests data, the hydraulic conductivity of each test section and internal fractures orientation was obtained. Secondly, the orientation ranges of fractures with a small hydraulic conductivity in the test section need to be screened out, and it was considered that it does not belong to the primary seepage zone. Finally, it was removed from the orientation range of the test sections with large hydraulic conductivity, and what were retained were the WCF and its orientation in each test section. Based on the DFN model of a real discrete fracture network generated using a Monte Carlo simulation by Min et al. [6], Figure 9 represents the WCF selected from fracture network and internal groundwater seepage
To facilitate the calculation in formula (13) and relate the physical meaning of Aj to A, Aj represents the contribution value of the orientation of all the WCF in the test section to the hydraulic conductivity of the rock mass, and the calculation method is the same as that used for the index A. When there is no WCF in the test section, that is, the number N of the WCF in the test section is 0, Cwcf = 0. As the index A includes the contribution of some WCF orientation to the hydraulic conductivity of the rock mass, and because the relationship between the normal stress of the fracture and the hydraulic conductivity of the rock mass obtained by formula (12), it is appropriate to divide Aj into , which not only avoids the issue that the geometric parameter of the WCF repeatedly lead to excessive weights in the estimation of the hydraulic conductivity but also possesses some theoretical and logical basis. The introduction of correction parameters α, β, and γ does not make the three terms of formula (6) have a large difference, especially when Cwcf = 0.
In summary, the hydraulic parameters Aj of the WCF are calculated by formulas (7), (8), and (9), just like index A. Substituting σnj calculated by formula (14) and Aj into formula (13), Cwcf can be easily acquired. According to the CA model, the empirical constants α, β, and γ can be gained from linear regression. Thereby, the estimated hydraulic conductivity K of the CA model is finally obtained.
4. Engineering Application and Reliability Analysis of CA Model
4.1. Parameter Fitting of the CA Model in the Study Area
Based on the interpretation results of borehole wall imaging and water-pressure test data of low-permeability and unfilled fractured granite in situ, we calculated the values of A, Cwcf, and Kin-situ (the in situ test values of hydraulic conductivity from double-packer borehole water-pressure test) of each test section in ZK61 and ZK69, as listed in Table 1. The fracture strike range with low hydraulic conductivity (K < 5 × 10⁻⁵ m/d) was removed from the strike range with high hydraulic conductivity (K > 5 × 10⁻³ m/d), and that of the WCF was obtained as 0°–20°, 30°–50°, 330°–340°, and 350°–360°. In addition, according to the results of the borehole wall image, it was found that the dip direction of the dominant fractures in the rock mass is mainly distributed in the intervals 80°–90°, 110°–140°, and 270°–300°.
| Borehole | Depth [m] | Index A | Index Cwcf | Kin−situ [m/d] |
|---|---|---|---|---|
| ZK61 | 31-41 | 6.899 | 0 | 7.91 × 10⁻⁵ |
| 41-51 | 12.024 | 0 | 9.75 × 10⁻³ | |
| 51-61 | 7.584 | 0 | 3.60 × 10⁻⁴ | |
| 61-71 | 8.087 | 2.53 × 10⁻³ | 4.29 × 10⁻⁴ | |
| 71-81 | 6.563 | 1.34 × 10⁻² | 5.67 × 10⁻⁴ | |
| 81-91 | 3.773 | 5.85 × 10⁻³ | 4.01 × 10⁻⁵ | |
| 91-101 | 6.543 | 5.44 × 10⁻³ | 3.91 × 10⁻⁴ | |
| 101-111 | 2.386 | 7.30 × 10⁻³ | 1.74 × 10⁻⁴ | |
| 111-121 | 2.972 | 7.41×10⁻³ | 4.25 × 10⁻⁴ | |
| 121-131 | 1.791 | 0 | 1.46 × 10⁻⁴ | |
| 131-141 | 5.685 | 3.55 × 10⁻² | 6.85 × 10⁻⁴ | |
| 151-161 | 3.394 | 7.01 × 10⁻³ | 4.12 × 10⁻⁴ | |
| 161-171 | 3.187 | 1.16 × 10⁻³ | 1.55 × 10⁻⁴ | |
| 171-181 | 6.429 | 4.24 × 10⁻³ | 1.90 × 10⁻⁴ | |
| 181-191 | 3.696 | 4.12 × 10⁻³ | 3.99 × 10⁻⁴ | |
| 191-201 | 2.851 | 3.48 × 10⁻³ | 2.97 × 10⁻⁴ | |
| 201-211 | 8.035 | 5.02 × 10⁻³ | 2.09 × 10⁻⁴ | |
| ZK69 | 33-43 | 5.592 | 2.90 × 10⁻² | 1.23 × 10⁻⁴ |
| 42-52 | 6.761 | 1.30 × 10⁻² | 1.22 × 10⁻⁴ | |
| 51-61 | 5.254 | 1.86 × 10⁻² | 9.54 × 10⁻⁵ | |
| 60-70 | 5.367 | 4.30 × 10⁻³ | 2.36 × 10⁻⁴ | |
| 69-79 | 2.826 | 8.72 × 10⁻³ | 2.01 × 10⁻⁴ | |
| 78-88 | 6.147 | 1.80 × 10⁻³ | 4.48 × 10⁻⁴ | |
| 87-97 | 8.933 | 3.27 × 10⁻³ | 1.94 × 10⁻⁴ | |
| 96-106 | 5.094 | 6.54 × 10⁻³ | 6.34 × 10⁻⁴ | |
| 105-115 | 7.738 | 3.07 × 10⁻³ | 8.57 × 10⁻⁴ | |
| 114-124 | 10.473 | 1.96 × 10⁻² | 3.63 × 10⁻⁴ | |
| 123-133 | 5.895 | 3.42 × 10⁻³ | 4.13 × 10⁻⁴ | |
| 132-142 | 3.958 | 0 | 4.37 × 10⁻⁴ | |
| 141-151 | 0.633 | 0 | 1.11 × 10⁻⁴ | |
| 150-160 | 4.931 | 0 | 1.04 × 10⁻⁴ | |
| 159-169 | 1.185 | 1.24 × 10⁻² | 1.48 × 10⁻⁴ | |
| 168-178 | 2.713 | 8.79 × 10⁻⁴ | 1.30 × 10⁻⁴ | |
| 177-187 | 4.574 | 4.13 × 10⁻³ | 2.19 × 10⁻⁴ | |
| 186-196 | 8.045 | 1.34 × 10⁻¹ | 2.65 × 10⁻³ | |
| 195-205 | 8.279 | 1.33 × 10⁻¹ | 2.08 × 10⁻³ | |
| 204-214 | 1.404 | 9.13 × 10⁻² | 1.15 × 10⁻³ | |
| 213-223 | 4.096 | 6.33 × 10⁻³ | 8.40 × 10⁻⁴ | |
The CA model was used to fit the test data of ZK61 and ZK69, and the model parameters are listed in Table 2. The spatial variation characteristics of the regional geological conditions and permeability may be the reason for the different fitting parameters of the CA model in two boreholes. Given that ZK61 and ZK69 are located in the same engineering site, they have similar geological and hydrogeological conditions, and the hydraulic conductivity is mainly concentrated in the magnitude of 10-4–10-3 m/d. Moreover, the CA model was used to fit the two boreholes tests data simultaneously, and the estimation results are in accordance with the test results in situ (R2 = 0.85). Therefore, the model proposed in this study is suitable for projects that have similar engineering geological conditions to that of the water-sealed storage caverns. According to the aforementioned research, the CA model may be more appropriate to estimate the hydraulic conductivity of rock mass with low permeability and internal unfilled fractures.
| Boreholes | α | β | γ | R2 |
|---|---|---|---|---|
| ZK61 | 2.89 × 10⁻⁶ | 1.30 × 10⁻² | 1.95 × 10⁻⁴ | 0.78 |
| ZK69 | 1.84 × 10⁻⁵ | 1.40 × 10⁻² | 9.88 × 10⁻⁵ | 0.74 |
| All | 2.04 × 10⁻⁵ | 1.38 × 10⁻² | 7.40 × 10⁻⁵ | 0.85 |
4.2. Verification and Reliability Analysis of the CA Model
- (1)
The HC model and the RMP model. Existing comprehensive indices or estimation models mainly consider rock integrity (characterized by the RID or RQD), depth index (DI or Z), lithology permeability index (LPI), gouge content designation (GCD), and fracture aperture designation (AD) as basic parameters. To be specific, the HC index and the RMP index are the most representative, as follows:
| Z [m] | 1-RQD | DI | 1-GCD | LPI | KHC model [m/d] |
|---|---|---|---|---|---|
| 35 | 0.36 | 0.840 | 1.0 | 0.150 | 3.55 × 10⁻⁵ |
| 45 | 0.33 | 0.795 | 1.0 | 0.150 | 2.91 × 10⁻⁵ |
| 55 | 0.3 | 0.749 | 1.0 | 0.150 | 2.35 × 10⁻⁵ |
| 65 | 0.18 | 0.703 | 1.0 | 0.150 | 1.07 × 10⁻⁵ |
| 75 | 0.23 | 0.658 | 1.0 | 0.150 | 1.36 × 10⁻⁵ |
| 85 | 0.31 | 0.612 | 1.0 | 0.150 | 1.86 × 10⁻⁵ |
| 95 | 0.19 | 0.566 | 1.0 | 0.150 | 8.51 × 10⁻⁶ |
| 105 | 0.18 | 0.521 | 1.0 | 0.150 | 7.04 × 10⁻⁶ |
| 125 | 0.2 | 0.429 | 1.0 | 0.150 | 6.24 × 10⁻⁶ |
| 135 | 0.14 | 0.388 | 1.0 | 0.150 | 3.32 × 10⁻⁶ |
| 155 | 0.13 | 0.292 | 1.0 | 0.150 | 2.02 × 10⁻⁶ |
| 165 | 0.11 | 0.247 | 1.0 | 0.150 | 1.27 × 10⁻⁶ |
| 175 | 0.15 | 0.201 | 1.0 | 0.150 | 1.47 × 10⁻⁶ |
| 185 | 0.24 | 0.155 | 1.0 | 0.150 | 1.97 × 10⁻⁶ |
| 195 | 0.14 | 0.110 | 1.0 | 0.150 | 5.79 × 10⁻⁷ |
| 205 | 0.23 | 0.064 | 1.0 | 0.150 | 5.46 × 10⁻⁷ |
- (2)
The ZRF model. In addition to considering RQD, the ZRF model introduced Z and GCD to predict the hydraulic conductivity of fractured rock mass at the site of Yagen-II Hydropower Station in China. The expression of the ZRF model is
- (3)
Analysis of the CA model and applicability comparison with other models. Based on the water-pressure test of ZK76, the hydraulic conductivity of rock mass in each depth section was calculated according to formula (3). According to the interpretation results of wall imaging of ZK76, the location and orientation of all fractures in each depth section were obtained. Based on the data of orientation and hydraulic conductivity, the location and orientation of WCF were then picked out. Equations (7)–(9) were used to calculate A and Aj; the normal stress σnj of the WCF was calculated by combining formulas (1) and (14). According to Table 2, the fitting parameters of the CA model are as follows: α = 2.04 × 10⁻⁵, β = 1.38 × 10⁻², and γ = 7.40 × 10⁻⁵. Substituting the above parameters and basic indices into the CA model
| Z [m] | 1-RQD | 1-RID | AD | LPI | KRMP model [m/d] |
|---|---|---|---|---|---|
| 35 | 0.36 | 0.25 | 6.72 × 10⁻⁴ | 0.15 | 4.63 × 10⁻⁴ |
| 45 | 0.33 | 0.18 | 1.04 × 10⁻³ | 0.15 | 4.72 × 10⁻⁴ |
| 55 | 0.30 | 0.14 | 1.23 × 10⁻³ | 0.15 | 4.04 × 10⁻⁴ |
| 65 | 0.18 | 0.11 | 9.75 × 10⁻⁴ | 0.15 | 1.72 × 10⁻⁴ |
| 75 | 0.23 | 0.11 | 7.91 × 10⁻⁴ | 0.15 | 1.78 × 10⁻⁴ |
| 85 | 0.31 | 0.11 | 1.12 × 10⁻³ | 0.15 | 3.11 × 10⁻⁴ |
| 95 | 0.19 | 0.08 | 1.31 × 10⁻⁴ | 0.15 | 2.41 × 10⁻⁵ |
| 105 | 0.18 | 0.08 | 8.97 × 10⁻⁴ | 0.15 | 1.22 × 10⁻⁴ |
| 125 | 0.20 | 0.08 | 5.92 × 10⁻⁴ | 0.15 | 9.29 × 10⁻⁵ |
| 135 | 0.14 | 0.08 | 3.35 × 10⁻⁴ | 0.15 | 4.17 × 10⁻⁵ |
| 155 | 0.13 | 0.08 | 6.73 × 10⁻⁴ | 0.15 | 7.15 × 10⁻⁵ |
| 165 | 0.11 | 0.08 | 2.48 × 10⁻⁴ | 0.15 | 2.60 × 10⁻⁵ |
| 175 | 0.15 | 0.08 | 3.07 × 10⁻⁴ | 0.15 | 4.10 × 10⁻⁵ |
| 185 | 0.24 | 0.08 | 6.92 × 10⁻⁴ | 0.15 | 1.25 × 10⁻⁴ |
| 195 | 0.14 | 0.10 | 8.38 × 10⁻⁴ | 0.15 | 1.12 × 10⁻⁴ |
| 205 | 0.23 | 0.10 | 1.25 × 10⁻³ | 0.15 | 2.43 × 10⁻⁴ |
| Z [m] | 1-RQD | 1-GCD | PD | KZRF model [m/d] |
|---|---|---|---|---|
| 35 | 0.36 | 1.0 | 0.36 | 3.01 × 10⁻⁴ |
| 45 | 0.33 | 1.0 | 0.33 | 2.06 × 10⁻⁴ |
| 55 | 0.3 | 1.0 | 0.30 | 1.47 × 10⁻⁴ |
| 65 | 0.18 | 1.0 | 0.18 | 6.53 × 10⁻⁵ |
| 75 | 0.23 | 1.0 | 0.23 | 7.63 × 10⁻⁵ |
| 85 | 0.31 | 1.0 | 0.31 | 1.07 × 10⁻⁴ |
| 95 | 0.19 | 1.0 | 0.19 | 5.00 × 10⁻⁵ |
| 105 | 0.18 | 1.0 | 0.18 | 4.34 × 10⁻⁵ |
| 125 | 0.2 | 1.0 | 0.20 | 4.18 × 10⁻⁵ |
| 135 | 0.14 | 1.0 | 0.14 | 2.81 × 10⁻⁵ |
| 155 | 0.13 | 1.0 | 0.13 | 2.36 × 10⁻⁵ |
| 165 | 0.11 | 1.0 | 0.11 | 2.00 × 10⁻⁵ |
| 175 | 0.15 | 1.0 | 0.15 | 2.38 × 10⁻⁵ |
| 185 | 0.24 | 1.0 | 0.24 | 3.75 × 10⁻⁵ |
| 195 | 0.14 | 1.0 | 0.14 | 2.05 × 10⁻⁵ |
| 205 | 0.23 | 1.0 | 0.23 | 3.25 × 10⁻⁵ |
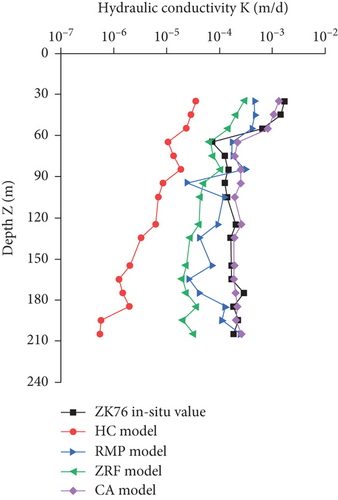
The prediction result of hydraulic conductivity of ZK76 has been listed in Figure 11, which also involved the estimation results of the HC model, RMP model, ZRF model, and in situ measured values of ZK76. It can be seen that the new CA model provides significantly better results than the existing models. Specifically, the root mean square error of the CA model is 3.76 × 10⁻⁵ m/d, which is far less than that of the HC, RMP, and ZRF models (respectively, 1.46 × 10⁻⁴ m/d, 1.02 × 10⁻⁴ m/d, and 1.24 × 10⁻⁴ m/d), and the relative errors are 45.0%, 95.8%, 64.1%, and 70.6%, respectively. Thus, the CA model is more suitable and accurate in estimating the hydraulic conductivity of low-permeability and unfilled fractured granite in underground water-sealed storage caverns.
5. Discussion
Existing comprehensive indices or models are not suitable for the low-permeability and unfilled fractured granite in underground water-sealed storage caverns as the aforementioned LPI and GCD lead to a weak representation and poor correlations between the geological parameters and the hydraulic conductivity, resulting in large estimation errors. Although the RMP model has been proposed for fractured granite of LPG caverns in adjacent areas, it commonly overestimated the contribution of rock integrity to the hydraulic conductivity by simultaneously adding the RQD and RID parameters. Therefore, the randomness of discontinuities causes large fluctuations in the hydraulic conductivity of the rock mass at different depths by affecting the integrity of rock mass. In addition, the fracture aperture designation is difficult to measure, which may be another cause of errors.
Compared with existing models, the CA model considers the characteristics of the seepage fracture network model of the rock mass. Based on the snow model, the number of fractures is introduced to reflect the integrity of the rock mass, and the orientation of fractures is considered to reflect the permeability of the rock mass. Moreover, the proposed model considers the characterization of mechanical and hydraulic properties of the rock mass and has a certain theoretical basis. Simply put, the CA model has only two basic parameters: fracture orientation index (A) and normal stress index (σn), which can be easily obtained using test data in situ. Thus, it is reliable to estimate the hydraulic conductivity of the cavern granite. However, this model is dependent on the number and accuracy of the in situ data, and it may be difficult to identify the WCF. Therefore, an accurate screening method for the WCF must be explored.
A sensitivity analysis of the fracture orientation index and normal stress index of the model indicated that the change in the hydraulic conductivity caused by σn is much larger than that caused by A when the two parameters change by the same multiple. This shows that the influence of the normal stress of the fracture on the rock mass permeability is greater than that on the fracture orientation. This is because the normal stress controls the magnitude of the permeability of the rock mass, whereas the fracture orientation determines the seepage direction. Further, it shows that the normal stress index selected in this study is reasonable to construct the new model.
6. Conclusions
- (1)
Existing models have difficulty accurately reflecting the hydraulic conductivity characteristics of low-permeability and unfilled fractured granite in underground water-sealed storage caverns. The rock mass was regarded as a fractured network comprising WCF; using the test data of borehole wall imaging and water-pressure tests of fractured granite of an underground water-sealed storage caverns, the fracture orientation index and normal stress index were selected as basic parameters, and the CA model for estimating hydraulic conductivity was established by introducing the WCF contribution index Cwcf
- (2)
The hydraulic conductivity of ZK76 in the study area was estimated using the CA model to determine its reliability. Compared with the existing models, the estimation results of the CA model were closest to the in situ measured values which have a high accuracy. Further, it is extremely suitable for estimating the hydraulic conductivity of low-permeability and unfilled fractured granite in underground water-sealed storage caverns which can also be applied for similar rock mass
- (3)
The paper proposed a screening method of the water conduction fractures (WCF) that mainly consists of the following steps. Firstly, the appropriate method should be used to determine the hydraulic conductivity of each test sections. Secondly, the strike and orientation of internal fractures were obtained based on survey results of borehole wall image tests and water-pressure tests. Thirdly, the fracture strike range in the test section with low hydraulic conductivity was removed from the strike range with high hydraulic conductivity, and the WCF in rock mass was then identified. In addition, the study indicated that the WCF orientation can be determined only by the dominant fractures orientation in the study area of the underground water-sealed storage caverns
- (4)
A sensitivity analysis of the parameters of the CA model revealed that the influence of the normal stress of the fracture on the permeability of rock mass is greater than the fracture orientation
Conflicts of Interest
The authors declare that there is no conflict of interest regarding the publication of this paper.
Acknowledgments
This study was funded by the Natural Science Foundation of Fujian Province of China (Grant No. 2019J05036 and No. 2020J05133), the Geological Research Project of Bureau of Geology and Mineral Exploration and Development Guizhou Geological of China (Qiandikuang Kehe [2020] No. 1), and the Fuzhou University Testing Fund of Precious Apparatus (Grant No. 2020T007).
Open Research
Data Availability
The data used to support the findings of this study are available from the corresponding author upon request.


