[Retracted] Intelligent Analysis of Core Identification Based on Intelligent Algorithm of Core Identification
Abstract
The communication recognition of mobile phone core is a test of the development of machine vision. The size of mobile phone core is very small, so it is difficult to identify small defects. Based on the in-depth study of the algorithm, combined with the actual needs of core identification, this paper improves the algorithm and proposes an intelligent algorithm suitable for core identification. In addition, according to the actual needs of core wire recognition, this paper makes an intelligent analysis of the core wire recognition process. In addition, this paper improves the traditional communication image recognition algorithm and analyzes the data of the recognition algorithm according to the shape and image characteristics of the mobile phone core. Finally, after constructing the functional structure of the system model constructed in this paper, the system model is verified and analyzed, and on this basis, the performance of the improved core recognition algorithm proposed in this paper is verified and analyzed. From the results of online monitoring and recognition, the statistical accuracy of mobile phone core video recognition is about 90%, which has higher accuracy in mobile phone core image recognition than traditional recognition algorithms. The core line recognition algorithm based on deep learning and machine vision is effective and has a good practical effect.
1. Introduction
In recent years, with the advent of the era of smart mobility, smartphone applications have become more and more widespread, the frequency of use has become higher and higher, and the overall power consumption has been increasing. Limited by battery capacity, smartphones need to be charged frequently, the demand for mobile phone charging data lines per capita is more than 3, and the sales of data line products continue to increase. As of 2020, there are more than 2,000 data cable manufacturers with an annual output value of more than 60 billion yuan. The industrial scale accounts for more than 90% of the global data cable production. Therefore, China is a global data cable manufacturing base. As of the end of 2018, 70% of the members of the US USB-IF Association came from Chinese companies [1]. USB-IF is the American USB Standardization Organization, and its full name is USB Implementers Forum.
At present, the production process of mobile phone core lines in China is mainly completed by semiautomatic equipment. In the production process, it is necessary to use an industrial camera to continuously collect images to determine the position of several wires and to assist in the branching work. However, there are chromatic aberrations in different batches of mobile phone core wires, and in different time periods, different illuminations will also produce chromatic aberrations. Meanwhile, a lot of white dust is attached to the surface of several wires, which will cause a great interference to color recognition. Therefore, the current misjudgment rate of the position of several wires of this type of equipment is very high, resulting in a large number of defective products in the production process. Moreover, in the current production process, whether there is any leakage of copper wires when several wires are riveted to the terminal inserts needs to be manually detected. After a long time of work, the human eyes are prone to fatigue, which causes false detection and low manual operation efficiency. Mobile phone core wire manufacturers are actively introducing or developing efficient machine vision technology to improve the recognition rate of the positions of several wires and realize automatic detection of copper wire riveting. However, there has been no substantial progress. The main reason why the recognition rate of the positions of several wires cannot be improved is mainly due to color difference and white dust interference [2]. The main reason why the automatic detection of copper wire riveting cannot be realized is that the copper wire and the riveting piece are made of metal, and the colors are similar, which cannot be clearly distinguished in the image. In summary, the color difference of the core wire of the mobile phone, the white dust on the surface, the copper wire of the same material, and the riveting piece of similar color all interfere with the automatic production and detection of the core wire of the mobile phone [3].
In the welding process of data line terminal and core wire communication, the quality of the solder joint is an important factor affecting the final qualification of data line. In addition, the position correspondence between the data line core and the internal solder joint of the terminal is also an important factor in determining whether the data line is qualified or not. If the position relationship between the data cable core and the internal solder joint of the terminal is not accurate during the welding process, the data cable will inevitably fail to achieve its due function and meet the quality standard and will eventually be treated as waste. If it continues to be misused, the electronic equipment connected to it will be at risk of damage. More importantly, it may cause fire and explosion, which will seriously damage the user’s life and property. Therefore, in the production process of communication data cable, the realization of fast, accurate, and effective welding between data cable core and terminal is not only related to the production efficiency of data cable but also related to the safety of people’s life and property. However, the production equipment technology of most data line production enterprises in China is relatively backward, and the degree of automation is low, resulting in overcapacity of low-end products, fierce competition in the data line market, more general-purpose products, and less high-tech and high value-added products [4]. Therefore, in view of this situation, it is necessary to solve the problem of core line sequencing in the production process of USB data line and realize its automation, improve production efficiency, and further improve the competitiveness of China’s data line industry. In the era of rapid development of robot technology, some modern forms of intelligent factories and unmanned workshops emerge one after another. In addition, automated products are also widely used in all walks of life, and more and more forms of automation appear in our surrounding companies. With the rapid development of China’s economy and the rising labor cost, a large number of labor-intensive industries are gradually transferred overseas. Therefore, among data line manufacturers, increasing production demand and pursuing low production costs have begun to become the company’s inventory model [5].
With the support of in-depth learning algorithm, this paper constructs a communication core line recognition system suitable for automatic recognition, which can be used in the manufacturing industry.
2. Related Work
In a visual image, the edge of the image contains most of the information, such as the location, angle, and shape of the target product. By using different edge detection algorithms, edge information with different accuracy can be obtained. After the research of and scholars, there are many methods that can be used for image edge detection. In order to improve the speed of edge detection, literature [6] proposed a method of approximate calculation of image difference using Krawtchouk polynomial to achieve edge detection. Literature [7] designed an automatic fingerprint recognition algorithm based on edge detection, which has high accuracy and good detection effect. Literature [8] proposed an edge detection algorithm applied to noncontact workpiece detection, which is described as a median filter algorithm that collects two images, applies a one-dimensional filter in the horizontal and vertical directions, and then takes the average value. Literature [9] proposed a character recognition algorithm and shadow removal technology based on edge detection, which are applied to license plate recognition in intelligent transportation systems. Literature [10] designed a vision system for detecting whether materials are assembled on an automatic assembly line, used the Canny operator to detect the edges of assembly materials, and proposed a method to measure the geometric characteristics of a circular target using the Hough transform method. In order to solve the existing problems of Gaussian filtering parameters that are difficult to set, false edges are prone to appear, and local noise is difficult to eliminate when the traditional Canny operator detects edges. Literature [11] proposed an improved algorithm. The algorithm uses wavelet transform to remove noise interference and uses extreme median filter instead of Gaussian filter for edge detection.
Image segmentation is to separate the target from the background. The method proposed in the literature [12] is to detect the local minimum based on the Euclidean distance transform of the binary image of the grain. Then, it uses the morphological expansion operator to merge the local minimum points to obtain the internal area of each grain. Finally, it connects the boundary of the region into an initial curve, which is trained by the active contour model and evolves into the boundary curve of the grain so as to achieve the effect of dividing each rice grain. From a visual point of view, image classification is to preprocess the image, such as improving contrast and morphological noise reduction, and then accurately interpret and interpret the target type according to the characteristics of image brightness, hue, and location [13]. Literature [14] used the Fisher discriminant method to project the multidimensional feature vector into one-dimensional space and then used the K-means clustering algorithm for recognition. From the experimental results, it is known that the accuracy of its purity recognition is higher than 94%. Target positioning is followed by image classification, and it is mainly to further determine and identify the pixel coordinate position and size of the specific centroid of the part of interest in the image. The main principle of the method proposed in literature [15] is to threshold the image first, calculate the shape description parameters of the binary image contour, and find all the bright strip objects in the image. After that, it uses the HSV color space to find the region of interest and then compares whether the target is within the approximate range of the HSV and RGB parameters that meet the required pixels. The method proposed in literature [16] uses the image color feature to segment the image, determine the contour moment, determine the centroid coordinates according to the contour moment, and then segment the image according to the high image color characteristics.
2.1. Extraction of Image Regions of Interest
The image region of interest (ROI) refers to the target area in a picture, which plays a role in reducing the interference of background information to improve the efficiency and accuracy of image processing and detection. When the core wire of the data cable is used as the research object, there will be effects of chromatic aberration, vibration, and noise on the image acquisition process. This paper chooses to use image graying, morphological opening and closing operations, and threshold segmentation to obtain high-quality pictures of interest as the research goals.
The color value of each pixel on the grayscale image is also called grayscale, which refers to the color depth of the midpoint of the black-and-white image, generally ranging from 0 to 255, 255 for white and 0 for black. The so-called gray value refers to the intensity of color, and the gray histogram refers to the number of pixels with the gray value corresponding to each gray value in a digital image. Image degradation is the process of transforming an image from an ideal image to an actual defective image for some reason. Image restoration is the process of improving the degraded image and making the restored image close to the ideal image as much as possible.
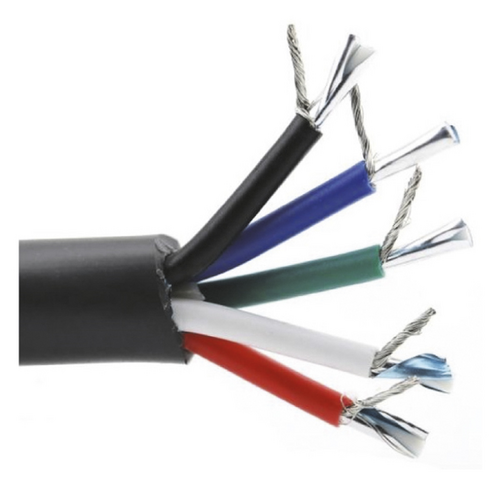
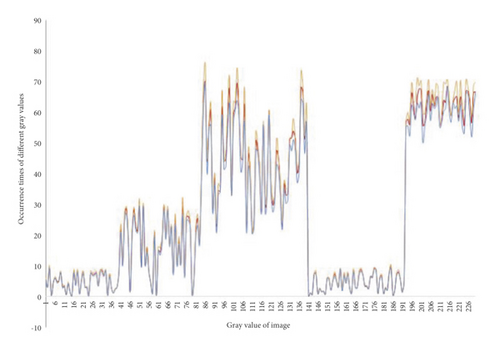
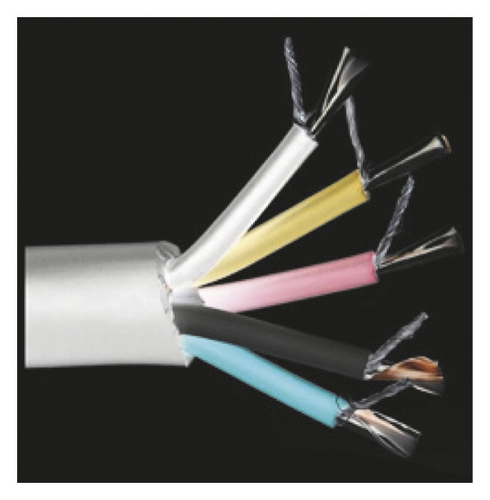
The color image (shown in Figure 1) is stored in a multichannel array. Among them, the element in each channel can take a value from 0 to 255. Then, for the RGB channels of a color image, a three-channel histogram can be used to describe the proportions of different colors in the image. The color image (shown in Figure 1) is stored in a multichannel array. Among them, the element in each channel can take a value from 0 to 255. Then, for the RGB channels of a color image, the three-channel histogram can describe the proportion of its different colors in the image. As shown in Figure 2, the horizontal is the gray value of the image, its value range is 0–255, and the vertical is the number of occurrences of different gray values [17].
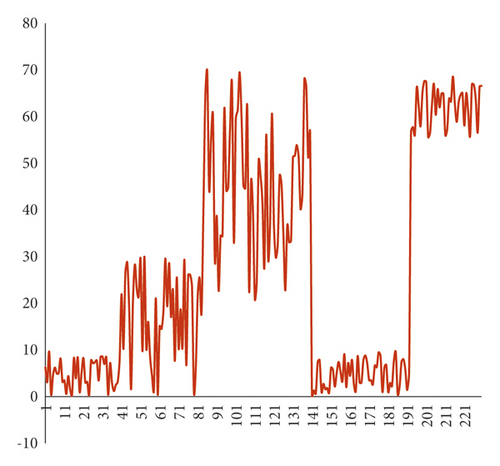
Since each channel element is arranged in the matrix row and column order, the morphological characteristics of the image cannot be reflected, and it needs to be converted into a grayscale image. The grayscale image can reflect the characteristics and distribution of the overall and partial brightness and chromaticity levels of the image and can reduce the calculation time and calculation amount of color space conversion. For grayscale images, the 256-level transformation of grayscale ranges from 0 to 255, which does not contain any color information. At this time, the grayscale histogram is shown in Figure 3, the horizontal is the gray value of the image, its value range is 0–255, and the vertical is the number of occurrences of different gray values [18].
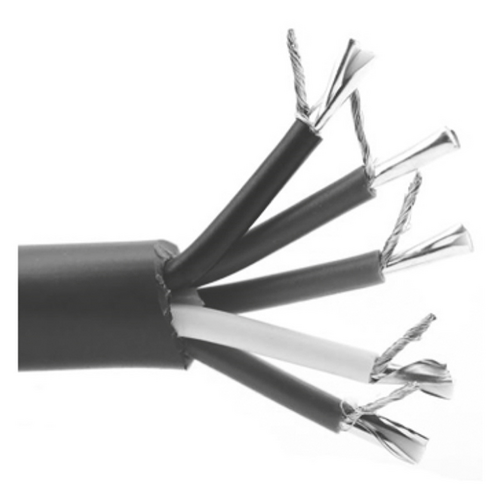
According to the above distribution method, the grayscale processing result of the color image obtained is shown in Figure 4 [19].
In image processing, threshold segmentation is to achieve the separation of target and background. The main principle is to use the difference in grayscale to divide the pixel level of the core area into several parts, which is convenient for converting the grayscale image into a binary image. That is, it is judged whether the characteristic attribute of each pixel in the image is within the target threshold range so as to determine the target area and the background area.
Among them, the gray value of each point of the original image is H(i, j), and the gray value after threshold judgment is F(x, y). Its advantage is that it is simple to calculate, it can use connected boundaries to define nonoverlapping and closed regions, and it can better segment the target and background with strong contrast.
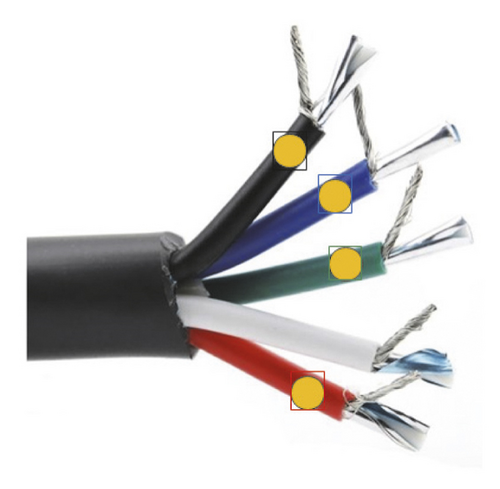
In addition, for binary images, it is necessary to mark the regions composed of pixels that meet the four-neighborhood connectivity criterion or the eight-neighborhood connectivity criterion with different unique labels. Therefore, the labeling method of connected regions is introduced. It is to assign unique label numbers to multiple target areas in a binary image. Moreover, it mainly prepares for the next step of positioning and matching by making relevant numerical analysis and parameter statistics on the characteristics of the connected area corresponding to each label number. According to the same criterion, in order to make the result error relatively small and closer to the perception of the human eye, the eight-neighborhood connectivity criterion is selected to label the image. The range of interest found according to the threshold is surrounded by a purple line as shown in Figure 5.
Mathematical morphology operation is to use the properties of point sets, integral geometric sets, and topology theory to transform object pixel sets. The most basic operations of morphology are dilation and erosion (Dilation and Erosion), which are often used for noise reduction, segmentation, maximum or minimum value regions, and image gradients. From a mathematical definition, the operation of convolving an image (or a part of the image, denoted by A) and the kernel (denoted by B) is a morphological operation. Among them, kernel B can have any shape and size, and the anchor point is a separately defined reference point. Similarly, the kernel can also be called a template or mask [21].
The local maximum operation of convolution between kernel B and graphics is called dilation; that is, the maximum pixel value of the area covered by kernel B is found and used as the pixel designated by the reference point. This increases the area around the core wire, as shown in Figure 6. For a multichannel image, the mathematical expression of the maximum value in the sliding window area is shown in equation (3). The corrosion operation is the inverse operation, which reduces the original area, so the corrosion is the operation to find the local minimum, as shown in Figure 7. The multichannel data is separated and processed, and the mathematical expression of the minimum value in the sliding window area is shown in formula (4):

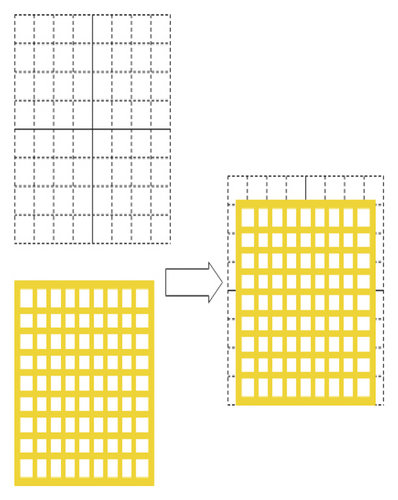
Corrosion is mainly used to remove some parts of the image in morphology. The etching operation is to take the central position of the structural element (assuming that the element participating in the logical calculation corresponds to the point with element 1 in the two-dimensional matrix, that is, the hole on the grid plate). When moving on the image, if the lower image can be seen through all holes, the image at the central point will be retained; otherwise, it will be removed.
The opening operation is to perform the first corrosion operation and then the expansion operation on the image, which is mainly to eliminate the details of the image that are smaller than the structural elements when the local shape of the object remains unchanged. Under normal circumstances, when the background is brighter, it can exclude small-area objects, eliminate isolated points higher than the near point, denoise and smooth the contour of the object, and break the narrow neck. The closing operation is to expand the image first and then corrode. Its function is to be able to sort small black holes (black areas) and eliminate isolated points below the collar near point. Moreover, it can also denoise and smooth the contours of objects, bridge narrow discontinuities and slender gullies, eliminate small holes, and fill in the breaks of contour lines [23].
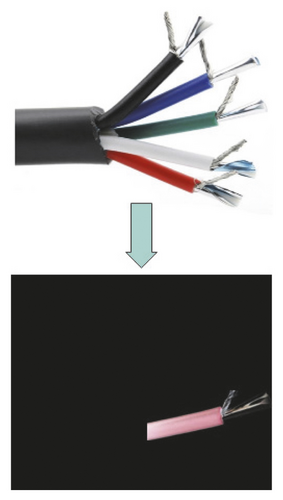
Based on the above opening and closing operations, this paper gives an effect diagram of a core wire. Figure 8 shows the opening and closing operation diagram of the green core wire.
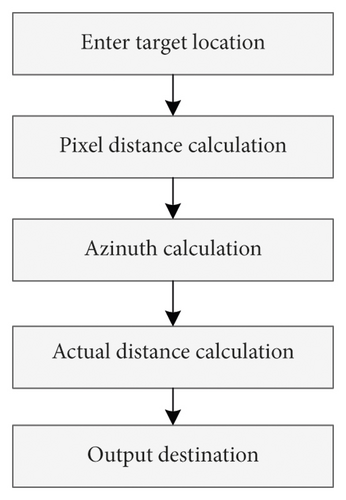
In the case that the color of the image has been recognized, the target positioning of different colors still needs to be improved. According to the existing sorting system, the positioning is divided into three parts, including pixel distance calculation, azimuth angle calculation, and actual distance calculation. The system takes the position information of the target in the figure as input and the actual position of the target as output. The process is shown in Figure 9.
Since the appearance of the core wire to be inspected is a cylinder, the orientation of the core wire can be calculated using the spindle positioning method.
For the existing formula, the process is shown in Figure 10.
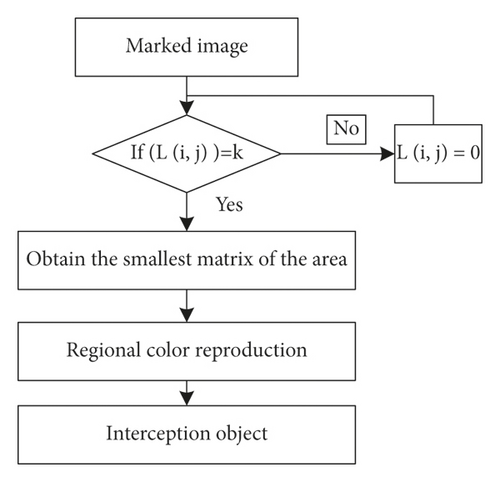
After the program is executed, the actual interception and positioning effect diagram is shown in Figure 11.
2.2. Core Line Recognition Based on Deep Learning and Machine Vision
This paper uses deep learning to realize the intelligent recognition of the core wire of the mobile phone and improves the traditional algorithm. According to the actual demand of the core wire recognition, this paper conducts an intelligent analysis of the core wire recognition process. After constructing the functional structure of the system in this paper, the system model of this paper is verified and analyzed. On this basis, the performance verification and analysis of the improved core wire recognition algorithm proposed in this paper are carried out. This paper obtains multiple sets of core wire pictures from a certain manufacturer and conducts real-time video surveillance during the manufacturing process of mobile phone core wires. The picture has been marked by the quality inspector, so the image recognition result can be compared with the image marking result so that the accuracy of the algorithm constructed in this paper can be analyzed. The results of video monitoring can be compared with the results of the on-site quality inspector, and the accuracy rate can be calculated. Therefore, the main quantitative parameter of this paper is the accuracy rate of core wire recognition, and the corresponding table and the corresponding statistical diagram are drawn.
The image recognition and analysis of the core wire of the mobile phone are carried out in the form of system simulation, and the results are shown in Table 1 and Figure 12.
| Num | Accuracy(%) | Num | Accuracy(%) | Num | Accuracy(%) |
|---|---|---|---|---|---|
| 1 | 98.245 | 34 | 95.236 | 67 | 98.019 |
| 2 | 98.810 | 35 | 95.442 | 68 | 95.873 |
| 3 | 97.985 | 36 | 98.364 | 69 | 96.246 |
| 4 | 95.144 | 37 | 98.216 | 70 | 96.483 |
| 5 | 96.520 | 38 | 96.727 | 71 | 95.590 |
| 6 | 97.136 | 39 | 97.046 | 72 | 96.256 |
| 7 | 98.740 | 40 | 97.685 | 73 | 96.481 |
| 8 | 95.122 | 41 | 97.055 | 74 | 98.916 |
| 9 | 97.054 | 42 | 98.625 | 75 | 95.809 |
| 10 | 96.087 | 43 | 97.719 | 76 | 96.823 |
| 11 | 95.038 | 44 | 98.562 | 77 | 96.145 |
| 12 | 96.695 | 45 | 98.732 | 78 | 96.866 |
| 13 | 98.480 | 46 | 98.306 | 79 | 98.545 |
| 14 | 95.305 | 47 | 97.842 | 80 | 95.527 |
| 15 | 98.353 | 48 | 98.272 | 81 | 95.542 |
| 16 | 98.312 | 49 | 98.119 | 82 | 98.798 |
| 17 | 97.445 | 50 | 98.574 | 83 | 95.576 |
| 18 | 97.302 | 51 | 95.051 | 84 | 97.478 |
| 19 | 95.993 | 52 | 97.510 | 85 | 97.702 |
| 20 | 97.342 | 53 | 96.593 | 86 | 97.148 |
| 21 | 96.231 | 54 | 95.245 | 87 | 98.526 |
| 22 | 96.937 | 55 | 97.531 | 88 | 98.781 |
| 23 | 98.610 | 56 | 96.172 | 89 | 95.225 |
| 24 | 97.449 | 57 | 96.935 | 90 | 98.537 |
| 25 | 96.595 | 58 | 98.814 | 91 | 96.467 |
| 26 | 95.676 | 59 | 97.762 | 92 | 96.096 |
| 27 | 98.423 | 60 | 98.036 | 93 | 97.887 |
| 28 | 98.370 | 61 | 96.399 | 94 | 95.485 |
| 29 | 97.356 | 62 | 98.021 | 95 | 95.392 |
| 30 | 98.412 | 63 | 97.086 | 96 | 95.534 |
| 31 | 96.584 | 64 | 96.888 | 97 | 98.626 |
| 32 | 98.332 | 65 | 97.208 | 98 | 98.482 |
| 33 | 98.289 | 66 | 96.548 | 99 | 96.237 |
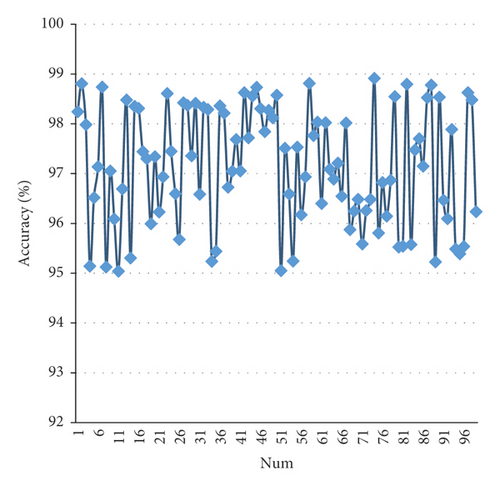
According to Table 1, statistical table of image recognition accuracy of mobile phone core, the image recognition accuracy coefficient is always controlled at 95%. Figure 12, statistical chart of image recognition accuracy of mobile phone core line visually, shows this result. It can be seen from the above experimental statistical results that the core line recognition algorithm proposed in this paper has a high accuracy rate in the image recognition of mobile phone core wires, and the accuracy rate is above 95%. After that, this paper uses the system constructed in this paper to conduct real-time video monitoring on the production line, and the statistical recognition accuracy rate is shown in Table 2 and Figure 13.
| Num | Accuracy (%) | Num | Accuracy (%) | Num | Accuracy (%) |
|---|---|---|---|---|---|
| 1 | 89.818 | 34 | 88.409 | 67 | 87.792 |
| 2 | 91.624 | 35 | 92.249 | 68 | 91.329 |
| 3 | 88.792 | 36 | 92.415 | 69 | 86.912 |
| 4 | 84.645 | 37 | 89.457 | 70 | 87.729 |
| 5 | 84.939 | 38 | 89.808 | 71 | 91.430 |
| 6 | 85.608 | 39 | 93.669 | 72 | 94.868 |
| 7 | 91.331 | 40 | 85.878 | 73 | 88.231 |
| 8 | 87.822 | 41 | 91.180 | 74 | 86.106 |
| 9 | 91.007 | 42 | 85.682 | 75 | 89.312 |
| 10 | 85.994 | 43 | 85.621 | 76 | 84.634 |
| 11 | 90.507 | 44 | 92.548 | 77 | 87.151 |
| 12 | 86.791 | 45 | 91.672 | 78 | 93.515 |
| 13 | 88.587 | 46 | 89.276 | 79 | 92.937 |
| 14 | 86.703 | 47 | 84.619 | 80 | 89.360 |
| 15 | 91.363 | 48 | 87.226 | 81 | 94.987 |
| 16 | 91.975 | 49 | 86.193 | 82 | 85.161 |
| 17 | 85.048 | 50 | 92.526 | 83 | 91.125 |
| 18 | 90.125 | 51 | 90.632 | 84 | 90.189 |
| 19 | 86.217 | 52 | 92.853 | 85 | 87.687 |
| 20 | 85.332 | 53 | 85.348 | 86 | 89.823 |
| 21 | 86.677 | 54 | 94.337 | 87 | 94.470 |
| 22 | 91.841 | 55 | 90.607 | 88 | 89.024 |
| 23 | 84.078 | 56 | 88.508 | 89 | 94.014 |
| 24 | 90.532 | 57 | 84.211 | 90 | 91.598 |
| 25 | 89.492 | 58 | 93.806 | 91 | 91.856 |
| 26 | 92.494 | 59 | 89.571 | 92 | 92.215 |
| 27 | 94.653 | 60 | 87.181 | 93 | 85.849 |
| 28 | 85.159 | 61 | 85.553 | 94 | 85.589 |
| 29 | 89.444 | 62 | 89.730 | 95 | 85.119 |
| 30 | 85.811 | 63 | 84.465 | 96 | 88.875 |
| 31 | 84.896 | 64 | 91.604 | 97 | 89.439 |
| 32 | 93.207 | 65 | 84.853 | 98 | 87.457 |
| 33 | 85.187 | 66 | 90.342 | 99 | 88.458 |
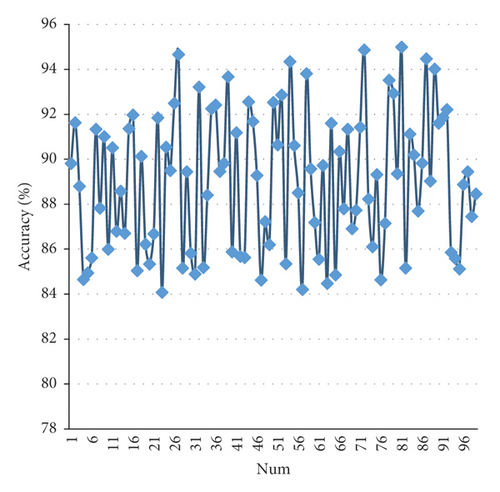
From the results of online monitoring and recognition, the statistical results of mobile phone core video recognition accuracy fluctuate around 90%, and the core recognition algorithm has high accuracy in mobile phone core image recognition. The core line recognition algorithm based on deep learning and machine vision is effective, and the actual effect is very good.
3. Conclusion
The recognition of the core wire of the mobile phone is a test of the development of machine vision. Generally speaking, the size of the core wire of the mobile phone is very small, so it is difficult to identify the small flaws in it. Based on the deep learning algorithm, this paper combines the actual requirements of core wire recognition to improve the algorithm and proposes an intelligent system suitable for core wire recognition. In the actual research, the system framework is constructed through two methods of image recognition and video recognition. Meanwhile, in the experimental design, the experimental research is also carried out through the two pattern recognition of image recognition and video recognition. Through experimental research and analysis, it can be concluded that the core wire recognition method based on deep learning and machine vision constructed in this paper has a certain effect on core wire image and core wire video recognition and can exert a certain quality control effect on actual core wire manufacturing and production.
Conflicts of Interest
The authors declare that there are no conflicts of interest.
Acknowledgments
The study was supported by “Guangdong Province Ordinary University Young Innovative Talent Project (Natural Science) (Grant no. 2018KQNCX349).”
Open Research
Data Availability
The data used to support the findings of this study are available from the corresponding author upon request.


