Research on Image Denoising and Super-Resolution Reconstruction Technology of Multiscale-Fusion Images
Abstract
Image denoising and image super-resolution reconstruction are two important techniques for image processing. Deep learning is used to solve the problem of image denoising and super-resolution reconstruction in recent years, and it usually has better results than traditional methods. However, image denoising and super-resolution reconstruction are studied separately by state-of-the-art work. To optimally improve the image resolution, it is necessary to investigate how to integrate these two techniques. In this paper, based on Generative Adversarial Network (GAN), we propose a novel image denoising and super-resolution reconstruction method, i.e., multiscale-fusion GAN (MFGAN), to restore the images interfered by noises. Our contributions reflect in the following three aspects: (1) the combination of image denoising and image super-resolution reconstruction simplifies the process of upsampling and downsampling images during the model learning, avoiding repeated input and output images operations, and improves the efficiency of image processing. (2) Motivated by the Inception structure and introducing a multiscale-fusion strategy, our method is capable of using the multiple convolution kernels with different sizes to expand the receptive field in parallel. (3) The ablation experiments verify the effectiveness of each employed loss measurement in our devised loss function. And our experimental studies demonstrate that the proposed model can effectively expand the receptive field and thus reconstruct images with high resolution and accuracy and that the proposed MFGAN method performs better than a few state-of-the-art methods.
1. Introduction
As images can carry a great deal of data and information, image processing technology is applicable to many fields, such as medical treatment, transportation, military, space and aerospace, and communication engineering. It has penetrated into our lives and been inseparable from each of us. However, during image collection, storage, and processing, image noise may be introduced, which interferes with the information provided by the image and reduces the image sharpness. Generally, the image noises include salt and pepper noise, gamma noise, and Gaussian noise [1]. To solve the problem, image denoising and image super-resolution reconstruction (SR) techniques [2] were investigated to restore high-quality and high-resolution images [3].
The image denoising technique reduces the information loss of the original image while removing the image noises. A variety of noise reduction methods have been proposed by researchers. Traditional noise reduction methods [4] include bilateral filtering method [5], Gaussian filtering method [6], nonlocal algorithm [7], and block matching 3D (BM3D) algorithm [8]. In recent years, deep learning is widely adopted to solve image denoising problems, where the main methods are multilayer perceptrons and fully convolutional networks. Specifically, the multilayer perceptrons based method splits the original image into several blocks and subsequently denoises the blocks one by one. Finally, all the processed image blocks are stitched together. In addition, the algorithms based on fully convolutional networks mainly consist of denoising convolutional neural network (DNCNN) [9], convolutional blind denoising network (CBDNet) [10], etc. Moreover, Generative Adversarial Network (GAN) has nowadays attracted much attention from researchers. Various network frameworks, such as deep convolutional GAN (DCGAN), CycleGAN [11], and Pix2pix, have been proposed based on GAN for image processing.
- (1)
Based on GAN, we organically integrate the image denosing and image super-resolution reconstruction tasks, which avoids the considerable, repeated input and output operations for upsampling and downsampling images during the model learning, and achieves a simplified workflow with high performance.
- (2)
Derived from the Inception structure and adding the multiscale fusion into the GAN network, we successfully expand the receptive field in parallel and thereby enhance the quality of reconstructed images.
- (3)
We put forward a novel loss function and the effectiveness of each item of which is verified by the ablation experiments. Our experimental studies demonstrate that the proposed MFGAN method overall performs better than a few state-of-the-art methods.
The rest of this paper is organized as follows. Section 2 introduces the state-of-the-art work regarding our study. Section 3 presents the proposed model and method. Section 4 demonstrates the performance of the proposed model and shows the experiment results. Finally, Section 5 summarizes this paper.
2. Related Work
2.1. Basic Theory of Residual Network
For convolutional neural networks, deeper network architecture can lead to better accuracy, but may result in higher computational complexity and gradient disappearance problems. The reason lies in that the deep neural network has small training gradients. The residual network is proposed to solve the problems, which can greatly improve the performance of the deep neural network.
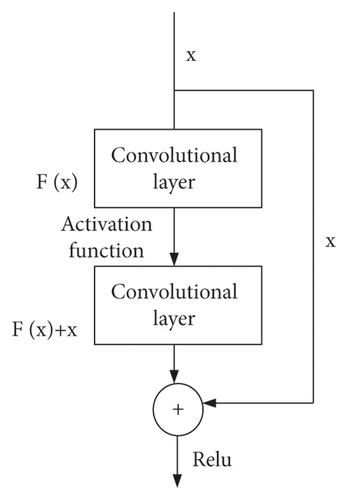
The residual network consists of a stack of residual blocks, all of which can be represented in a general form [12, 13]. We assume that H(x) is the basic mapping of several stacked layers, and x represents the input of the first layer. The network can be designed with a jump connection, i.e., H(x) = F(x) + x, which means to add the two input elements. Using the jump connection, the gradient-related problems of the deep neural network can be solved without increasing the computational complexity. In addition, an approximate residual function, i.e., F(x) = H(x) − x, can be obtained with the gradual approximation of multiple nonlinear layers. Figure 1 is the diagram of the residual network module.
2.2. Basic Research on SR
Super-Resolution Convolutional Neural Network (SRCNN) is the first one that applies deep learning technique to image SR [1], and it is also the most classic method in the field, which is fundamental to the following super-resolution reconstruction research. The network structure of SRCNN is shown in Figure 2.

2.3. Image Quality Evaluation Method
In order to quantitatively evaluate the performance of the network model for image denoising and restoration, two widely used metrics for image quality evaluation are utilized in this paper, i.e., Peak Signal-to-Noise Ratio (PSNR) [15] and Structural Similarity Index [16] (SSIM).
2.3.1. PSNR
2.3.2. SSIM
2.4. Comparison of Image Denoising Methods based on Deep Learning
Table 1 summarizes the image denoising methods based on deep learning in detail from the advantages, limitations, and applicability of the method.
| Basic network | Methods involved | Advantages | Disadvantages | Applicable noise |
|---|---|---|---|---|
| Denoising method based on convolutional neural network | N2N [21] | No pairwise training samples are needed, which overcomes the problem of insufficient pairwise training samples in real images | Shallow pixel level information utilization is low and texture details are easily lost | Real noise |
| VDN [22] | Complex noise | |||
| FFDNet [23] | Complex noise | |||
| CBDNet [24] | Real noise | |||
| PRIDNet [25] | Real noise | |||
| Denoising method based on residual network | FC-AIDE [26] | The problems of gradient disappearing and gradient explosion are solved effectively, and the convergence speed is accelerated | The use of dense connections leads to overfitting of networks, which affects the consistency between objective evaluation indexes and subjective visual effects | Complex noise |
| CycleISP [27] | Real noise | |||
| PANet [28] | Complex noise | |||
| GRDN [29] | Real noise | |||
| Denoising method based on Generative Adversarial Network | GCBD [24] | It can generate realistic noise images, expand the real image dataset, and solve the problem of insufficient training samples | There are some problems such as unstable network training, slow convergence speed, and uncontrollable model | Real noise |
| ADGAN [30] | Real noise | |||
| Denoising method based on Graph Neural Network | GCDN [31] | Complex noise distribution can be well fitted by the topology of graph network | Unstable dynamic topology will reduce the ability of feature expression | Real noise |
| DeepGLR [32] | Real noise | |||
| OverNet [33] | Complex noise | |||
3. Image Denoising and Super-Resolution Reconstruction Method Based on GAN
3.1. GAN
With the widespread usage of deep learning in image processing, more and more scholars pay attention to the efficiency and comprehensiveness of network models. In fact, image denoising and image super-resolution reconstruction are two different topics but closely related with each other in the field of image processing. Image denoising will inevitably lead to the definition and resolution reduction of the image. To this end, it is necessary to conduct super-resolution reconstruction. As shown in Figure 3, GAN can combine the image denoising method with the super-resolution reconstruction technique, which is able to simplify the processing procedure and decrease the image processing time. In this section, we redesign the network model and optimize the model parameters based on GAN in order to promote the quality of the generated image.

The generator and discriminator are the key modules in GAN. The generator is mainly used to obtain data information and subsequently generate an image. Both the real image and the generated image are sent to the discriminator for training. The discriminator will identify if the generated image is a fake one. Specifically, if the generated image is regarded as a fake image, the abovementioned process will be executed again. The loop will not stop until the discriminator cannot determine the authenticity of the generated image. As a result, we can obtain a well-trained generator.
3.2. Research on Multiscale-Fusion Module
The Inception structure proposed by Google is a new functional unit, of which the main idea is to improve the convolution kernel to increase the receptive field [17]. In this way, more image information can be learned by the network, and thus the clarity of the image may be improved. At present, the Inception structure has been developed from Inception V1 to the current Inception V4. Their network structure and processing delay are improved version by version.
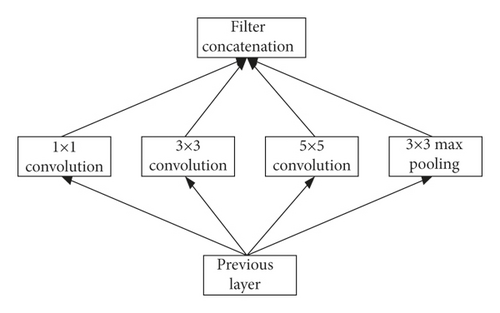
To improve network performance, the easiest way is to add the depth of the network. However, with the network depth increasing, the computational complexity will grow exponentially, which may lead to overfitting. It means that it is very difficult to optimize the network parameters. In order to solve the problem, as illustrated in Figure 4, the Inception structure uses a set of parallel convolution kernels, which expands the original convolution into one 1 × 1 convolution, one 3 × 3 convolution, one 5 × 5 convolution, and one max-pooling. In this way, the receptive field of the network can be enlarged, and thus more features can be learned.
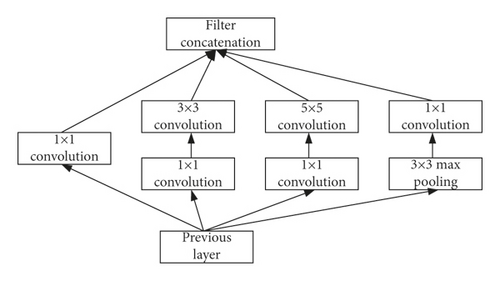
Based on Inception structure, the GoogLeNet network is developed by Google, as presented in Figure 5. It adds one 1 × 1 convolution to each branch in the network, which can reduce the number of network parameters.
It is well known that the dimensionality of the convolutional neural network cannot be reduced to a certain level; otherwise it may lead to information loss and bring a negative impact on the network training. Therefore, to solve the problem, two methods are proposed for the Inception structure to segment the convolution kernel.
The first one is to decompose a large convolution kernel into two or more small convolution kernels equivalently. It can obtain the same receptive field and decrease the network parameters, which means that adding the depth of the network will not result in the degradation of the network performance. Moreover, the second method is to decompose a symmetric convolution kernel into multiple small asymmetric convolution kernels. It will also decrease the number of the parameters and can improve the expressive ability of the model and learn more features.
At present, the deep learning network is becoming more and more complex and the network load is growing as well, which tends to cause overfitting and gradient disappearance. Since the abovementioned residual network also has a good performance on image processing, it is potential to combine the Inception structure with the residual structure for feature fusion, which can solve the problem to the greatest extent.
3.3. Multiscale-Fusion GAN
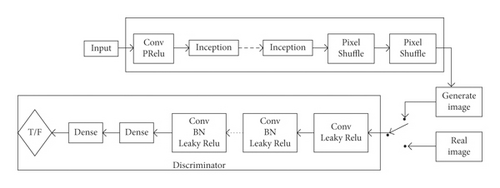
In this section, we integrate the SR model and the Inception structure into GAN for image denoising processing and SR. The diagram of the designed network model is shown in Figure 6.
3.3.1. Generator
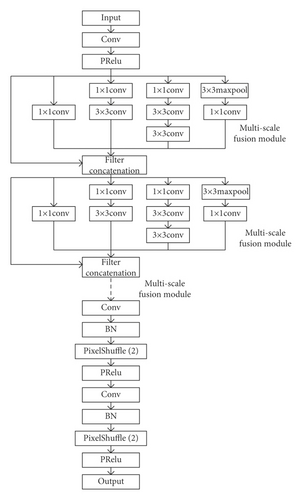
The input of the generator is a fuzzy image with noises, while the output is a generated image with high resolution. Figure 7 shows the schematic diagram of the generator’s network model based on the convolutional neural network considering the multiscale-fusion structure. Specifically, the convolution kernels with different sizes can read information of different dimensions in the image. The jump connections are added between any two consecutive layers. The information of the entire image can be read maximally in this way, thus improving the performance of the final image generation. Moreover, PRelu [18] is used as the activation function here, instead of Relu, as a number of experiments present that use PRelu can reduce the number of dead neurons in the network.
3.3.2. Discriminator
The diagram of the discriminator’s network model is shown in Figure 8 which is to distinguish the super-resolution image generated by the generator from the real image in the training set. The network is designed based on the super-resolution GAN (SRGAN). Experiments demonstrate that eight convolutional layers [19] can result in good network performance. As the number of network layers continues to rise, the number of features that the network can obtain will grow as well, and the feature size decreases. The backpropagation can be performed even when the input value is negative, which is very suitable for discriminating networks. In addition, we use Leaky Relu in the network as the activation function, which can solve the problem of neuron death.

3.3.3. Loss Function
4. Experiment Results and Analysis
4.1. Experiment Setups
In this paper, the experiment is implemented with the python-based Pytorch deep learning framework under the operating system of Windows 10. The terminal used for training and testing in the experiments is equipped with Intel(R) Core(TM) i5-8500 [email protected] GHz. The Adam gradient descent algorithm is used for training, the initial learning rate is set to 0.001, and the batch size is set to 64. The datasets used in the experiment include CIFAR-10, CIFAR-100, VOC 2012, RENOIR [20], BSD100, and self-made ImageNet.
4.2. Experiment Implementation and Results
The experiment uses the imnoise function in the MATLAB compiler to perform noise processing on the measured dataset. We compared the performance between the noise coefficient of 0.2 and 0.05. In the case of the noise coefficient of 0.5, the image damage is more serious and it is difficult to denoise well, so this situation is discarded by us. In addition, the amount of noise reduction is evaluated under different levels of Gaussian noise interference. Two kinds of noise are used here, namely, Gaussian noise and salt and pepper noise.
Tables 2 and 3, respectively, show the experimental results of PSNR and SSIM under different datasets and different noise figures. Compare the table longitudinally. Due to the image characteristics of different datasets, not every dataset is suitable for denoising experiments. Among them, BSD100 is the most suitable for denoising experiments, and the results obtained are relatively good.
| Dataset | Gaussian noise figure | Gaussian filter | SRCNN | SRGAN | DNCNN | ESPCN | ESRGAN | ADGAN | MFGAN (proposed) |
|---|---|---|---|---|---|---|---|---|---|
| CIFAR-10 | 0.2 | 21.52 | 21.09 | 23.02 | 22.15 | 21.79 | 23.23 | 23.10 | 23.15 |
| 0.05 | 22.13 | 22.06 | 23.86 | 22.49 | 21.98 | 23.73 | 23.40 | 23.97 | |
| CIFAR-100 | 0.2 | 21.48 | 21.06 | 22.98 | 22.86 | 21.56 | 23.12 | 23.01 | 23.10 |
| 0.05 | 22.08 | 22.01 | 23.82 | 23.20 | 21.88 | 23.63 | 23.51 | 23.80 | |
| VOC2012 | 0.2 | 21.88 | 21.93 | 23.65 | 22.33 | 22.08 | 24.07 | 23.29 | 23.64 |
| 0.05 | 22.31 | 22.27 | 23.98 | 22.84 | 22.56 | 24.02 | 23.55 | 24.01 | |
| RENOIR | 0.2 | 21.34 | 21.08 | 23.01 | 22.12 | 21.76 | 23.23 | 22.58 | 23.15 |
| 0.05 | 22.21 | 22.07 | 23.45 | 22.67 | 21.94 | 23.77 | 23.30 | 23.94 | |
| ImageNet1 | 0.2 | 21.44 | 21.14 | 22.98 | 22.02 | 21.33 | 23.34 | 23.03 | 23.14 |
| 0.05 | 22.10 | 22.06 | 23.87 | 22.48 | 22.23 | 23.76 | 23.51 | 23.86 | |
| ImageNet2 | 0.2 | 21.43 | 21.16 | 22.97 | 22.24 | 21.33 | 23.28 | 23.19 | 23.18 |
| 0.05 | 22.12 | 22.02 | 23.85 | 22.76 | 22.27 | 23.70 | 23.39 | 23.88 | |
| BSD100 | 0.2 | 21.48 | 21.44 | 22.56 | 23.00 | 22.21 | 23.23 | 23.01 | 23.23 |
| 0.05 | 22.01 | 22.01 | 22.77 | 23.02 | 22.25 | 23.55 | 23.57 | 24.14 | |
| Dataset | Gaussian noise figure | Gaussian filter | SRCNN | SRGAN | DNCNN | ESPCN | ESRGAN | ADGAN | MFGAN (proposed) |
|---|---|---|---|---|---|---|---|---|---|
| CIFAR-10 | 0.2 | 0.58 | 0.60 | 0.62 | 0.64 | 0.63 | 0.64 | 0.60 | 0.63 |
| 0.05 | 0.62 | 0.64 | 0.67 | 0.67 | 0.66 | 0.69 | 0.63 | 0.68 | |
| CIFAR-100 | 0.2 | 0.58 | 0.60 | 0.63 | 0.64 | 0.61 | 0.65 | 0.62 | 0.63 |
| 0.05 | 0.61 | 0.63 | 0.67 | 0.66 | 0.63 | 0.66 | 0.64 | 0.67 | |
| VOC2012 | 0.2 | 0.60 | 0.61 | 0.65 | 0.62 | 0.62 | 0.66 | 0.61 | 0.67 |
| 0.05 | 0.63 | 0.63 | 0.68 | 0.67 | 0.66 | 0.69 | 0.66 | 0.70 | |
| RENOIR | 0.2 | 0.63 | 0.58 | 0.64 | 0.63 | 0.63 | 0.65 | 0.63 | 0.65 |
| 0.05 | 0.64 | 0.61 | 0.65 | 0.66 | 0.64 | 0.68 | 0.65 | 0.68 | |
| ImageNet1 | 0.2 | 0.56 | 0.57 | 0.61 | 0.61 | 0.62 | 0.65 | 0.61 | 0.61 |
| 0.05 | 0.61 | 0.62 | 0.66 | 0.64 | 0.63 | 0.67 | 0.62 | 0.66 | |
| ImageNet2 | 0.2 | 0.59 | 0.59 | 0.61 | 0.62 | 0.61 | 0.64 | 0.61 | 0.63 |
| 0.05 | 0.62 | 0.62 | 0.63 | 0.64 | 0.63 | 0.68 | 0.62 | 0.68 | |
| BSD100 | 0.2 | 0.60 | 0.62 | 0.63 | 0.62 | 0.62 | 0.64 | 0.60 | 0.62 |
| 0.05 | 0.62 | 0.63 | 0.67 | 0.67 | 0.63 | 0.67 | 0.63 | 0.66 | |
Comparing the results in Tables 2 and 3 horizontally, after performing super-resolution reconstruction, the performance of the denoising method based on GAN network is significantly better than other methods; in particular, SRGAN and ADGAN have excellent performance, and under different network settings they show similar results, but the MFGAN proposed in the article has better experimental results in most cases. Based on the above comparison and the comparison of the image clarity seen by the naked eye mentioned below, the performance of the MFGAN proposed in the article is slightly better than that of SRGAN and ADGAN, which effectively improves the denoising effect.
We evaluated the experimental results from a statistical point of view through the Friedman test [34] and the Holm post hoc test [35]. Friedman test is used to calculate the average ranking of the compared methods and to determine whether the observed differences are statistically significant. We set the significance level of the test to 0.05. If the p-value is less than 0.05, the null hypothesis H0 is rejected and we can confirm that there are significant differences. The Holm post hoc test is then performed to evaluate the statistical differences between the control (i.e., the method that achieves the best Friedman rank) and other methods. The results of the Friedman test are shown in Table 4, and the results of the Holm post hoc test are shown in Table 5.
| Friedman test for MFGAN | |||
|---|---|---|---|
| Algorithm | Friedman rank | p-value | H0 |
| Gaussian filter | 6.6429 | 0.0000000201622122 | Rejected |
| SRCNN | 7.5 | ||
| SRGAN | 2.8571 | ||
| DNCNN | 4.8571 | ||
| ESPCN | 6.8571 | ||
| ESRGAN | 2.5714 | ||
| ADGAN | 3.5714 | ||
| MFGAN (proposed) | 1.1429 | ||
| Holm’s post hoc comparison for MFGAN | |||||
|---|---|---|---|---|---|
| i | Algorithm | Z = (R0 − Rt)/SE | p | Holm = α/i | H0 |
| 7 | SRCNN | 4.855348 | 0.000001 | 0.007142 | Rejected |
| 6 | ESPCN | 4.364356 | 0.000013 | 0.008333 | Rejected |
| 5 | Gaussian filter | 4.200694 | 0.000027 | 0.01 | Rejected |
| 4 | DNCNN | 2.836833 | 0.004556 | 0.0125 | Rejected |
| 3 | ADGAN | 2.554852 | 0.013617 | 0.016667 | Rejected |
| 2 | SRGAN | 2.309307 | 0.04043 | 0.025 | Rejected |
| 1 | ESRGAN | 2.091089 | 0.045234 | 0.05 | Rejected |
As shown in Table 4, the Friedman test results reveal that the MFGAN method performs better than the other seven classification methods in classification accuracy. And the results of Holm’s post hoc in Table 5 also show that, compared with other methods, MFGAN has better performance. This once again proves that our proposed MFGAN has achieved better results in denoising.
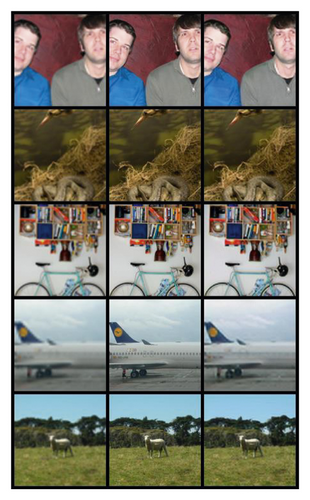
Figure 9 compares the generated images between SRGAN and the proposed MFGAN. The images are obtained based on the training of 100 rounds. The first column of the images is generated by SRGAN, the second is the original training image, and the third one is the generated image of MFGAN. Through the figure, we can discover that the generated images by the MFGAN show better rendering performance than SRGAN. Although the reconstruction quality is different from images, MFGAN can obtain higher accuracy than SRGAN, especially for the images at the first row and the fifth row. In addition, compared with SRGAN, the proposed method also improves the expansion of the receptive field.
Furthermore, we conduct ablation experiments to verify the importance of perceived loss and adversarial loss for the experimental results. As shown in Table 6, when the perceived loss is used alone as the loss function in the experiment, the overfitting occurs and the generated image is pixelated. In addition, if the adversarial loss is used alone in the experiment, the PSNR of the generated image is generally between 20 and 21, which is significantly lower than the original one. Therefore, both the perceived loss and the adversarial loss in the experiment are of significance to ensure the integrity and accuracy of the experimental results.
| Dataset | Delete the loss function | SRCNN | SRGAN | ESRGAN | ADGAN | MFGAN (proposed) |
|---|---|---|---|---|---|---|
| CIFAR-100 | Adversarial loss | Error | Error | Error | Error | Error |
| Perceived loss | 19.57 | 20.44 | 20.23 | 20.19 | 20.80 | |
| VOC2012 | Adversarial loss | Error | Error | Error | Error | Error |
| Perceived loss | 19.89 | 20.43 | 20.42 | 20.11 | 20.52 | |
| BSD100 | Adversarial loss | Error | Error | Error | Error | Error |
| Perceived loss | 20.06 | 20.66 | 20.39 | 20.81 | 20.78 | |
5. Conclusion and Future Work
In my paper, we propose a GAN-based method, which is enabled to combine image denoising with image super-resolution reconstruction for image processing. The proposed method improves the residual network in SRGAN and increases the receptive field by adding the idea of multiscale fusion. Moreover, the activation function is selected and the problem of neuron death is solved by the method. Furthermore, we also design the loss function to improve the discriminator and the accuracy of the generated image.
In practice, multiple types of noises coexist with each other. When the image is severely interfered by various types of noises, the performance of the proposed model may be affected. Therefore, it is required to improve the model for the scenario with different noises in future work. For example, the coefficient ratio of the perception loss and the counter loss should be studied. How to intelligently determine the appropriate loss coefficient ratio according to noises is required to be solved as well. In addition, the introduced Inception structure leads to a long computational delay for the model training. Hence, it is worth investigating the method to improve the training speed in the future.
Conflicts of Interest
The authors declare no conflicts of interest.
Acknowledgments
This work was supported in part by the National Natural Science Foundation of China under Grants 62172192 and 61772241; in part by the Science and Technology Demonstration Project of Social Development of Jiangsu Province under Grant BE2019631; and in part by the 2018 Six Talent Peaks Project of Jiangsu Province under Grant XYDXX-127.
Open Research
Data Availability
The datasets used to support the findings of this study are available from the corresponding author upon request.


