Heterogeneous Signal Fusion Method in Driving Fatigue Detection Signals
Abstract
Driving fatigue is a physiological phenomenon that often occurs during driving. When the driver enters a fatigue state, they will become distracted and unresponsive, which can easily lead to traffic accidents. The driving fatigue detection method based on a single information source has poor stability in a specific driving environment and has great limitations. This work helps with being able to judge the fatigue state of the driver more comprehensively and achieving a higher accuracy rate of driving fatigue detection. This work mainly introduces research into different signal fusion methods to detect fatigue drive. This work will take the normal driver’s breathing signal, eye signals, and steering wheel signal as research objects and collect and isolate the characteristics of the fatigue detection signal. Research was then conducted on different signal fusion methods for the detected depth of breath. Change of steering angle, eyelid closure, and blinking marks and the fatigue driving experiment was designed to evaluate the results of different data fusion methods. Experimental results show that the detection accuracy of the heterogeneous signal fusion method in fatigue detection is as high as 80%.
1. Introduction
1.1. Research Background and Significance
With the continuous improvement of domestic infrastructure construction and the continuous improvement of people’s economic income level, the number of private cars has expanded significantly in recent years. Vehicles, such as cars and trains, still rely on the manual driving of the driver, and driving fatigue is a physiological phenomenon that often occurs during driving and is unavoidable [1]. In highway traffic, fatigue driving has become one of the main causes of traffic accidents. According to the statistics, more than 60% of drivers have had a long continuous driving experience. Among the major traffic accidents in the entire country, 27% of the drivers are fatigued and cause the accident [2]. Toyota has conducted investigations into the causes of traffic accidents. Among the three key factors: people, cars, and roads [3], the traffic accidents directly or indirectly caused by the “people” factor accounted for 92.9%, and the vast majority of traffic accidents are directly or indirectly related to the status of the driver [4]. The driver’s driving state directly affects the operating error rate and the ability to deal with emergencies. The fatigue that occurs during driving can cause the driver to become distracted and slow to react. Driving fatigue has become an invisible killer in road traffic and rail traffic. When the driver is tired and lethargic, the vehicle will not be able to control as expected. And the consequences are unpredictable and unexpected as well. This not only causes loss to one’s own life and property, but also brings great harm to pedestrians. Therefore, it is urgent to solve the problem of fatigue driving. To prevent accidents such as fatigue driving, it is necessary to develop effective fatigue detection methods; at this stage, fatigue detection is carried out by a single signal, and the detection of a single signal is one-sided. Therefore, in fatigue detection, research on how to detect fusion signals is imperative, which can detect driver fatigue in multiple directions and reduce driver fatigue.
1.2. Related Content
Fatigue can affect normal work and even cause accidents. To reduce the impact of fatigue on people, Wang proposed a method to provide real-time fatigue detection [5]. First, he uses an active shape model to detect human faces and extracts the histogram features of directional gradients of the eyes and mouth. Secondly, the support vector machine (SVM) is used to classify the state and posture of the orthography and scaling with iterations algorithm to estimate the head posture. Third, according to the face state, the fatigue decision index is obtained, and the weight of the fatigue decision index is calculated by the entropy method. Finally, based on the calculated fatigue decision index, he applies the Bayesian method to evaluate the driver’s fatigue level. The final average accuracy of his method is 83.3%. However, the operation of this method is more complicated. Li et al. explored a feature weight-driven signal fusion method [6] and proposed interactive mutual information modeling to improve the accuracy of mental workload classification. They used EEG and ECG signals to verify the proposed heterogeneous organisms the effectiveness of signal fusion methods. they invited ten subjects to participate in simple, medium, and difficult tasks to collect brain and ECG signals of different mental load levels. Then, they can be used for classification according to the heterogeneous physiological signals of different mental workload states. Their experiments show that the ECG can be used as a supplement to the EEG, optimize the fusion model, and improve the estimation of mental workload. The classification results show that the proposed biosignal fusion method IMIM can improve the classification accuracy of feature-level and classifier-level fusion. Their research shows that multimodal signal fusion is expected to identify the level of mental workload, and the fusion strategy has potential psychological workload estimation applications in cognitive activities in daily life. However, there are limitations of location in terms of use. The disadvantage is that only ten experimental subjects were selected, which is too small to have the validity of the experiment. Zheng et al. proposed a dynamic fatigue detection model based on hidden Markov model [7]. The model can use various physiological and detection information to estimate driver fatigue in a probabilistic manner. In the actual driving process, they simultaneously recorded electroencephalogram (EEG), electromyography (EMG), and breathing signals through wearable sensors and sent them to the computer via Bluetooth. Then, according to the physiological information, the distribution estimates of different time periods are used to obtain the fatigue probability. Their HMM-based fatigue identification method can dynamically obtain fatigue testing. However, the calculation amount of this detection method is too large, and the detection has greater difficulty. Pilataxi et al. introduced a driving assistance system that detects when the driver is drowsy [8]. The system is tested by a car-like robot that is wirelessly controlled by a computing interface developed in Visual Studio 2010, which simulates a car panel. An artificial vision system monitors the driver’s head direction to determine whether the driver is drowsy. However, this study did not use heterogeneous signal fusion methods.
1.3. Main Content and Innovation
The main content of this article is to study the respiratory physiological signals, driver operation signals, and eye signal detection in the fatigue driving detection, collect and extract the characteristics of the physiological signals and eye detection signals, and then compare the signal fusion methods. The best decision-level fusion method is selected for the fusion of heterogeneous signals, and finally the high accuracy of the heterogeneous information fusion method in the detection of fatigue driving is confirmed by the detection of fatigue driving signals. The innovation of this paper is to combine the fatigue driving detection signal with heterogeneous signal fusion and achieve a high accuracy rate of fatigue driving detection by fusing the collected heterogeneous signals.
2. Fatigue Driving Concepts and Methods
2.1. Definition of Fatigue Driving
To allow readers to better understand the meaning of driving fatigue, I will talk about some theoretical knowledge as the theoretical basis for the article. Fatigue driving refers to the phenomenon that the driver has physical and psychological disorders and decreased driving skills after driving for a long time. Fatigue is a very complex physiological phenomenon, which can generally be divided into mental fatigue and physical fatigue. Mental fatigue is manifested as restlessness, loss of motivation, difficulty in concentration, slow thinking, low mood, decreased work efficiency, prolonged reaction time, and decreased work accuracy. Its continued development will cause headaches, dizziness, insomnia, and dysfunction of the cardiovascular system, respiratory system, and digestive system. Mental fatigue and physical fatigue often occur at the same time [9, 10]. The driving fatigue discussed in this article refers to the phenomenon of slow response and misjudgment when the driver is driving. Driving fatigue is often a mixture of physical fatigue and psychological fatigue [11]. Continuous driving time is the most important and common cause of driving fatigue. According to the statistics of the literature, after 3 hours of continuous driving, most drivers will start to feel fatigue and start to experience operational errors. After continuous driving, the incidence of car accidents will rise to 1.5 times that of normal conditions. Therefore, the laws of various countries have strictly controlled the driving time of drivers, as shown in Table 1.
| Country | Continuous driving time | Cumulative driving time (one day) |
|---|---|---|
| China | 4 hours | 8 hours |
| United States | None | 10 hours |
| Japan | 4 hours | 9 hours |
| Australia | 5 hours | 12 hours |
| Europe | 4.5 hours | 10 hours |
The generation of driving fatigue is also closely related to the driver’s physical and mental state when starting to drive. Factors such as the driver’s circadian rhythm, sleep time, age, and gender will all induce driving fatigue to varying degrees. The driving environment is also a factor in driving fatigue. Conditions such as temperature, humidity, oxygen content in the air, noise, and vibration of car seats are much worse than indoor environments. Unfavorable conditions driving fatigue usually occurs in driving environments [12, 13].
2.2. Introduction to Over-Limit Learning Machine
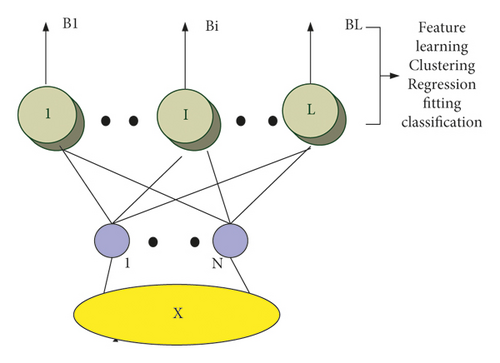
Over-limit learning machine is an algorithm in neural network research. It is a generalized single hidden layer feedforward neural network used for classification, regression, clustering, sparse approximation, compression, and single or multilayer hidden nodes. Feature learning [14, 15] is where the parameters of the hidden nodes (not just the weights connected to the input to the hidden nodes) do not need to be adjusted [16]. These hidden nodes can be randomly assigned and never updated (i.e., they are random projections, but have nonlinear transformations), or they can be inherited from their parents without being changed [17, 18]. In most cases, the output weights of hidden nodes are usually learned in a single step, which is equivalent to learning a linear model [19]. There will be no common problems such as falling into local minimum and overfitting in traditional neural networks, and it is suitable for modeling systems with complex nonlinear input and output relationships. Its advantage is that the learning speed is fast. For the algorithm applied to the product, it can greatly reduce the calculation amount, increase the calculation speed, and greatly improve the calculation speed [20, 21]. Its characteristic is that the weights of hidden layer nodes are randomly or artificially given and do not need to be updated. The learning process only calculates the output weights. Figure 1 shows the simple results and applications of over-limit learning.
2.3. Introduction to Fractional-Order System
3. Feature Extraction and Heterogeneous Signal Fusion in Fatigue Detection
3.1. Physiological Signal Feature Collection
3.1.1. Working Principle of Detecting Physiological Signals
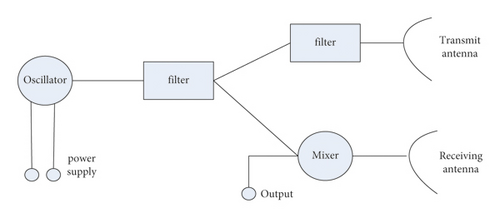
In this paper, continuous wave radar is selected as the detection sensor. The typical block diagram of continuous wave radar is shown in Figure 2, including power divider, transmitting antenna, receiving antenna, oscillator, mixer, detector, and other circuits. The transmitting antenna transmits the microwave signal in a directional direction, and it is reflected back after encountering obstacles and received by the receiving antenna. After being mixed with the oscillator, the low-frequency signal is detected by the mixer. When using continuous wave radar to detect the human thoracic cavity, the movement of the thoracic cavity will produce frequency modulation. According to the Doppler effect, the reflected radar signal will also have a corresponding frequency shift, so the obtained low-frequency signal contains the movement information of the thoracic cavity.
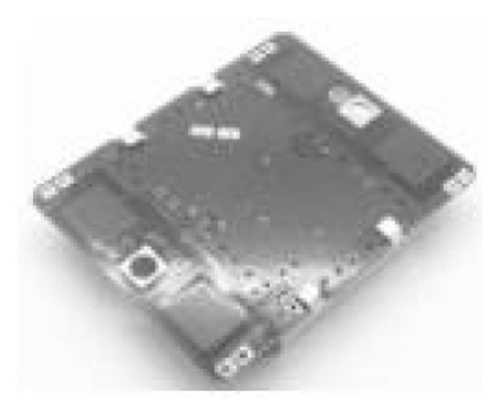
Human body thoracic cavity that is used as a target for detecting the radar emission signal returned by the thoracic cavity movement will generate frequency modulation; the phase information related to the thoracic cavity movement can retrieve the modulation data. Can be late, the phase data can reflect the tester’s breath and heartbeat. Doppler radar has a good ability to penetrate clothing or bedding and can achieve noncontact detection. However, for the radio frequency, whether the signal is in the air or on the surface of the skin, there is reflection loss, which results in a strong correlation between the performance of the radar and the frequency. Therefore, the choice of radar sensor is a key indicator, which directly affects the quality of the experimental results. From the theory of continuous wave radar, it can be known that the smaller the wavelength of the radar in the output baseband signal B(t), the more obvious the displacement change of the detected chest cavity, which means that the higher the frequency of the selected radar, the better. According to the electromagnetic field theory, the higher the radar frequency, the smaller the signal reflection after encountering the human body surface, the weaker the ability to penetrate clothing, and the greater the energy consumption of transmitting signals of the same power. It can be seen that the frequency selection of radar is a contradictory process. According to the reasons such as penetration ability, volume, and transmission power, in this article, the 10.525 GHz radar module HB100 is selected as the front-end detection sensor. This module is a microwave moving object detector designed by using the Doppler effect. The actual sample is shown in Figure 3. The radar module is mainly used for automatic door switches, safety precaution systems, automatic train signals, and other occasions. The internal integrated transmission and receiving antennas, oscillators, mixer, detectors, and other modules have the advantages of strong antiinterference ability, low output power, and long detection distance.
3.1.2. Physiological Signal-Related Quantity
Among them, Y(t) represents the heartbeat frequency at a certain moment and represents the average value of the heartbeat frequency over a period of time.
3.2. Steering Wheel Angle Collection
3.2.1. Principle of Steering Wheel Acquisition Sensor
Most steering angles have two measurement methods: absolute and relative. This is because it is necessary to record the specific position of the steering wheel during the research process. An absolute angle encoder was therefore chosen as the sensor in this study. The angle of the steering wheel can be detected without affecting the driver, and the accuracy of the detection can be improved. According to the steering wheel steering requirements of fatigue driving, the model P3022 Hall angle sensor is selected. The P3022 Hall angle sensor converts the transformed angle signal into an electrical signal via electromagnetic induction principle; when the steering angle changes, the angle of the sensor installed under the steering wheel will change accordingly. And the sensor will output an electrical signal proportional to the rotation angle. P3022 angle sensor has the characteristics of 360-degree mechanical angle, angle resolution, 0.088 degrees, output 0–5 V analog voltage signal, and so on. Since the measurement range of the angle sensor is only 0–360 degrees, and the actual steering wheel rotation angle is 0–1080 degrees, which far exceeds the measurement range of the angle sensor, it is necessary to add a sensor to record the entire process of steering wheel movement. In this way, it is possible to accurately judge whether the driver is driving in a straight line and can also switch to the Hall angle sensor for timely measurements and accurately record small-turn signal changes. The circuit design is shown in Figure 4. The system uses a 3590S-2-103L precision ten-turn rotary potentiometer to measure the entire angle change during the rotation of the steering wheel.
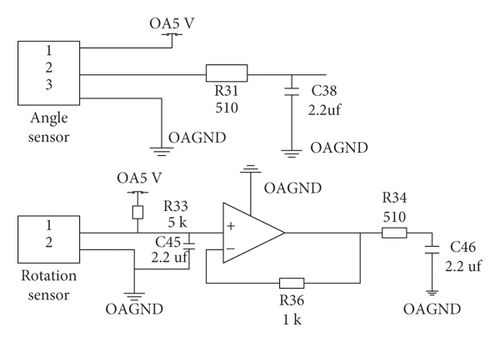
The maximum resistance value of the rotary potentiometer is 5 KΩ. The actual change range of the potentiometer is 500 Ω-5 KΩ when the steering wheel rotates 0–1080 degrees. Considering the power consumption of the circuit and the signal change range, the voltage divider resistance is 5 KΩ, and the analog signal output change range is 0.45 V–2.5 V. It can be seen that the resolution of the rotary encoder is very low, but the experiment only needs to record the changing trend and position of the steering wheel angle, and there is no need to have high requirements for accuracy.
3.2.2. Reverse Disk Angle Signal Correlation Quantity
- (1)
The steering wheel angular velocity V can be expressed as
(10) -
Among them, θ is the digital number of the output conversion of the voltage value corresponding to the steering angle of the steering wheel at t.
- (2)
The standard deviation of the steering wheel angular velocity can be expressed as
(11) -
Among them,
(12) - (3)
The standard deviation of the steering angle of the steering wheel can be expressed as
(13)
Calculate the steering angular velocity, angular velocity standard deviation, and angle standard deviation per unit time during the driving process of the driver, and compare it with expert scoring standards to analyze the correlation between the degree of driving fatigue and the parameter information of the driving vehicle.
3.3. The Driver’s Eye Feature Point Collection Based on the Over-Limit Learning Machine
Eye feature point positioning belongs to the category of face alignment, which refers to finding various facial feature points (landmarks) from the detected face, such as key positions such as eyes, eyebrows, nose, mouth, and facial contours. Figure 5 shows the facial feature point model.

As shown in Figure 6, the feature points are distributed in the lines in the figure, where the eye area contains the main information of the eyes, and the schematic diagram of the eye feature points is shown in Figure 6, including 2 points on the upper eyelid, 2 points on the lower eyelid, and 2 points on the left and right corners of the eye.
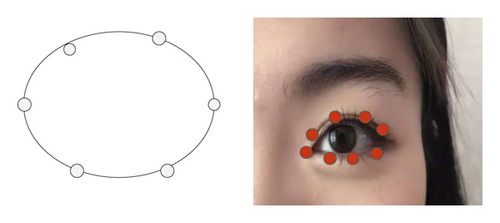
Over-limit learning machine is an algorithm in neural network research, used for classification, regression, clustering, sparse approximation, compression, and feature learning of single or multilayer hidden nodes. The algorithm builds a cascaded residual regression tree, thus making the face gradually return to the true position from the initial value of the feature point. Use the super learning machine to align the detected face area to find the position of the face. The detection result is shown in Figure 7. The eyelid aspect ratio can characterize the degree of eyelid opening. We select 3 typical eyelid closure types for analysis.
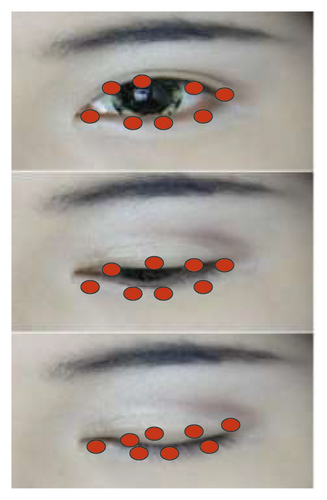
For various eyelid states, the eyelid height-to-width ratio can be used to represent it. The eyelid height-to-width ratio can reflect the various transformation characteristics of the driver’s eyes in a time series. The blink frequency refers to the number of blinks of the driver in a unit time. Under normal circumstances, the driver’s blinking frequency remains within a relatively stable range during normal driving. When the driver is in a fatigued driving state, the blink frequency will be significantly reduced or significantly increased, which is very unstable. Eye-closing speed refers to the time it takes for the eyelids to go from a normal open state to a fully closed state. The shorter the time, the faster the eyelid closure speed, and the shorter the time, the slower the eyelid closure speed. The speed of closing the eyes of the driver during normal driving is much faster than during fatigue driving. When the driver is in a state of fatigue, the closing speed of the eyelids is very slow.
3.4. Heterogeneous Signal Fusion Method for Fatigue Driving Detection
Driving fatigue is a complex physiological and psychological phenomenon. The single-modal driving fatigue detection method cannot fully characterize the driver’s fatigue. And in actual driving scenarios, due to various environmental interferences (such as unstable lighting conditions in the driving environment, vehicle vibration, spatial electromagnetic interference, etc.), the detection method based on a single information source is not reliable. This section discusses the combination of normal driver respiration data, eye data, and steering angle parameters and judge the overall fatigue condition of the driver, so as to achieve higher driving fatigue detection accuracy, stability, and environmental adaptability. Differential fusion means a complete preprocessing process. Data entry, forecasting, and arbitration decisions are based on information from many different sources to achieve more accurate, stable, and reliable target data from a single source.
3.4.1. Type of Signal Fusion
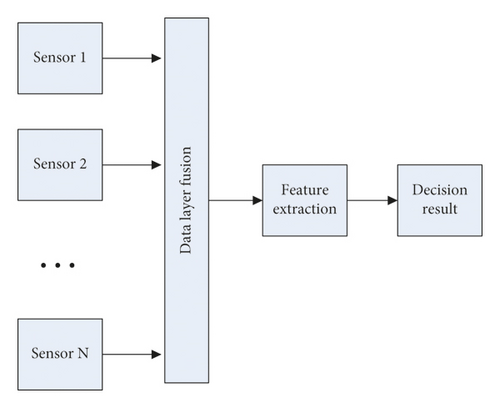
The heterogeneous signal fusion method actually uses the data of multiple sensors to obtain complete information about the object or the environment. Its core part is the fusion algorithm, and different fusion algorithms have different advantages. There are many information fusion algorithms that have been proposed. According to the different levels of data abstraction, they can be divided into three levels: data layer fusion, feature layer fusion, and decision layer fusion. The integration of these three levels has its own advantages. As shown in Figure 8, the data layer fusion is to directly perform the fusion without any processing and processing of the raw data from the sensors of the same category, and then perform feature extraction with the data obtained after the fusion, and finally obtain the discrimination result. This method belongs to the lowest level of fusion, and there is no data loss. However, this fusion method has considerable limitations. It has certain restrictions on multiple sensors. The sensors to be fused must be of the same type, and the consistency of time and space must be ensured before fusion. This means that the increase in the amount of calculation will result in slow processing speed and poor real-time performance.
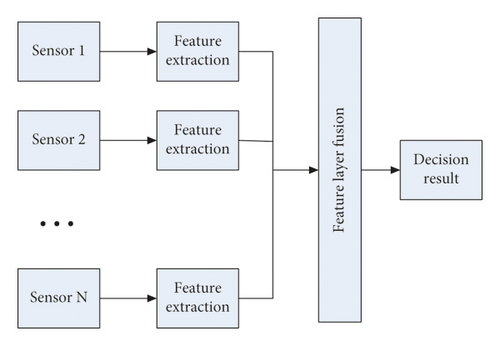
Compared with the other two methods, the feature-level fusion belongs to the middle-level fusion. Different from the data-level fusion, it first extracts the corresponding features from the original data collected by different sensors, performs certain processing on the extracted features, and then fuses them. Finally, the model is modeled to obtain the discrimination result. The fusion process is to fuse the features extracted from the original data, reducing a lot of calculations, improving the transmission speed and processing speed, and has a certain real-time performance, but compared with data-level fusion, a certain amount of information will still be lost. This leads to a decrease in accuracy. Feature layer fusion is shown in Figure 9.
Decision-level fusion is the highest level method among the three fusion methods. Unlike the previous two, it uses multiple sensors to monitor an object at the same time. However, unlike the data level, different types of sensors can be used, and each sensor is processed independently. That is, the model is established after the features are extracted, and the decision result is obtained, and then all decision results are merged and judged to obtain the final decision result. The decision fusion method is aimed at the decision results of different sensors, which makes it more computationally intensive and more real-time. However, it has undergone multiple layers of information extraction, and the information loss is more serious, which greatly reduces the accuracy of the fusion result. Therefore, the heterogeneous signal fusion in this paper adopts the decision-making layer fusion calculation, and the decision-making layer fusion is shown in Figure 10.
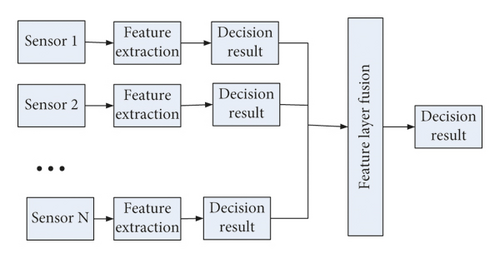
3.4.2. Decision-Making Layer Fusion of Heterogeneous Signals in Fatigue Driving Detection
- (1)
Collection of characteristic data: Experiments are conducted in a good city road environment. At the same time, the above three devices collect data under different driving behaviors and simply process the collected sensor raw data: cutting samples, labeling, and the obtained data as the information converged data layer.
- (2)
Feature extraction: The feature extraction is performed on the data of the three information sources. The feature extraction method is the same as the above.
-
The same method is adopted, and the feature is obtained as the feature layer of information fusion.
- (3)
Train their respective identification models. Train the three features of the feature layer using different overlimit learning machine algorithms.
-
Three identification models are obtained, and their respective decision-making results are obtained.
- (4)
Integration of decision-making levels: The decision results obtained in the third step are fused through the designed fusion method to obtain the final recognition result.

4. Experiments and Results of Heterogeneous Information Fusion Methods
Based on the feature collection of EOG, ECG, and steering wheel proposed above and the extraction algorithm of several features such as heart rate, blink frequency, eyelid closure, and the final decision fusion algorithm, this article designs a set of fatigue verification methods to verify the feasibility of the fatigue detection methods designed in this article. In the article, a certain fatigue-induced paradigm was selected and the physiological data of 10 subjects were collected, and then the results were statistically verified.
4.1. Fatigue Induction Method
The main purpose of the experiment here is to induce fatigue in the subjects, measure its various physiological indexes under the state of fatigue occurrence, and make calculations and analysis. The obtained characteristic index is compared with the index calculated from the collected signals in the mental state, and finally the judgment result of the fatigue state is obtained. This experiment requires a more natural and undisturbed induction method. Choosing the method of neutral long-term video stimulation can make the individual produce a spontaneous fatigue response. In the actual experiment arrangement, this article selected 5 subjects who are adult, healthy, non-drug-addicted individuals who are not taking any drugs, and the subjects are all young people aged 20–35 to ensure that the data is comparable. Five subjects were subjected to 25 minutes of real-time data collection of ECG, breathing rate, eye movement, and steering wheel information. A certain neutral video stimulus was given during the acquisition process to induce sleepiness in the subjects, and the physiological parameters in the process were recorded, and the characteristic indexes were calculated. The subjects were still awake at the beginning of the experiment. The parameter characteristics are compared, and the final result is obtained.
4.2. Data Analysis
Using the algorithm proposed in Section 2, this paper calculates the collected data and obtains its characteristic parameters by statistics. The detailed results are shown in Figure 12.
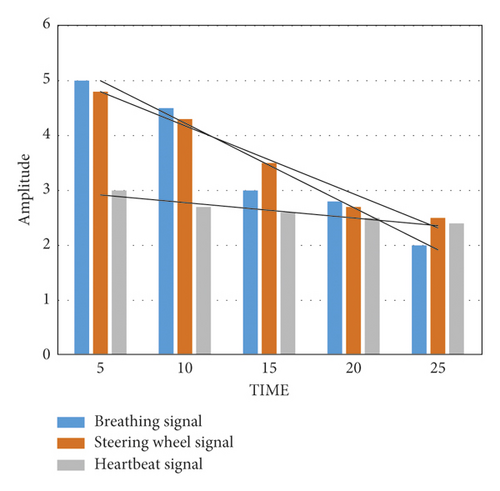
Statistical recognition rates of fatigue driving samples were 81%, 75%, 79%, 76%, and 76%, respectively. Judging by the predictions of the Extreme Learning Machine, the detection rate of the alarm state was as high as 81% of the steering wheel signal under varying degrees of fatigue in the steering wheel change trend. The signal currently predicts the level of fatigue while driving. In drowsy conditions, the range of steering angle changes is gradually reduced and the number of settings is significantly reduced. The depth of breathing in the normal signals of the driver is accompanied by a deeper sleep. The depth and width of the breath and the frequency gradually decrease.
Figure 13 shows the blink frequency per unit time calculated from the electrooculogram signal. This article chooses to use 1 minute as the unit. It can be clearly seen that as the experiment progresses, the blink frequency of the five subjects has increased significantly.
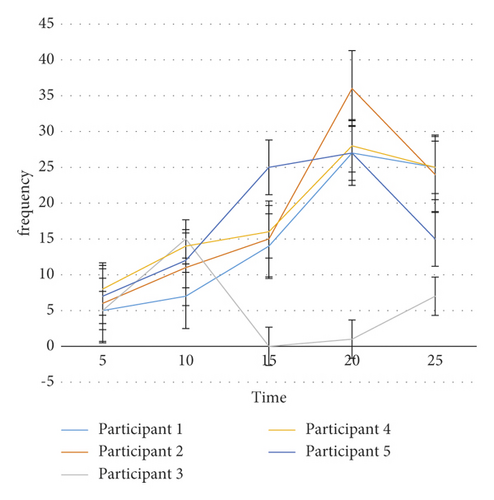
Based on the above statistical results, it can be seen that there is a certain correlation between blinking frequency and fatigue. The higher the blinking frequency, the more fatigued. Participants blinked more frequently when they entered a state of fatigue. In addition, it can be seen from Figure 13 that as fatigue deepens, the blink frequency of many subjects has a certain downward trend relative to the maximum value.
Figure 14 shows the eyelid distance per unit time calculated from the eye movement signal. The unit of 1 min is chosen. It can be clearly seen that as the experiment progresses, the eyelid distance gradually decreases in all five subjects.
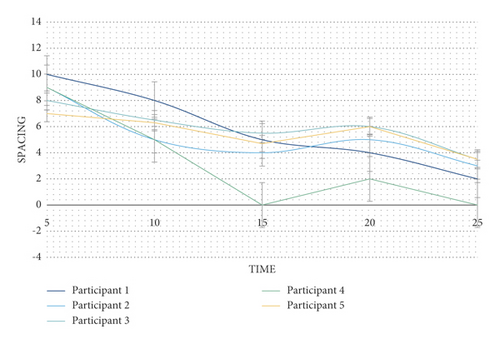
From the above figure, it appears that the degree of eyelid closure can be used as a relative indicator to determine fatigue. In addition, Figure 14 shows that the fourth person sleeps in 15 minutes, when their eyelids are closed, and woke up after 16 minutes. Although different from the data of other volunteers, the general trend of change for each person, of course, is a downward one.
In summary, the experimental results show that the fatigue detection method of heterogeneous signal fusion can improve the accuracy of fatigue detection while avoiding the impact on driver behavior.
5. Discussion
This paper firstly collects and extracts features from physiological signals, driver operation signals, and eye signals in fatigue detection, and then performs signal fusion on the extracted signals to achieve a higher accuracy rate of fatigue driving detection, and finally performs signal fusion. In the detection experiment of the method, it is concluded that the accuracy of the fatigue driving detection method of the heterogeneous signal fusion method is higher than that of the driving fatigue detection method of a single signal source through the statistics of the super learning machine algorithm. The research of this article has not enough understanding of the signal fusion method, but the research of this article has certain reference value for the detection method of fatigue driving. It provides a certain research route for future fatigue driving detection methods. This article still has some shortcomings. For example, the number of samples selected in our research process is not very large, and the data obtained is often not comprehensive enough. Driving fatigue is a problem that drivers often face. Combining with heterogeneous signal fusion methods can certainly make the research on driving fatigue more in-depth.
Conflicts of Interest
The authors declare that they have no conflicts of interest regarding the publication of this research article.
Acknowledgments
This work was supported by the Project of Department of Education, Jiangxi Province (no. GJJ191000).
Open Research
Data Availability
The data underlying the results presented in the study are available within the manuscript.


