Analysis of Influencing Factors of Financial Market Volatility Based on Cluster Analysis
Abstract
The financial market has certain volatility in its stability due to the influence of many factors. In the analysis of the financial market, it is necessary to combine scientific and effective intelligent algorithms. Based on the cluster analysis algorithm, this paper analyzes the factors affecting financial market volatility. Moreover, this paper conducts a more in-depth study and summary of the fuzzy C-means clustering algorithm, derives the analysis and solution process of the improved algorithm in detail, and gives the steps to improve the clustering algorithm. In addition, this paper constructs an analysis model of financial market volatility influencing factors based on cluster analysis and establishes a supply chain financial credit risk evaluation index system that includes the quality of corporate managers, corporate indicators, and asset structure. Finally, this paper verifies the performance of the algorithm model of this paper through experimental research. It can be seen from the experimental research results that the methods and models proposed in this paper have certain effects.
1. Introduction
As the trade exchanges of countries around the world have become more and more open, the degree of global economic integration has further deepened, and the financial systems of various countries have become more and more closely connected. The integration of the world economy and finance, on the one hand, makes resource allocation more efficient and is more conducive to the complementary advantages of various countries to develop their own economies. However, on the other hand, the irrational behavior of a country’s financial market can quickly spill over to other countries based on the linkages between finance and trade and investors’ irrational behavior. Since the 1990s, extreme risk events in the financial market and even financial crises have occurred frequently. Since the beginning of the 21st century, the two most typical and wide-reaching financial crises are the global financial turmoil that originated from the evolution of the US subprime mortgage market and the European sovereign debt crisis. Although the impact of the two crises was different, they had a great impact on the world financial system and the real economy [1].
Regional economic cooperation organizations or cross-regional international financial and economic cooperation organizations formed based on geographic or political relations have formed different national groups in the global economic and financial system and have become intersecting subsystems. Due to the differences in the economic development and national strength of the member countries in each country group, the international influence of each subsystem and its contribution to world economic development also have certain differences. An important manifestation of this country grouping trend is the establishment of free trade areas in many regions of the world, such as the European Union, North American Free Trade Economic Area, and ASEAN. In addition, some economic cooperation organizations and international economic cooperation forums have also closely linked some countries to form a regional group of countries.
With the continuous deepening of cooperation in all aspects, this has also established a certain foundation and conditions for financial risk spillovers between different member states in the same country group and between different country groups. With the deepening of the development of financial and trade cooperation, whether the outbreak of extreme financial market risk in a country will cause the net contagion of extreme financial market risk due to similarities in the economic development structure and systems of the member countries in the group is a question worthy of our consideration. In addition, whether this will lead to the withdrawal of international investors from several other member states, currency shocks, or collective sell-offs in the securities market is also a question worthy of our consideration. The study of extreme risks in financial markets is an emerging topic in the academic circles in recent years [2]. The analysis of the dynamic mechanism and spillover mechanism of extreme risk spillover effects in financial markets will help the financial systems of various countries to prevent the outbreak of extreme risk events in the financial market and understand the risk spillover path and risk governance after the outbreak of extreme risks in the financial market. For emerging economies like China where the financial system has government regulation and has not yet fully opened up, it is particularly important to study the extreme risk spillover mechanism of the financial market. Understanding the cause and path of the net contagion of extreme risks in the financial market will help prevent the introduction of foreign risks into the domestic financial market and cause financial panic among Chinese investors and minimize the impact of extreme risks in the foreign financial market on my country’s financial markets. This paper builds an analysis model of market volatility influencing factors based on cluster analysis algorithm and verifies the performance of this model through system analysis.
2. Related Work
The basic factors that cause the formation of extreme risks in the financial market net contagion mainly include the change in investor’s psychological expectations when the risk erupts, the change in risk preference caused by risk aversion, and the financial panic and herd behavior formed on the basis of these two aspects [3]. Literature [4] proposed that financial market fluctuations are sometimes irregular in the short term; that is, they sometimes decouple from the economic foundation in the short term, and they only depend on the interaction between investor behavior and psychological expectations. Literature [5] pointed out that, due to the asymmetry of information, in the real financial environment, whether it is a “field-tested” investor, broker, professional investment analyst, financial planner, or an investment individual who has just entered the market, as a living ordinary person, they will be more or less affected by various psychological factors in the process of investing, which will eventually lead to widespread behavioral deviations. Literature [6] believed that mainstream economics has insufficient power to explain the anomaly in the market because its assumptions (rational people, efficient markets, and random walks) are inconsistent with the reality. Moreover, it introduced the theory of self-organization and percolation into the analysis of the investment decision-making behavior of investors. The study found that there is a consistent behavior of investors’ accidental group decision-making in the securities market. Under certain assumptions, the price and return of stocks should obey Brownian motion and Gaussian distribution, respectively, but the results of a lot of real market research are not the case. The inconsistency between the distribution of actual market returns and traditional assumptions indicates that the investment entities influence each other [7]. Literature [8] pointed out that the reversal of investor expectations and risk aversion cause funds to flow in the opposite direction, and the spread of panic psychology causes violent fluctuations in the price of financial assets, and liquidity declines geometrically from excess to insufficient under the effect of leverage. Literature [9] divided herding behavior into the herd behavior based on rational defects, the herd behavior based on incomplete information, the herd behavior based on the defect of remuneration structure, and the herd behavior based on the homogeneity of behavior. Both domestic and foreign fund markets have a certain degree of herding behavior, and this kind of herding behavior is more obvious in China’s fund market. Literature [10] pointed out that there is an interactive positive feedback mechanism between herding behavior and stock prices. The degree of this irrational behavior is an important indicator of the maturity and stability of a country’s stock market. When the market goes down, the group selling behavior caused by herd behavior will cause the price of financial assets to continue to fall, which will severely impact the confidence of the market. The disastrous result will be the outbreak of a crisis. Literature [11] pointed out that the herd mentality not only accelerates the bubble of the virtual economy during the boom period, but also accelerates the contagion and spread of the crisis during the crisis period. Literature [12] believes that, in the complex nonlinear real financial market, the heuristic decision-making behavior of market participants will create an empirical rule and aggravate the risk of the financial market. Literature [13] used the overconfidence and herding behavior theories in behavioral finance to analyze the causes and processes of the financial crisis of financial enterprises. Moreover, it believes that the mismanagement of company managers is the root cause of the financial crisis and that overconfidence leads corporate decision makers to underestimate risks and blindly expand and invest. Literature [14] believed that when extreme risk events occur in the financial market, people’s psychological stress is instantaneous or cumulative. Both are the process of changing the behavior after the accumulation of stimuli reaches the psychological threshold, but the accumulation time is not consistent. Literature [15] used the birth and death process to empirically analyze the coexistence of rational transactions and irrational traders in the securities market to verify that market mechanisms can eliminate irrational transactions in the long run. The results of the analysis show that even if they lose money, irrational traders will still exist in the market, and the market entry and exit of irrational traders depend on their initial wealth and other factors. Literature [16] explained the mechanism of risk contagion caused by price fluctuations by analyzing the migration of members between groups with different subjective expectations.
Regarding the concept of extreme risk in the financial market, scholars at home and abroad have not yet reached an agreement and few people directly define it. Literature [17] divided the risk transition into a general period and a period of extreme risk events in the financial market. Extreme events include events that are considered impossible or unexpected. Literature [18] called extremely destructive and extremely impactful small-probability financial events as extreme risks in the financial market. Literature [19] believed that the sharp rise and fall of stock indexes are extreme financial risks. Literature [20] regarded financial market emergencies that cause drastic changes in multiple financial and economic indicators as extreme risks.
3. Fuzzy C-Means Clustering Algorithm
Among the clustering algorithms based on objective functions, the theory of fuzzy c-means (FCM) algorithm is the most complete and the most widely used. The FCM algorithm was first proposed by E. Ruspinl, and later J.C.Dul and J.C.Bezdek extended the E.Ruspini algorithm from a hard clustering algorithm to a fuzzy clustering algorithm. The FCM algorithm is an unsupervised fuzzy clustering method derived from the optimization of the hard clustering objective function. It does not require human intervention in the process of algorithm implementation. The clustering result is the degree of membership of each data point to the cluster center, and the degree of membership is represented by a numerical value. The FCM algorithm not only has a deep mathematical foundation (orthogonal projection and mean square approximation theory), but also has been successfully applied in many fields. It is currently one of the most practical and popular fuzzy clustering algorithms [21].
3.1. The Evolution Process of the Objective Function
- (1)
Objective function of C cluster analysis
-
For the hard C cluster analysis of the data set, we assume that is the hard partition matrix, vi(i = 1,2, …, c) represents the cluster center of the i-th category, and the vector is vi = (vi1, vi2, …, vis) ∈ RC. Then the objective function of hard cluster analysis can be defined as [22]
(1) -
In the above formula, J0(U, V) represents the sum of the squares of the errors between the various samples and their typical samples. Hard clustering means that each object only belongs to the class to which the nearest cluster center belongs, that is, either one or the other.
- (2)
The objective function of the hard C cluster analysis of fuzzy concepts is introduced
-
When using the membership uik of the sample point xk and the i-th sample prototype as the weight to weight the distance, the clustering objective function at this time becomes
(2) - (3)
Objective function of fuzzy cluster analysis
-
According to the concept of fuzzy partition defined by Ruspini, Dulln extended the objective function of hard clustering to fuzzy clustering. Dunn uses the distance between the sample point and the cluster center and expresses it with the square weight of the membership degree and turns the within-class error sum of squares objective function into a weighted error square sum objective function. At this time, the clustering objective function becomes
(3) - (4)
Objective function of general fuzzy cluster analysis
-
The weighted error sum of square objective function proposed by Dunn was extended, and a more general expression was given based on the objective function clustering algorithm.
(4)
Among them, A is a symmetric positive definite matrix of s × s order, and I represents the identity matrix. When A = I, dik represents the Euclidean distance (Euclid). When A ≠ I, dik represents Mahalanobis distance (Mahalanobis).
3.2. Analysis and Solution Process Based on Objective Function Clustering Algorithm
- (1)
uik ∈ [0,1]; that is, every element in the matrix takes a value in the closed interval between 0 and 1
- (2)
; that is, the sum of the elements in each column is 1, and for a sample, the sum of the degrees of membership for each type is 1
- (3)
. This condition guarantees that each category is not empty
For the data set X, if the number of cluster categories C and the weight index m are given, the optimal fuzzy classification matrix and cluster center can be determined by the above two formulas.
The value of Jm(U, V) reflects the intraclass compactness under a certain differential definition. The smaller the Jm(U, V), the tighter the clustering.
-
Step 1: Initialize each parameter. It includes the number of iterations l = 0, the fuzzy weighting index m, the number of clustering categories c, the iteration stop threshold ε, and the initial cluster center matrix V(0).
-
Step 2: The fuzzy classification matrix U composed of the membership value uik is calculated. ∀i, k(i = 1,2, …, c; k = 1,2, …, n).
-
If , then
(20) -
If , then , and for ∀j ≠ i, there is .
-
Step 3: The cluster center value is updated.
(21) -
Step 4: If ‖V(l + 1) − V(l)‖ > ε, then l = l + 1, and the algorithm goes to step 2; otherwise the iteration stops.
4. Analysis Model of Factors Affecting Financial Market Volatility Based on Cluster Analysis
When analyzing the factors affecting financial market volatility, this paper mainly combines cluster analysis algorithms for data analysis. From a practical point of view, the factors affecting financial market volatility occur in all links of the financial chain. Therefore, the model structure can be constructed in conjunction with supply chain finance when constructing the model.
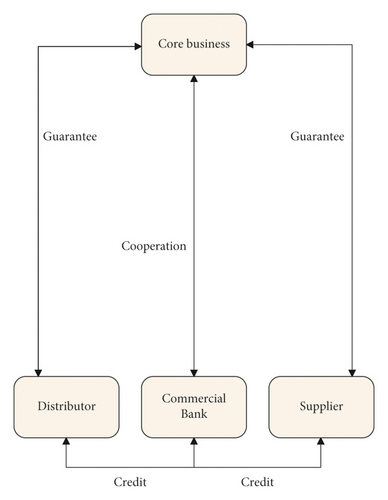
Supply chain finance is different from the traditional credit service model in that it includes enterprises of different sizes and profitability. Participants include not only upstream and downstream small and medium-sized enterprises in the disadvantaged supply chain finance, core enterprises in a dominant position, but also financial institutions and supporting enterprises outside the supply chain finance. The relationship between the four types of entities in supply chain finance is shown in Figure 1.
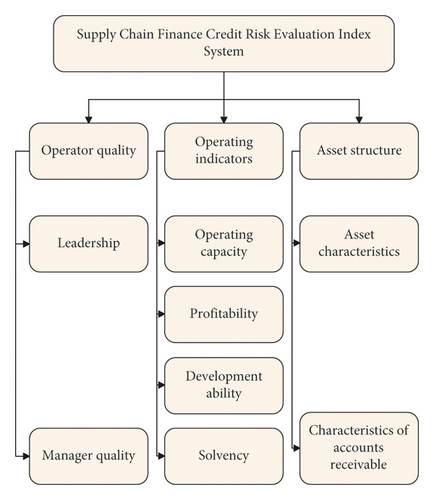
In most risk assessment models, scholars use expert opinions or questionnaires to quantify some qualitative indicators, but this will also reduce the accuracy of the data used. Since this paper cannot use expert opinions or questionnaire surveys, qualitative indicators are not involved. This article introduces the change of the Brownian motion interference term to simulate the impact of qualitative indicators on the default strategy adopted by small and medium-sized enterprises in supply chain finance. Therefore, a supply chain financial credit risk evaluation indicator system can be established that includes the quality of business operators, corporate indicators, and asset structure based on the abovementioned principles for setting credit risk evaluation indicators, as shown in Figure 2.
Under the supply chain finance business model of introducing credit default swaps, the basic business process of supply chain finance is the same. Banks, borrowing enterprises, logistics enterprises, and institutional investors first sign a four-party agreement. It is stipulated that the property rights involved in either the advance payment financing of the borrowing enterprise or the inventory pledge financing shall be monitored by logistics enterprises. Logistics enterprises regularly monitor the market price of pledged goods based on their market experience. While providing loans to borrowing enterprises based on pledged goods, banks regularly pay insurance premiums to institutional investors. Once the borrowing enterprise defaults, the institutional investor will compensate the pledged goods for insufficient part of the bank’s losses. The specific process is shown in Figure 3:

The futures contract locks the market price of the underlying asset at a specified price in the future, thereby realizing hedging and avoiding the risk of changes in the spot market price of the underlying asset. Figure 4 shows the return of the standard asset futures market, divided into long and short situations.
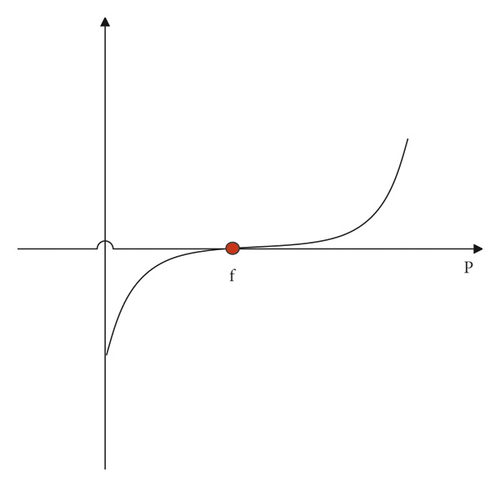
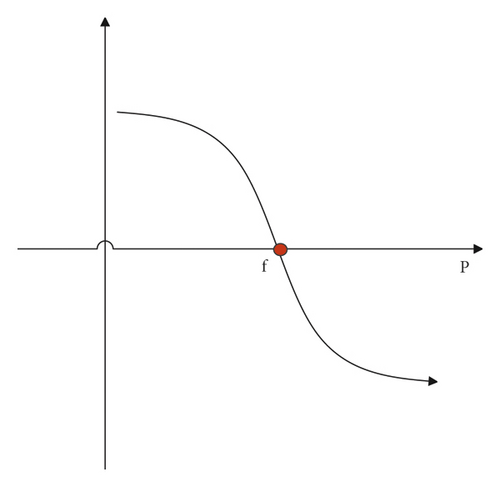
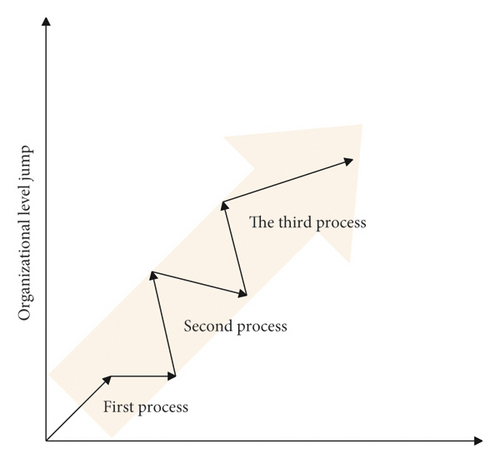
The return of long positions rises with the rise in the price of the underlying asset at maturity, and the return on short positions declines with the rise in the price of the underlying asset at maturity, while the return on the spot market is the opposite, risk hedging of market underlying assets. Although it avoids losses while also avoiding gains, the price of the underlying asset is locked in, which plays a role in preserving value. The purpose of futures contracts is exactly the same. The focus is not on income, but on self-protection from falling prices. In reality, most phenomena are nonequilibrium phenomena and are far from equilibrium. This is different from an isolated system. An isolated system is an idealized system that does not exchange any energy or information with the outside world. This is inconsistent with most objective phenomena. Philosophical theory points out that the components in the self-organizing structure will interact and influence each other to form a unified whole. The member states in each economic cooperation organization are a unified whole formed by interaction and mutual influence, but the degree of self-organization is different. The government, as a national actor, sometimes has a certain bounded rationality in its behavior, and a country’s government behavior may cause bounded rational responses from other governments in the same subgroup. Figure 5 shows the evolution process of self-organization.
Social networks are introduced to build an Internet finance supernetwork that considers the level of relationships. Decision makers still include four levels, namely, H fund owners, I Internet financial intermediaries, J traditional financial intermediaries, and K fund demanders, as shown in Figure 6.
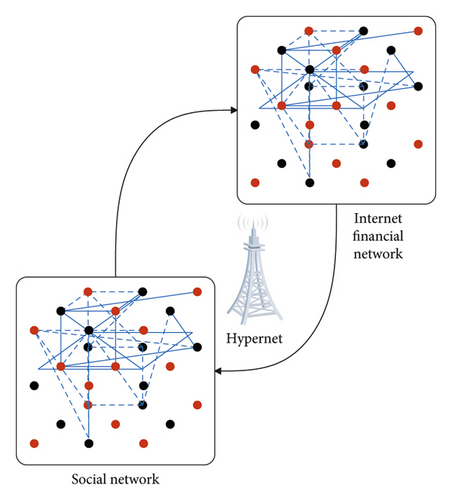
This super network is composed of the social network on the lower left and the Internet financial network on the upper right. The network flow in the social network describes the level of the relationship between the two nodes, and the network flow in the Internet financial network describes the funds traded between the two nodes. The dotted line on the periphery of the network indicates the integration of these two separate networks into a supernetwork. The social network on the bottom left is also a four-layer network. The first layer represents the fund owner, and the symbol h represents a specific source of funds. The second layer represents Internet financial intermediaries, and the symbol i represents a specific Internet financial intermediary. The third layer represents traditional financial intermediaries, and the symbol j represents a specific traditional financial intermediary. The bottom layer represents the demand market, and the symbol k represents a specific fund demander.
5. Analysis of Factors Affecting Financial Market Volatility Based on Cluster Analysis
With the support of cluster analysis algorithm, an analysis model of financial market volatility influencing factors based on cluster analysis is constructed. Next, it is necessary to verify the performance of the system and conduct research on financial market data. This article collects financial data in recent years through the Internet and links these data with financial market conditions at the same time. First of all, this paper uses the system constructed in this paper to cluster financial data and calculate the accuracy of clustering. The results are shown in Table 1 and Figure 7.
| Num | Clustering effect |
|---|---|
| 1 | 75.83 |
| 2 | 74.39 |
| 3 | 90.50 |
| 4 | 83.15 |
| 5 | 81.73 |
| 6 | 77.40 |
| 7 | 76.75 |
| 8 | 76.02 |
| 9 | 89.64 |
| 10 | 74.71 |
| 11 | 81.89 |
| 12 | 72.56 |
| 13 | 73.21 |
| 14 | 71.81 |
| 15 | 88.57 |
| 16 | 79.99 |
| 17 | 86.74 |
| 18 | 91.44 |
| 19 | 82.06 |
| 20 | 72.70 |
| 21 | 72.97 |
| 22 | 88.05 |
| 23 | 80.24 |
| 24 | 82.26 |
| 25 | 85.39 |
| 26 | 82.10 |
| 27 | 87.26 |
| 28 | 72.11 |
| 29 | 77.73 |
| 30 | 73.48 |
| 31 | 72.95 |
| 32 | 88.01 |
| 33 | 80.28 |
| 34 | 80.99 |
| 35 | 81.68 |
| 36 | 85.63 |
| 37 | 90.48 |
| 38 | 82.29 |
| 39 | 88.41 |
| 40 | 77.81 |
| 41 | 87.86 |
| 42 | 83.84 |
| 43 | 85.08 |
| 44 | 85.65 |
| 45 | 89.69 |
| 46 | 91.09 |
| 47 | 91.10 |
| 48 | 78.26 |
| 49 | 74.13 |
| 50 | 91.36 |
| 51 | 82.83 |
| 52 | 87.51 |
| 53 | 83.39 |
| 54 | 77.76 |
| 55 | 83.68 |
| 56 | 80.04 |
| 57 | 77.60 |
| 58 | 90.29 |
| 59 | 86.64 |
| 60 | 77.42 |
| 61 | 71.06 |
| 62 | 80.74 |
| 63 | 71.65 |
| 64 | 91.95 |
| 65 | 71.39 |
| 66 | 73.44 |
| 67 | 80.64 |
| 68 | 75.23 |
| 69 | 91.77 |
| 70 | 91.51 |
| 71 | 81.62 |
| 72 | 72.91 |
| 73 | 75.11 |
| 74 | 85.12 |
| 75 | 83.75 |
| 76 | 83.97 |
| 77 | 71.47 |
| 78 | 91.34 |
| 79 | 81.28 |
| 80 | 79.70 |
| 81 | 87.13 |
| 82 | 75.77 |
| 83 | 83.83 |
| 84 | 83.08 |
| 85 | 90.73 |

From the above analysis, the clustering accuracy of the analysis model of financial market volatility influencing factors based on cluster analysis constructed in this paper is relatively high. On this basis, this paper analyzes the factors affecting market volatility and compares the analysis results of this paper with the actual situation and calculates the accuracy of the analysis of factors affecting market volatility. The results obtained are shown in Table 2 and Figure 8.
| Num | Accuracy (%) |
|---|---|
| 1 | 71.44 |
| 2 | 69.83 |
| 3 | 70.15 |
| 4 | 73.05 |
| 5 | 80.04 |
| 6 | 79.18 |
| 7 | 75.33 |
| 8 | 68.73 |
| 9 | 76.26 |
| 10 | 70.45 |
| 11 | 77.80 |
| 12 | 75.03 |
| 13 | 81.50 |
| 14 | 71.22 |
| 15 | 79.53 |
| 16 | 73.28 |
| 17 | 83.82 |
| 18 | 75.21 |
| 19 | 68.53 |
| 20 | 79.00 |
| 21 | 75.41 |
| 22 | 72.65 |
| 23 | 74.63 |
| 24 | 73.91 |
| 25 | 76.55 |
| 26 | 73.51 |
| 27 | 85.35 |
| 28 | 74.89 |
| 29 | 79.01 |
| 30 | 69.15 |
| 31 | 82.35 |
| 32 | 76.74 |
| 33 | 76.92 |
| 34 | 68.71 |
| 35 | 71.82 |
| 36 | 73.05 |
| 37 | 79.54 |
| 38 | 69.72 |
| 39 | 78.89 |
| 40 | 73.06 |
| 41 | 68.25 |
| 42 | 75.20 |
| 43 | 80.14 |
| 44 | 68.79 |
| 45 | 83.39 |
| 46 | 77.15 |
| 47 | 68.73 |
| 48 | 81.87 |
| 49 | 85.30 |
| 50 | 68.55 |
| 51 | 72.80 |
| 52 | 79.33 |
| 53 | 73.96 |
| 54 | 83.18 |
| 55 | 84.92 |
| 56 | 81.86 |
| 57 | 82.85 |
| 58 | 76.03 |
| 59 | 80.84 |
| 60 | 75.81 |
| 61 | 71.80 |
| 62 | 79.48 |
| 63 | 80.35 |
| 64 | 77.38 |
| 65 | 76.58 |
| 66 | 70.21 |
| 67 | 77.43 |
| 68 | 82.54 |
| 69 | 70.10 |
| 70 | 72.37 |
| 71 | 68.93 |
| 72 | 79.16 |
| 73 | 72.97 |
| 74 | 69.40 |
| 75 | 76.79 |
| 76 | 75.74 |
| 77 | 76.74 |
| 78 | 83.00 |
| 79 | 85.25 |
| 80 | 82.47 |
| 81 | 73.86 |
| 82 | 70.52 |
| 83 | 82.73 |
| 84 | 78.44 |
| 85 | 71.40 |
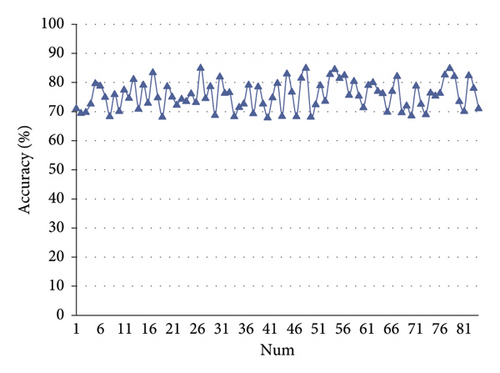
From the above analysis results, the analysis model of financial market volatility influencing factors constructed in this paper based on cluster analysis has a certain effect in the analysis of financial market volatility influencing factors and can be applied to actual financial analysis.
Through model analysis, the following conclusions can be drawn:
For fund owners, idle funds mean waste, and the best decision-making plan is still to invest all the funds. Regarding the choice of financial intermediary, considering the existence of the relationship level, the good cooperative relationship with traditional financial intermediaries in the past will increase trust, reduce transaction costs and risks, and make fund owners willing to accept a lower rate of return on investment. Invest in traditional financial intermediaries. For Internet financial intermediaries, they not only face more significant operational risks and credit risks, but also face new entry into the financial field, lack previous cooperation and personal relationships, and face the negative effects of social networks that existed in the past. First of all, it is necessary to increase risk awareness and strengthen the identification, assessment, and response to risks; secondly, it is necessary to pay additional costs to actively establish and maintain relationships with other decision makers, maintain a certain level of relationship, and promote the conclusion of transactions. For traditional financial intermediaries, the level of relationship established and maintained in the past will be very beneficial to their own development, but the higher return on investment requirements of capital owners and the huge challenges of Internet financial intermediaries must not be ignored. They need to be prepared for danger and maintain their own advantages. At the same time, it has made breakthroughs and innovations and actively transformed itself into Internet financial intermediaries. For the government and the entire market, the development of the Internet has exacerbated the complexity of the financial network, making all decision makers in the network face higher system risks. The government needs to strengthen supervision and introduce a credit management system as soon as possible, which is the future of Internet finance. The road to development lays the cornerstone. At present, the entire market is highly active and in a period of rapid development. It requires the combination of the invisible hands of the market and the visible hands of the government to jointly promote the healthy and rapid development of the Internet finance industry.
6. Conclusion
This article mainly adopts the research method that combines theoretical analysis and simulation experiment. Based on the detailed analysis of the credit risk manifestations and causes of the supply chain financial business, the cluster analysis algorithm is used to analyze the factors affecting financial market fluctuations. Moreover, this paper conducts a more in-depth study and summary of the fuzzy C-means clustering algorithm, derives the analysis and solution process of the algorithm in detail, and gives the steps of the fuzzy C-means clustering algorithm. In addition, this paper combines the actual needs of financial analysis to construct a cluster analysis-based analysis model of financial market volatility factors, verify the system model, and verify the validity of the model through experimental research. From the research results, it can be seen that the model constructed in this paper has a certain effect.
Conflicts of Interest
The author declares no competing interests.
Acknowledgments
This study was sponsored by Xinyang Normal University.
Open Research
Data Availability
The labeled dataset used to support the findings of this study is available from the corresponding author upon request.


