Human Falling Recognition Based on Movement Energy Expenditure Feature
Abstract
Falls in the elderly are a common phenomenon in daily life, which causes serious injuries and even death. Human activity recognition methods with wearable sensor signals as input have been proposed to improve the accuracy and automation of daily falling recognition. In order not to affect the normal life behavior of the elderly, to make full use of the functions provided by the smartphone, to reduce the inconvenience caused by wearing sensor devices, and to reduce the cost of monitoring systems, the accelerometer and gyroscope integrated inside the smartphone are employed to collect the behavioral data of the elderly in their daily lives, and the threshold analysis method is used to study the human falling behavior recognition. Based on this, a three-level threshold detection algorithm for human fall behavior recognition is proposed by introducing human movement energy expenditure as a new feature. The algorithm integrates the changes of human movement energy expenditure, combined acceleration, and body tilt angle in the process of falling, which alleviates the problem of misjudgment caused by using only the threshold information of acceleration or (and) angle change to discriminate falls and improves the recognition accuracy. The recognition accuracy of this algorithm is verified by experiments to reach 95.42%. The APP is also devised to realize the timely detection of fall behavior and send alarms automatically.
1. Introduction
Human behavior recognition has a rich and powerful role in many fields. It can be used for health detection, fall detection, and medical assistance, and it plays an important role in human health. In the field of medical assistance, a typical application is fall detection. Falling may cause serious injury to the elderly. Using smartphones or wearable smart devices can help detect falls in time and automatically send alarms. Therefore, the research and development of behavior recognition technology can not only help people’s daily life but also make people’s daily life more convenient and make the entire society more intellectual.
With the development of sensor devices, various sensors that can accurately collect human behavior activity data have been widely used on wearable devices such as bracelets, watches, and mobile phones. Compared with behavior recognition methods based on video images, behavior recognition based on sensors has the characteristics of low cost, flexibility, and good portability. Therefore, the research on human activity recognition based on wearable sensors has become a research hotspot in behavior recognition [1]. With the rapid development of sensors and electronic equipment, the improvement of performance, and the reduction of cost, these electronic components are more widely used in life [2]. In particular, the development of the smartphone and the good application prospects of human activity recognition in human health monitoring, entertainment, sports, and so on make sensor-based human activity recognition one of the research hotspots. Compared with the disadvantages of high cost and poor portability of deploying external devices to identify human activity status, wearable sensors and smartphones can easily collect various behavior data of the human body through integrated sensors to identify the human activity status [3].
The threshold analysis method is one of the main research methods in the field of human behavior recognition at home and abroad [4]. Data samples in domestic and foreign studies are mostly from accelerometers, gyroscopes, or both. At present, different machine learning algorithms or threshold analysis methods are used to study the falling behavior of the elderly at home and abroad. The machine learning algorithms used in the study include support vector machine (SVM) [5], decision tree, hidden Markov model (HMM) [6], k-nearest neighbor [7], extreme learning machine, neural network, and deep learning [8]. Some researchers determine the optimal threshold value by maximizing the possibility of fall to ensure a low misjudgment rate. The present research is very serious about the misjudgment of the fall process and similar motion state recognition. The recognition accuracy of human fall behavior is not high enough, and the recognition accuracy of different methods is not the same [9].
Human activities are complex and uncertain, so there will be a great misjudgment to judge the occurrence of human falls solely based on the relevant threshold information of acceleration or angle change. For example, the acceleration of a strenuous exercise, such as running or jumping, may exceed the threshold for falling behavior, but not for falling [10]. Due to different people and different sports behaviors, there will be a different energy expenditure. The analysis shows that the energy expenditure of human sports will have significant changes in the occurrence of falling behavior. Therefore, this paper proposes to take human movement energy expenditure a feature of fall behavior recognition.
From the view of the statistical analysis, the falling behavior is accompanied with great changes in body tilt angle, body movement energy expenditure, and acceleration in most cases and, then, other nonfalling behaviors, such as standing, walking, and sitting down in everyday life [11]. Therefore, this paper proposes a threshold analysis method to detect the occurrence of fall behavior from three aspects: human movement acceleration, human movement energy expenditure, and body tilt angle away from the vertical direction.
2. Falling Behavior Recognition Data Acquisition
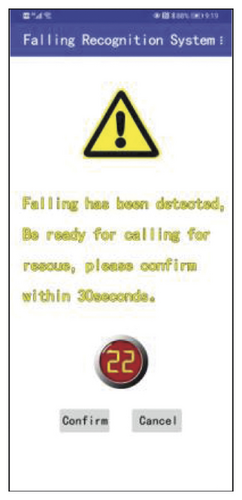
With the improvement of people’s living standards, the smartphone has been widely used. People’s life is increasingly inseparable from smartphones, and they are basically inseparable from the phone. The research in this paper is to further make full use of the smartphone. To collect the data of users’ daily activities and behaviors for data analysis and verification of the algorithm proposed in this paper, a simple Android application (APP) is developed and deployed on the Huawei phone for data collection and real-time fall behavior detection. Figure 1 shows the user interface (UI) of the APP.

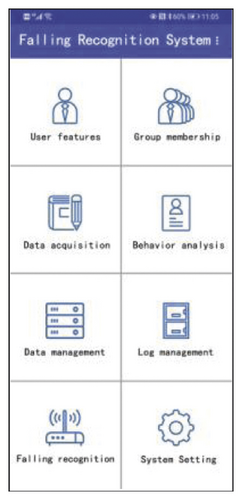
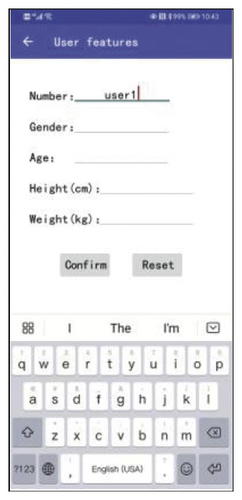
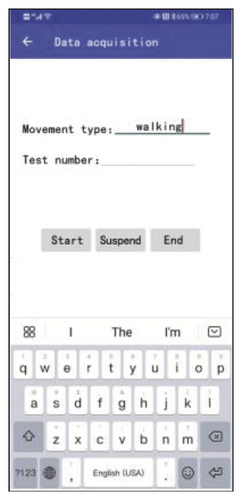
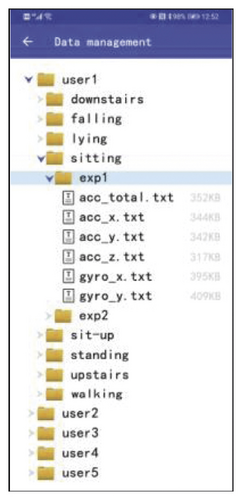
Through the integrated acceleration sensor and gyroscope in the mobile phone, the data samples of kinematics-related information of the human body can be collected in real time. In the process of human movement, the acceleration and angle of different parts of the body are different [12]. To improve the accuracy of fall identification, the parts that are not easy to produce similar acceleration and angle with other daily activities should be chosen as the reference objects for information acquisition [13]. Because the wrist, upper arm, forearm, thigh, leg, and other parts in daily life are frequent and complex, have strong randomness, and are not conducive to the placement of the smartphone, they are not suitable as feature parts. However, the upper torso of the human body in normal daily life behaviors, such as walking and sitting, has a relatively stable movement change process. In contrast, in the process of falling, the speed change and angle change are more drastic, so it is more suitable for acceleration and other relevant information acquisition parts. In this paper, the upper pocket of the jacket is chosen as the placement position of the smartphone.
In view of [14–17] that use the threshold analysis method to identify human daily activities and behaviors, the number of experimental data collected is less than 10. For the safety of the elderly, it is not convenient to collect too many elderly people as volunteers for data collection. So, the data set required for this experiment came from the behavior and activity process of 5 old persons in daily life. The smartphone equipped with APP was placed in the chest pocket of each old person’s jacket, and the accelerometer and gyroscope data of 9 common behaviors and activities in daily life were collected. Since falling is not a frequent phenomenon in the normal life of the elderly, it is necessary to simulate the occurrence of falling on a mattress with a thickness of about 10 cm. Table 1 describes the details of the data collection.
| Daily life behavior activities | Standing, walking, sitting, standing to sitting, sitting to standing, standing to squatting, squatting to standing up, going up the stairs, going down the stairs |
| Sensors | Triaxial accelerometer, gyroscope |
| Numbers of volunteers | 5 |
| Volunteers’ age | 64∼78 years |
| Volunteers’ weight | 57∼78 kg |
| Volunteers’ height | 165∼176 cm |
| Sliding window size | 0.5 s (25 sampling points) |
| Window overlap size | 0.2 s (10 sampling points) |
-
Standing: 1 minute/time, 10 times.
-
Walking: 1 minute/time, 10 times, walking at normal speed in daily life.
-
Sitting: 1 minute/time, 10 times, sitting on a chair with armrests.
-
Standing to sitting: 10 times, at the normal rate of sitting in daily life.
-
Sitting to standing up: 10 times, at the rate of standing up normally in daily life.
-
Standing to squatting: 10 times, at the rate of normal squats in daily life.
-
Squatting to standing up: 10 times, at the speed of normal stand up in daily life.
-
Stepping up the stairs: 10 times per minute, walking up the stairs instead of taking the elevator.
-
Stepping down the stairs: 10 times per minute, walking down the stairs instead of taking the elevator.
-
Falling: 20 times, divided into forward fall, backward fall, right fall, and left fall, 5 times each. It simulates the fall of the human body under different circumstances, such as loss of control of lower limbs and dizziness, on a mattress with a thickness of about 10 cm.
-
Falling while walking: 10 times, falling forward while walking, that is, tripping.
The data obtained from data collection exists in the form of the data stream, which needs to be segmented. This paper uses the sliding window technique to split the raw data into data fragments that represent a single complete activity. The window size mainly refers to the duration of a single activity. Because a 0.5-second time window can well cover the whole process of a complete fall and impact, the sliding window size adopted in this paper for the segmentation of experimental data is 0.5 seconds (25 data sample points), with 40% overlap between the Windows. In the following paper, the unit time for calculating the energy expenditure of human movement is 0.5 seconds; that is, the energy expenditure value of human movement is calculated once within each time window [18].
3. Feature Extraction
Feature extraction is the key to behavior recognition research. The extracted features directly affect the subsequent calculation tasks and the accuracy of classification and recognition. The feature extraction methods of human behavior recognition research can be divided into three kinds: time-domain analysis, frequency-domain analysis, and time-frequency-domain analysis [19].
3.1. The Method of Feature Extraction
3.1.1. Time-Domain Analysis
The time-domain analysis method is used to extract features from sensor signals, that is, to directly extract features from acceleration and angle signals. This method is simple and has a small amount of calculation. The traditional time-domain characteristics include mean, standard deviation, signal power, correlation between axes, peak intensity, zero-crossing rate, and percentiles.
3.1.2. Frequency-Domain Analysis
After the sensor signal is converted from the time domain to the frequency domain, the corresponding features are extracted from the frequency domain. The commonly used time-domain to frequency-domain conversion methods include Fast Fourier Transform (FFT) and Discrete Cosine Transform (DCT). The frequency-domain features are FFT coefficient, DCT coefficient, Power Spectral Density (PSD), and frequency-domain entropy (FDE) [20].
3.1.3. Time-Frequency-Domain Analysis
Compared with the time domain analysis and frequency domain analysis, the traditional Fourier transform can only extract the frequency domain characteristics of the sensor signal but discard the time domain information of the signal. The emergence of wavelet transform can solve this problem well. Compared with the traditional Fourier transform, wavelet transform is the local transform of time and frequency, which solves many problems that cannot be solved by Fourier transform [21].
3.2. Extracted Features
Combined with the above feature extraction methods, the characteristics that distinguish human falls from other daily behaviors include combined acceleration, movement energy expenditure, and body tilt angle.
3.2.1. Combined Acceleration
The combined acceleration is an important parameter to distinguish the state of human movement. The smaller the acceleration a is, the gentler the human movement will be; the larger the acceleration a is, the more intense the human movement will be. When the body falls, there is a bump phase in contact with the ground, and the acceleration peaks, which is more pronounced than normal behavior [22]. Therefore, using a statistical method to determine the threshold value of the difference of the combined acceleration amplitude between the fall process and other daily life and behavior processes can provide a basis for the human fall identification method.
3.2.2. Movement Energy Expenditure
To calculate the u value in the calculation equation of human movement energy expenditure, based on the combined acceleration generated by volunteers when running at a speed of 10 km/h, the minimum and maximum values of the obtained combined acceleration data were, respectively, substituted into the calculation equation (2) of human movement energy expenditure. To improve the accuracy of calculation, the time unit of the experiment was set as 1 second; that is, the value of u was obtained by calculating the energy expenditure of the human body in motion within 1 second, which was verified in the movement energy expenditure detection at other speeds.
The detection of movement energy expenditure needs data comparison. “Double standard water detection method” is the gold standard, but its cost is high and the use is complicated, so it is not easy to implement it as a reference for the experiment. According to the existing human movement energy expenditure detection methods, in view of the advantages of convenient use, low cost, and high accuracy, the treadmill has become the standard of many energy expenditure detections at present. Life Fitness T5, the runner used in this experiment, can adjust the running speed range from 0.8 km/h to 19 km/h and the slope range from 0% to 15%, and the energy expenditure detection accuracy is above 95%.
When one volunteer was randomly selected to run on a treadmill at 10 km/h, the energy expenditure in 1 minute was 9500 cal, and the average energy expenditure in 1 second was 158 cal. So, the parameter u = 0.008 was obtained. By substituting this value into equation (2), the energy expenditure of the volunteer when running at 1 km/h and 5 km/h within 1 s is 15 cal and 46 cal, respectively, while the energy expenditure of the volunteer when running at 1 km/h and 5 km/h on the treadmill is 16 cal and 48 cal, respectively. Experimental results show that the measurement accuracy is above 94%.
3.2.3. Body Tilt Angle
The occurrence of human falling behavior will be accompanied by the change of the angle of the trunk. For example, in the case of a fall while walking or standing, the torso changes from a nearly vertical to a nearly horizontal orientation, with an inclination change of nearly 90 degrees. Since the human body rarely rotates when it falls, the angle of inclination (Yaw) around the x-axis θY and the Pitch angle (Pitch) around the y-axis θp are selected as the angle features in this paper. The inclination threshold of the trunk deviating from the z-axis to distinguish the human fall process from other daily life behavior process is θT. The significance is as follows: in the process of fall, at least one of the angles of roll θY and pitch θp after a fall is greater than θT. Before the fall and in the course of other daily life behaviors, the angle of roll θY and pitch θp was less than θT.
4. The Support Vector Machine Method Is Adopted to Determine the Threshold
Threshold analysis is essentially a classification method based on linear discriminant function, which requires different categories of samples to be linearly separable. Support vector machine (SVM) is a kind of model classification technology with a good classification effect. In this paper, SVM is used to analyze human falling behavior and other activities of daily life, to obtain the threshold information of the combined acceleration value, human energy expenditure value, and angle value of the effective fall process.
4.1. Introduction to Support Vector Machine Methods
SVM uses linearly separable or nonlinearly separable training sample set; in the original feature space, the relative training sample set uses the optimization theory to generate the optimal linear discriminant function, which is implicitly mapped to the transformation feature space through the kernel function, so that the original pattern set is linearly separable in the transformation feature space.
Since the purpose of the research in this paper is to distinguish human falling behavior from other behaviors in daily life, it is a two-type problem. In the dichotomy problem, the problem can be described as follows: let the given n-dimensional training sample set {x1, x2, …xN}. There are two sample sets, corresponding to two attribute values, which are, respectively, the attribute value yi = 1 of the training sample {xi} of the class P1 and the attribute value yi = −1 of the training sample {xj} of the class P2. Therefore, each training sample can be reexpressed as (x1, y1), (x2, y2), …, (xN, yN). Assuming that the training samples are linearly separable, there is a linear interface that can divide the training samples into two categories [24]. Obviously, there are many of these decision boundaries, many of the linear discriminant functions that have been selected.
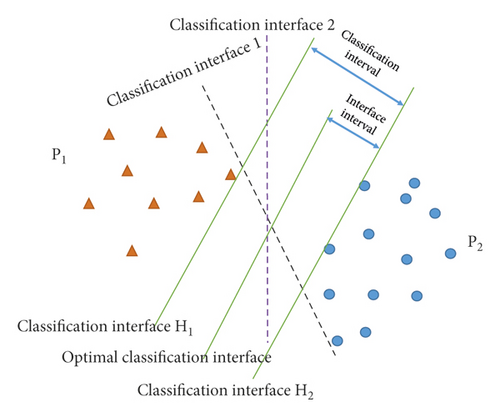
The goal is to obtain a classification interface that can not only correctly separate the two types of sample elements but also maximize the distance between the classification interface and the nearest sample point. In other words, the selected linear classification interface should make the distance between the two planes parallel to the interface pass through the point closest to the classification interface of the two types of samples respectively to the maximum, so it should be the middle position of the two planes, as shown in Figure 2. This classification interface is also called the optimal interface, and its corresponding classifier is called the maximum allowance classifier. The distance between the two planes is called the classification interval, and the training samples on the two planes determine the optimal classification interface, which is called the support vector. Obviously, the generalization of the optimal classification interface is the best.
SVM can be used to classify human fall behavior and the kinematics process of other daily life behaviors and activities, and sample training of these two kinds of sample sets is needed to determine the threshold.
4.2. Determination of Thresholds
-
PT: training samples are used to obtain the optimal classification interface in the classification method of SVM. The training sample set contains 90 data samples of falling behavior and 30 data samples of other daily life behaviors, and a total of 360 data samples.
-
PE: experimental samples are used to conduct experiments on the recognition effect of the threshold method to determine whether there is a fall. The experimental sample set contains data samples of 60 groups of fall behaviors (10 groups of forwarding falls, 10 groups of left falls, 10 groups of right falls, 10 groups of backward falls, and 20 groups of falls during walking) and 20 groups of other activities in daily life, a total of 240 data samples.
-
Then, the data samples in the training sample set PT are divided into two disjoint sets according to whether it is fall or not, namely, the two kinds of sample sets in the SVM training process.
-
PF: fall activities data set of human fall behaviors consist of 90 groups of fall behavior data samples, including 15 groups of forwarding falls, 15 groups of left falls, 15 groups of right falls, 15 groups of backward falls, and 30 groups of falls during walking.
-
PO: data sample set of other daily life activities, consisting of 30 groups of each group and 270 groups of data sample sets.
Next, the training sample set is PT trained by the SVM method to obtain the classification threshold. The threshold values of the combined acceleration, movement energy expenditure, and tilt angle of sensors used to distinguish human falling behavior from other daily life behaviors are denoted as aT, ET, and θT, respectively. The occurrence algorithm of human fall behavior detection based on the threshold method will be introduced in the next section. To increase the flexibility of the algorithm, the experiment in this paper sets, aT, ET, and θT, respectively, so that different classification method can be combined.
4.2.1. Determination of the Combined Acceleration Threshold aT for Fall Recognition
Since the peak value of the combined acceleration in the process of falling is larger than that in other daily activities (except for violent activities such as running and jumping), the peak value of the combined acceleration in the process of human movement is taken as one of the characteristics to distinguish falling from other daily activities. Take the sum of the data sample sets PF and PO, calculate the combined acceleration of each sample, and get the combined acceleration peak of the moving process related to each sample, which are, respectively, denoted as sets Pa1 and Pa2.
The sum of the combined peak acceleration Pa1 and Pa2is extracted from the sum of two training sample sets PF and PO, respectively, so the sum of Pa1 and Pa2 is independent of each other. Assuming that they are linearly separable, the SVM method is adopted to determine the optimal classification interface.
According to the introduction in Section 4.1, the optimal classification hyperplane is x = 29.16 m/s2.
So, the classification rule is as follows: if x ≤ b, then set x ∈ Pa1. If x > b, then set x ∈ Pa2. That is to say, the threshold value of the combined acceleration is aT = 29.16 m/s2. When the combined acceleration of human movement a > aT occurs at a certain moment, the movement is judged to be a fall; otherwise, the movement is judged to be other movement behaviors in daily life.
In the above threshold calculation process, statistical analysis is carried out on the basis of the training sample set. In this sample set, Pa1∩Pa2 = ϕ, Pa1 and Pa2 are linearly separable for one-dimensional samples. But in real everyday life, Pa1 and Pa2 in some cases are nonlinearly separable. For example, running, jumping, and other more intense activities in the peak acceleration aT may exceed the threshold, but there is no fall. One the contrary for the fall of leaning on the wall when dizziness occurs, the peak acceleration aT may be less than the threshold value, but there is a falling behavior. Therefore, the threshold aT value cannot be used as the only criterion to identify whether a fall has occurred. However, the combined acceleration threshold aT is still important for the identification of falls because violent sports such as running and jumping rarely occur among the elderly, the impact force on the body is not large, and the impact of injury to the elderly is relatively small for the fall situation of slowly sliding on the wall.
4.2.2. Determination of Human Movement Energy Expenditure ET for Fall Recognition
The body will act with a great shock in the process of falling; the movement energy expenditure has a close relationship with the force. Therefore, the movement energy expenditure in the process of falling is higher than other daily life actions, so take the movement energy expenditure as one of the characteristics to distinguish fall and other daily activities.
Since the research focus of this paper is to identify falls of the elderly living alone, the data samples collected are all from the daily indoor living activities of the elderly. To better distinguish violent sports, such as running, from falls and expand the application objects and scenarios for recognizing falls based on the smartphone, this part of the experimental sample set added 80 groups of running, fast upstairs, and fast downstairs sports from young volunteers. The training sample set increases fast running and going up the stairs and down the stairs in 50 groups; the experimental sample set increases running and going up the stairs and down the stairs quickly in 30 groups. The training sample set, experimental sample set, and other sports behavior data set in daily life after adding samples of running, going up the stairs, and going down the stairs quickly are denoted, respectively, as sets , , and .
Take the data sample sets PF and , calculate the movement energy expenditure value E of each sample, and get the movement energy expenditure value related to each sample, denoted as sets PE1 and PE2, respectively.
According to the introduction in Section 4.1, the optimal classification hyperplane is y = 116 cal.
So, the classification rule is as follows: if y ≤ b, then set y ∈ PE1 and if y > b, then set y ∈ PE2. In other words, the threshold value of human movement energy expenditure is ET = 116 cal. In general, during daily fast running, E will not exceed 116 cal. However, the impact force of falling is large, so the body’s combined acceleration will be large. As a result, the energy expenditure of the human body during falling will exceed 116 cal. When the energy expenditure value of human movement Ε > ET at a certain moment, the movement is judged to be a fall; otherwise, the movement is judged to be other movement behaviors in daily life.
In the above threshold calculation process, statistical analysis is carried out on the basis of the training sample set . In this sample set, PE1∩PE2 = ϕ, and PE1 and PE2 are linearly separable for one-dimensional samples. But in real everyday life, PE1 and PE2 in some cases are nonlinearly separable. For example, when a person swings somewhere, the calculated energy expenditure of a person’s movement may exceed the threshold ET, but no fall occurs. Therefore, the threshold ET cannot be used as the only criterion to identify whether a fall has occurred. However, the threshold of human movement energy expenditure is still an important basis for fall recognition, and the threshold ET can be used as a condition to identify whether a fall occurs. Combined with the judgment of the combined acceleration, the misjudgment can be further reduced, and the accuracy of fall recognition can be improved.
4.2.3. Determining the Tilt Angle θT of Fall Recognition
The direction of the body will change dramatically when the fall occurs. Generally, the body is in an upright position before the fall, and the final state of the fall is lying flat, lying on the back, prone, or side, and the body is in a horizontal or nearly horizontal state. Therefore, the tilt angle of the body away from the z-axis during human movement can be taken as one of the characteristics to distinguish falls from other daily behavior activities. Sample sets PF of fall behavior data were taken to calculate the tilt angle θ of the human body from the z-axis after the fall in each sample. Here, the tilt angle included roll angle θY and pitch angle θP, and they were recorded as the set Pθ1. Then, take the data sample set of other daily life behaviors and activities, calculate the inclination angle of the body deviating from the z-axis in each sample at each moment, and write them as set Pθ2.
Similar to processing the combined acceleration threshold, Pθ1 and Pθ2 of the inclination angle set are extracted from the two training sample sets PF and PO, respectively, so Pθ1 and Pθ2 are independent of each other. Assuming that Pθ1 and Pθ2 are linearly separable, the SVM method is adopted to determine the optimal classification interface.
According to the introduction in Section 4.1, the optimal classification hyperplane is z = 41.36°.
So, the classification rule is as follows: if Z ≤ b, then set Z ∈ Pθ1, and if Z > b, then set Z ∈ Pθ2. In other words, the threshold θT value of the body tilt angle away from the z-axis is θT = 41.36°. When at least one of the tilt angles of the body is away from the z-axis, the angle of roll θY and pitch θP is greater than the angle of θT at a certain moment, the movement is considered a fall. Otherwise, the movement is considered as other movement behaviors in daily life.
In the above threshold calculation process, statistical analysis is carried out on the basis of the training sample set PT. In this sample set Pθ1∩Pθ2 = ϕ, Pθ1 and Pθ2 are linearly separable for one-dimensional samples. But in real everyday life, Pθ1 and Pθ2 in some cases are nonlinearly separable. For example, when you lie down to sleep, bend over to get something, your body leans over the threshold θT, but you do not fall. Therefore, the value of the threshold θT cannot be used as the only criterion to identify whether a fall has occurred. However, combining with the judgment of the combination acceleration and movement energy expenditure can further reduce the misjudgment and improve the recognition rate of fall behavior.
5. The Three-Level Human Fall Recognition Algorithm Based on Threshold Analysis
Considering the complexity and randomness of the human movement process, there will be a lot of misjudgment when using a single acceleration or angle-related information to identify human fall behavior. Therefore, using the accelerometer and gyroscope sensor, respectively, for acceleration and angle information, acceleration in the process of human movement information is obtained by information fusion and angle information to assess the impact of movement energy expenditure and the change of the posture, set a threshold value, and complete the movement behavior of human body detection, to identify fall behavior. Falling behavior can be identified more accurately by combining the threshold of body combined acceleration aT, the threshold of movement energy expenditure ET, and the threshold θT of body tilt angle from the z-axis in the process of human movement to reduce misjudgment. This is an important method for human fall behavior recognition.
The whole process of human falls usually takes place within 2 to 3 seconds. Therefore, when combining the body’s combined acceleration information, the movement energy expenditure information, and the body’s tilt angle away from the z-axis information, we need to consider the correlation of the three pieces of information. When a general fall occurs, the body will be subjected to a large impact force, the combined acceleration will have a peak, and the energy expenditure per unit of time will have a large peak. However, in some cases, the body will be impacted by several forces (e.g., falling down the stairs, the body will hit multiple steps), the combined acceleration will have multiple peaks, and the energy expenditure of the movement will remain high. In this case, the fall can take more than 2 to 3 seconds.
- (a)
When a(t) ≤ aT, there will be no impact and no fall
- (b)
When a(t) > aT, there is an impact and there may be falling behavior
- (a)
When E(t) ≤ ET, the body dynamics change little, the energy expenditure is very low, and there will be no fall
- (b)
When E(t) > ET, the body dynamic changes greatly, the movement energy expenditure is high, and a fall may occur
- (a)
Before the fall: θ(t) ≤ θT; then, θY ≤ θ(t) and θP ≤ θ(t)
- (b)
After the fall: θ(t) > θT; then, θY > θ(t) or θP > θ(t) or θY, θP > θ(t)
Thus, a human fall recognition algorithm based on the combined acceleration of human movement, the energy expenditure of movement, and the tilt angle of the body away from the z-axis is obtained, which is denoted as Algorithm 1. Algorithm 1 will follow the following steps:
Algorithm 1: The threshold-based three-level human fall recognition algorithm.
-
Step 1: The system is initialized and ready to collect information related to human movement. According to the definition of coordinate direction introduced, the triaxial acceleration information of the upper trunk and the angular velocity information of the body around the x-axis and y-axis were collected, and the combined acceleration a(t) at time t, the movement energy expenditure E(t) at time t, and the tilt angle θ(t) of the body away from the z-axis were calculated. Define a data storage space and store the combined acceleration, human movement energy expenditure, and body tilt angle in the form of a sliding time window within 2 seconds before the moment. When the new data arrive, the sliding time window moves forward, the new data are stored, and the earliest data storage space is released.
-
Step 2: Test whether the first impact occurs at the current moment: if a(t) ≤ aT, there is no impact state, and no fall will occur. Continue monitoring and return to Step 1. If a(t) > aT, the first impact is confirmed, and a fall may occur, enter Step 3.
-
Step 3: Measure the energy expenditure of human movement calculated at the current moment: if E(t) ≤ ET the dynamic change of body movement is not large, the energy expenditure of movement is low, and there will be no fall, but only fast walking, running, and so on. Continue monitoring and return to Step 1. If E(t) > ET, the dynamic change of body movement is large, and the energy expenditure is high, a fall may occur. Record the time at this time as t0, and enter Step 4.
-
Step 4: The movement information t1 = t0 − 2 of the human body in the first 2 seconds of the time t0 is recorded, and the tilt angle of the body from the z-axis is denoted as below.
-
Step 5: Test whether the impact state is over and whether it is multiple impact falls. The detection method of whether there is still impact in this step is as follows: obtain the relevant motion information within 1 second after the current moment to detect whether there is impact, that is a(t) > aT, and whether it is still valid. If it is true, it means that the fall is a multi-impact fall, and the impact is not over yet, so the detection of the impact state should be continued in Step 5.
-
Step 6: If a(t) > aT, it is not true; it means that the impact has ended. The end time of the last impact is recorded as t2. At this point, the relevant information of human motion is continued to be obtained to get the tilt angle of the body from the z-axis in seconds t2 + 1, denoted as θ2.
-
Step 7: To determine whether the change condition of body tilt angle meets the characteristics of falling behavior, if θ1 ≤ θT and θ2 > θT, it is judged that the fall behavior process has occurred. Otherwise, it is judged that the falling behavior did not occur, and real-time monitoring should be continued.
6. Experimental Results and Analysis
To verify the effectiveness and accuracy of the three-level threshold test method proposed in this paper, which is based on the combined acceleration, the movement energy expenditure, and the tilt angle of the body away from the z-axis, for the identification of human fall behavior, the information processing process of Algorithm 1 is tested. The sample allocation method used in Section 4.2 to determine the threshold is used to segment the data samples, and all the data sample sets are divided into two disjoint sets, PT, PE, and their relation is PT∩PE = ϕ, ϕ is the empty set.
PT: training sample set, including 90 groups of falling behavior data samples and 30 groups of other behavior data samples in daily life, a total of 360 data samples.
PE: experimental sample set, including 60 groups of fall behavior data samples (10 groups of forwarding falls, 10 groups of left fall, 10 groups of right fall, 10 groups of backward fall, 20 groups of fall in walking) and 20 groups of other behavior data samples in daily life, a total of 240 data samples.
Therefore, 240 data samples from the experimental sample set PE are used to conduct a comparative experiment on Algorithm 1. In the algorithm, the threshold ET of combined acceleration, the threshold of movement energy expenditure, and the threshold θT of body tilt angle from z-axis are, respectively, aT = 29.16 m/s2, ET = 116 cal, θT = 41.36°
-
P1: standing sample set, including 20 groups of data samples of standing behavior.
-
P2: walking sample set, including 20 groups of walking behavior process data samples.
-
P3: the seated sample set, consisting of 20 data samples of chair sitting behavior.
-
P4: the standing-sitting sample set, including 20 data samples.
-
P5: the sitting-up sample set, including 20 data samples of the sitting-up behavior process.
-
P6: standing and squatting sample set, including 20 groups of standing and squatting behavior data samples.
-
P7: squatting and standing up sample set, including 20 groups of squatting and standing up behavioral process data samples.
-
P8: the stair climbing sample set, including 20 groups of stair climbing behavior data samples.
-
P9: stairway down sample set, including 20 groups of stairway down behavior process data samples.
-
P10: fall sample set, including 40 groups of data samples of fall behavior process.
-
P11: sample set of falls during walking, including data samples of 20 groups of forwarding falls during walking. Falling in walking is actually a coherent behavioral process integrating three behavioral processes of standing-walking-forward falling as one.
Algorithm 1 is based on the triaxial accelerometer and gyroscope fall recognition algorithm of the human body, with the experimental sample set on the experimental verification, namely, the body acceleration value and human movement energy expenditure value were calculated by three axial acceleration information, and the body angle deviating from the z-axis was calculated by the gyro information. According to the process of Algorithm 1, whether human falling behavior occurs is detected.
The process of falling in walking is actually a coherent movement of standing, walking, and forward falling, and its research and analysis are representative. Figures 3(a)–3(c) show the change curves of the combination acceleration, movement energy expenditure, pitch angle, and roll angle after information fusion in this process.
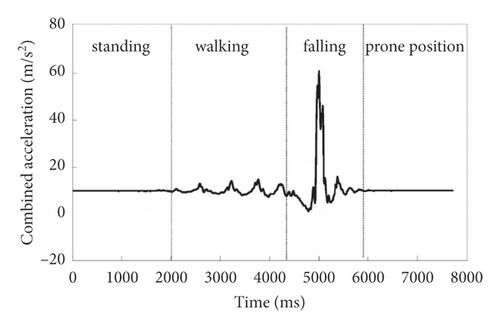
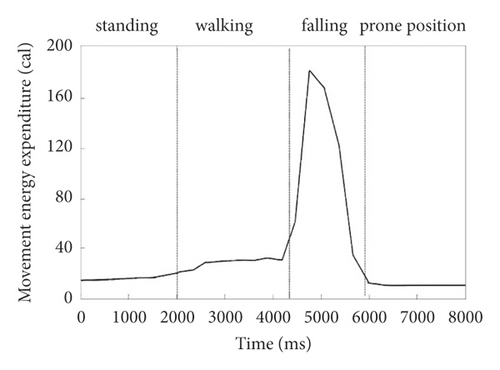
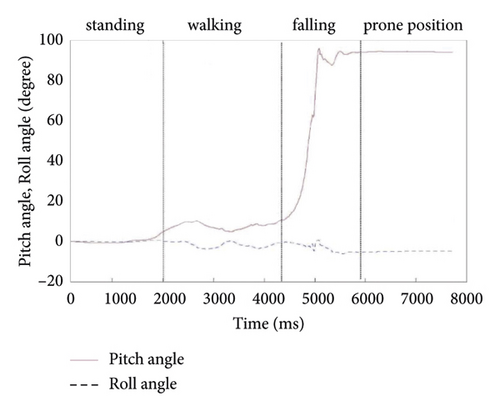
Figure 3(a) shows that, in the standing and prone stages, the combined acceleration value is close to G, and the body movement is relatively stable. However, in the walking stage, the resultant acceleration changes periodically, and its peak value is always less than the threshold value, failing to meet the conditions for the occurrence of falls. For the stage of standing, walking, and prone, the dynamic changes of the body were not significant, and the movement energy expenditure was lower than 35 cal. In Figure 3(c), the purple dotted line curve is the change curve of roll angle, and the red real curve is the change curve of pitch angle. As can be seen in the figure, the pitch angle changes a lot and the roll angle changes slightly when the forward fall occurs.
All the above experimental samples are tested by Algorithm 1 to get the recognition results of various movement behaviors and falls in the daily life of the elderly, as shown in Table 2.
| Sample set | Identify the results | |
|---|---|---|
| Fall behavior | Other daily sports activities | |
| Standing P1 | 0 | 20 |
| Walking P2 | 0 | 20 |
| Sitting P3 | 0 | 20 |
| Standing to sitting P4 | 1 | 19 |
| Sitting to standing P5 | 2 | 18 |
| Standing to squatting P6 | 2 | 18 |
| Squatting to standing P7 | 1 | 19 |
| Upstairs P8 | 0 | 20 |
| Downstairs P9 | 1 | 19 |
| Falling P10 | 36 | 4 |
| Fall while walking P11 | 20 | 0 |
| Test PE | 63 | 177 |
The research of human fall behavior recognition needs to have high enough recognition accuracy to identify fall behavior from people’s daily activities. Fall recognition is generally evaluated using three indicators based on the four possible situations in Table 3.
| Detect | Fall occur | Fall not occur |
|---|---|---|
| Fall detected | True positive (TP) | False positive (FP) |
| No fall detected | False negative (FN) | False negative (TN) |
Among them, TP (true positives) is the sample number of falling behaviors recognized correctly. FN (false negatives) is the sample number of falling behaviors that have not been recognized. TN (true negatives) refers to the sample number of other daily life behaviors that can be correctly identifed without falls occurring. FP (false positives) is the sample number of other daily life behaviors misjudged as falling.
P represents the number of falls that occurred and N represents the number of falls that did not occur.
After calculation, the sensitivity = 93.33%, specificity = 96.11%, and accuracy = 95.42%.
In [24], the threshold analysis method was adopted to identify falling behavior based on acceleration threshold information. The experimental results were as follows: sensitivity = 88.75% and specificity = 96.25%, which were lower than the identification results in this paper. The advantages of the three-level threshold algorithm proposed in this paper for human falling behavior recognition are obvious.
In practical application, because the specificity of the algorithm is not very accurate, some misjudgments will occur. To reduce unnecessary medical expenses and the excessive concern of related personnel, the smartphone will beep an alarm when detecting the user’s fall. If it is a misjudgment, the user can manually cancel the alarm within 30 seconds. If the buzzer is not cancelled within 30 seconds [25], it means that the user may have lost the ability, and the APP will send an alarm automatically.
7. Conclusions
This research work made full use of accelerometer and gyroscope built in the smartphone, the body movement energy expenditure value is introduced as a new feature, and an algorithm is proposed through the combined acceleration, movement energy expenditure, and the relative vertical direction angle in the process of human movement to judge whether the fall occurs. The recognition accuracy of the algorithm is tested. The experiment verifies that the accuracy of the fall behavior recognition is 95.42%, higher than the recognition accuracy in the analysis research with a similar threshold value, which verifies the practical effectiveness of the fall behavior recognition based on the built-in sensor of the smartphone. The full use of the smartphone can realize the detection of falling behavior and automatically send an alarm timely.
Conflicts of Interest
The authors declare no conflicts of interest.
Acknowledgments
This work was supported by the National High Technology Research and Development Program of China (863 Program) under Grant 2013AA01A215.
Open Research
Data Availability
All data used to support the findings of the study are included within the article.


